EX-99.2
Published on February 22, 2023

Athene Asset Portfolio Risk & Stress Considerations Update February 2023
Disclaimer & Presentation Note This presentation does not constitute an offer to sell, or the solicitation of an offer to buy, any security of Athene Holding Ltd. (“Athene”). This presentation contains, and certain oral statements made by Athene’s representatives from time to time may contain, forward-looking statements within the meaning of the Private Securities Litigation Reform Act of 1995, Section 27A of the Securities Act of 1933, as amended, and Section 21E of the Securities Exchange Act of 1934, as amended. Such statements are subject to risks, uncertainties and assumptions that could cause actual results, events and developments to differ materially from those set forth in, or implied by, such statements. These statements are based on the beliefs and assumptions of Athene’s management and the management of Athene’s subsidiaries. Generally, forward-looking statements include actions, events, results, strategies and expectations and are often identifiable by use of the words “believes,” “expects,” “intends,” “anticipates,” “plans,” “seeks,” “estimates,” “projects,” “may,” “will,” “could,” “might,” or “continues” or similar expressions. Forward looking statements within this presentation include, but are not limited to, benefits to be derived from Athene's capital allocation decisions; the anticipated performance of Athene's portfolio in certain stress or recessionary environments; the performance of Athene's business; general economic conditions; the failure to realize economic benefits from the merger with Apollo; expected future operating results; Athene's liquidity and capital resources; and other non- historical statements. Although Athene management believes that the expectations reflected in these forward-looking statements are reasonable, it can give no assurance that these expectations will prove to be correct. For a discussion of other risks and uncertainties related to Athene's forward-looking statements, see its annual report on Form 10-K for the year ended December 31, 2021 and quarterly report on Form 10-Q filed for the period ended September 30, 2022, which can be found at the SEC’s website at www.sec.gov. All forward-looking statements described herein are qualified by these cautionary statements and there can be no assurance that the actual results, events or developments referenced herein will occur or be realized. Athene does not undertake any obligation to update or revise forward-looking statements to reflect changed assumptions, the occurrence of unanticipated events or changes to future operating results. Information contained herein may include information respecting prior performance of Athene. Information respecting prior performance, while a useful tool, is not necessarily indicative of actual results to be achieved in the future, which is dependent upon many factors, many of which are beyond Athene's control. The information contained herein is not a guarantee of future performance by Athene, and actual outcomes and results may differ materially from any historic, pro forma or projected financial results indicated herein. Certain of the financial information contained herein is unaudited or based on the application of non-GAAP financial measures. These non-GAAP financial measures should be considered in addition to and not as a substitute for, or superior to, financial measures presented in accordance with GAAP. Furthermore, certain financial information is based on estimates of management. These estimates, which are based on the reasonable expectations of management, are subject to change and there can be no assurance that they will prove to be correct. The information contained herein does not purport to be all-inclusive or contain all information that an evaluator may require in order to properly evaluate the business, prospects or value of Athene. Athene does not have any obligation to update this presentation and the information may change at any time without notice. Models that may be contained herein (the “Models”) are being provided for illustrative and discussion purposes only and are not intended to forecast or predict future events. Information provided in the Models may not reflect the most current data and is subject to change. The Models are based on estimates and assumptions that are also subject to change and may be subject to significant business, economic and competitive uncertainties, including numerous uncontrollable market and event driven situations. There is no guarantee that the information presented in the Models is accurate. Actual results may differ materially from those reflected and contemplated in such hypothetical, forward-looking information. Undue reliance should not be placed on such information and investors should not use the Models to make investment decisions. Athene has no duty to update the Models in the future. Certain of the information used in preparing this presentation was obtained from third parties or public sources. No representation or warranty, express or implied, is made or given by or on behalf of Athene or any other person as to the accuracy, completeness or fairness of such information, and no responsibility or liability is accepted for any such information. The contents of any website referenced in this presentation are not incorporated by reference. This document is not intended to be, nor should it be construed or used as, financial, legal, tax, insurance or investment advice. There can be no assurance that Athene will achieve its objectives. Past performance is not indicative of future success. All information is as of the dates indicated herein. Notice to Reader This presentation provides refreshed versions of Athene’s asset stress test scenarios, calculated using as-reported financial data as of December 31, 2022. A stagflation stress test scenario has been introduced to provide additional perspective around current macroeconomic trends and observations. 2
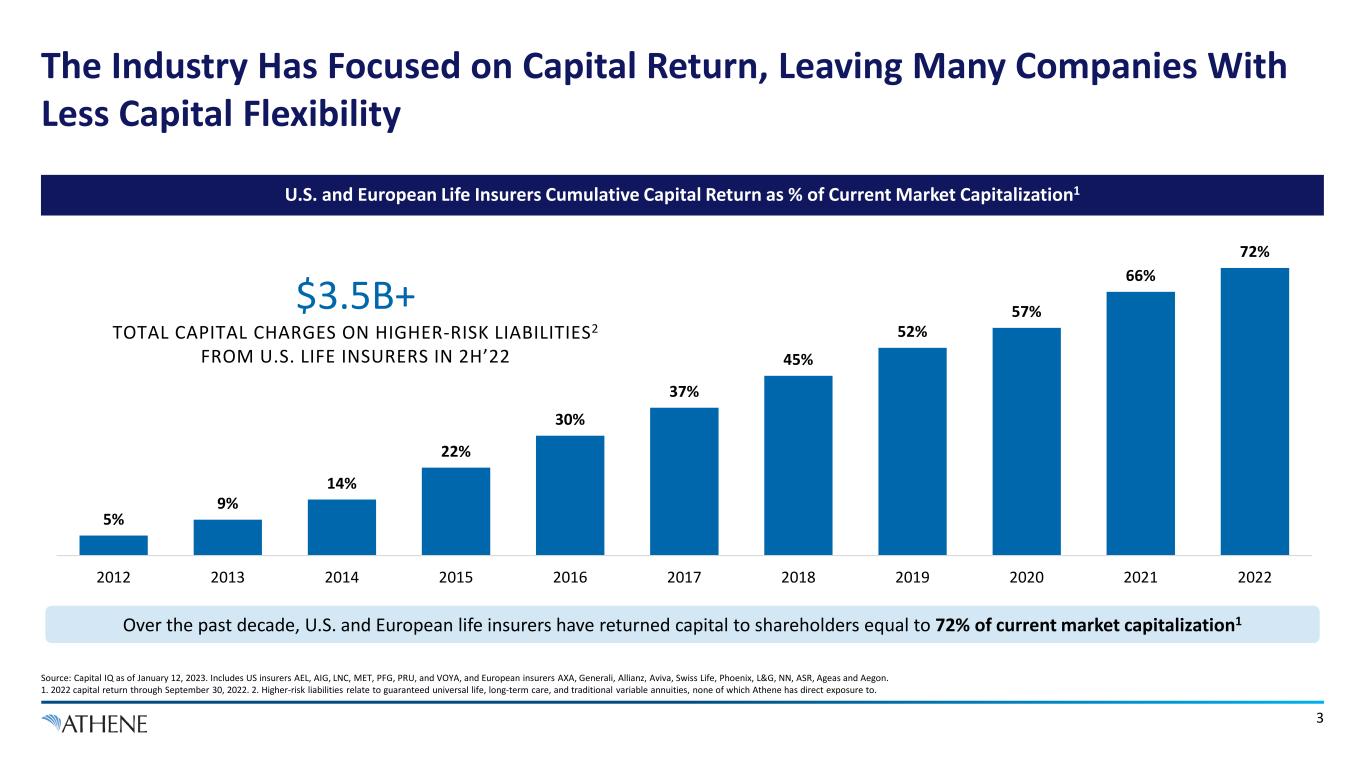
5% 9% 14% 22% 30% 37% 45% 52% 57% 66% 72% 2012 2013 2014 2015 2016 2017 2018 2019 2020 2021 2022 3 The Industry Has Focused on Capital Return, Leaving Many Companies With Less Capital Flexibility Source: Capital IQ as of January 12, 2023. Includes US insurers AEL, AIG, LNC, MET, PFG, PRU, and VOYA, and European insurers AXA, Generali, Allianz, Aviva, Swiss Life, Phoenix, L&G, NN, ASR, Ageas and Aegon. 1. 2022 capital return through September 30, 2022. 2. Higher-risk liabilities relate to guaranteed universal life, long-term care, and traditional variable annuities, none of which Athene has direct exposure to. U.S. and European Life Insurers Cumulative Capital Return as % of Current Market Capitalization1 Over the past decade, U.S. and European life insurers have returned capital to shareholders equal to 72% of current market capitalization1 $3.5B+ TOTAL CAPITAL CHARGES ON HIGHER-RISK LIABILITIES2 FROM U.S. LIFE INSURERS IN 2H’22
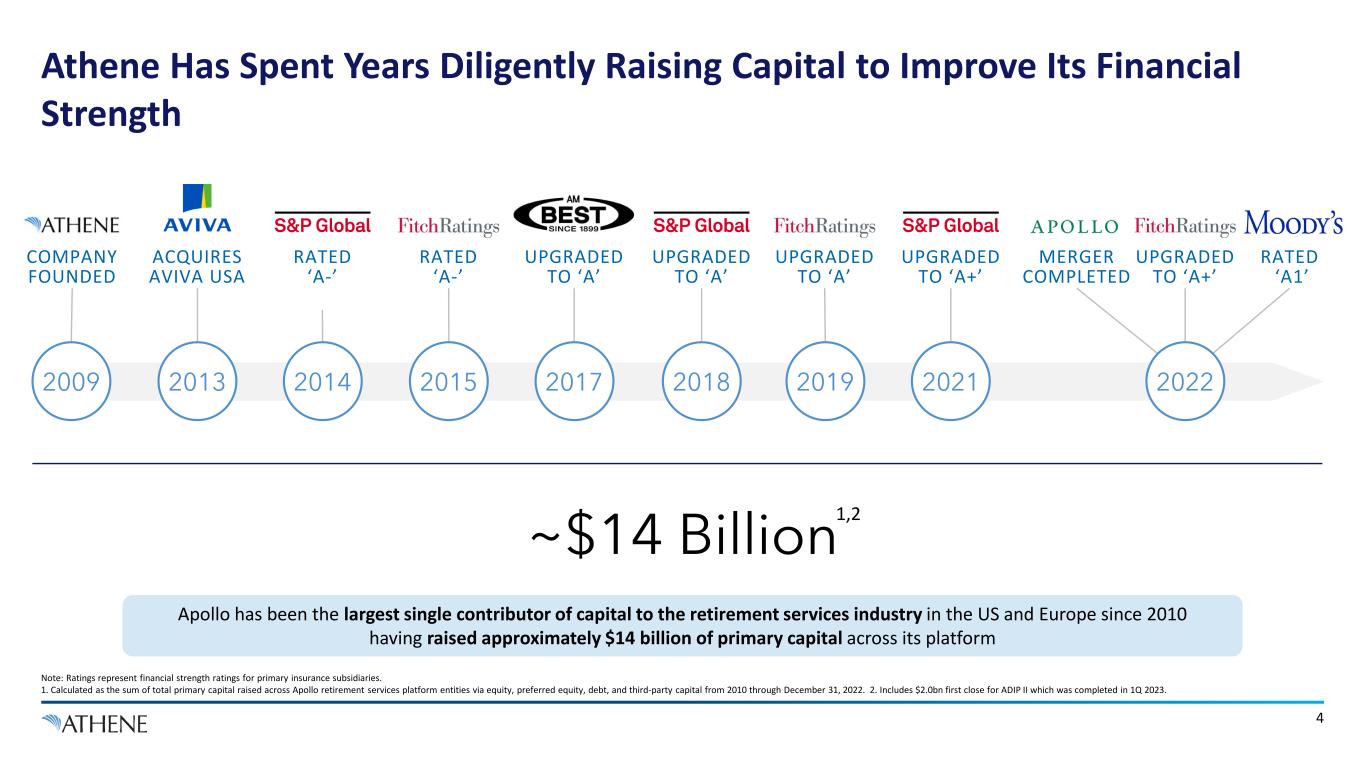
4 ACQUIRES AVIVA USA 20152014 20212017 202220182013 RATED ‘A-’ RATED ‘A-’ UPGRADED TO ‘A’ UPGRADED TO ‘A’ UPGRADED TO ‘A+’ UPGRADED TO ‘A+’ RATED ‘A1’ MERGER COMPLETED 2009 COMPANY FOUNDED 2019 UPGRADED TO ‘A’ Athene Has Spent Years Diligently Raising Capital to Improve Its Financial Strength Note: Ratings represent financial strength ratings for primary insurance subsidiaries. 1. Calculated as the sum of total primary capital raised across Apollo retirement services platform entities via equity, preferred equity, debt, and third-party capital from 2010 through December 31, 2022. 2. Includes $2.0bn first close for ADIP II which was completed in 1Q 2023. Apollo has been the largest single contributor of capital to the retirement services industry in the US and Europe since 2010 having raised approximately $14 billion of primary capital across its platform ~$14 Billion1,2
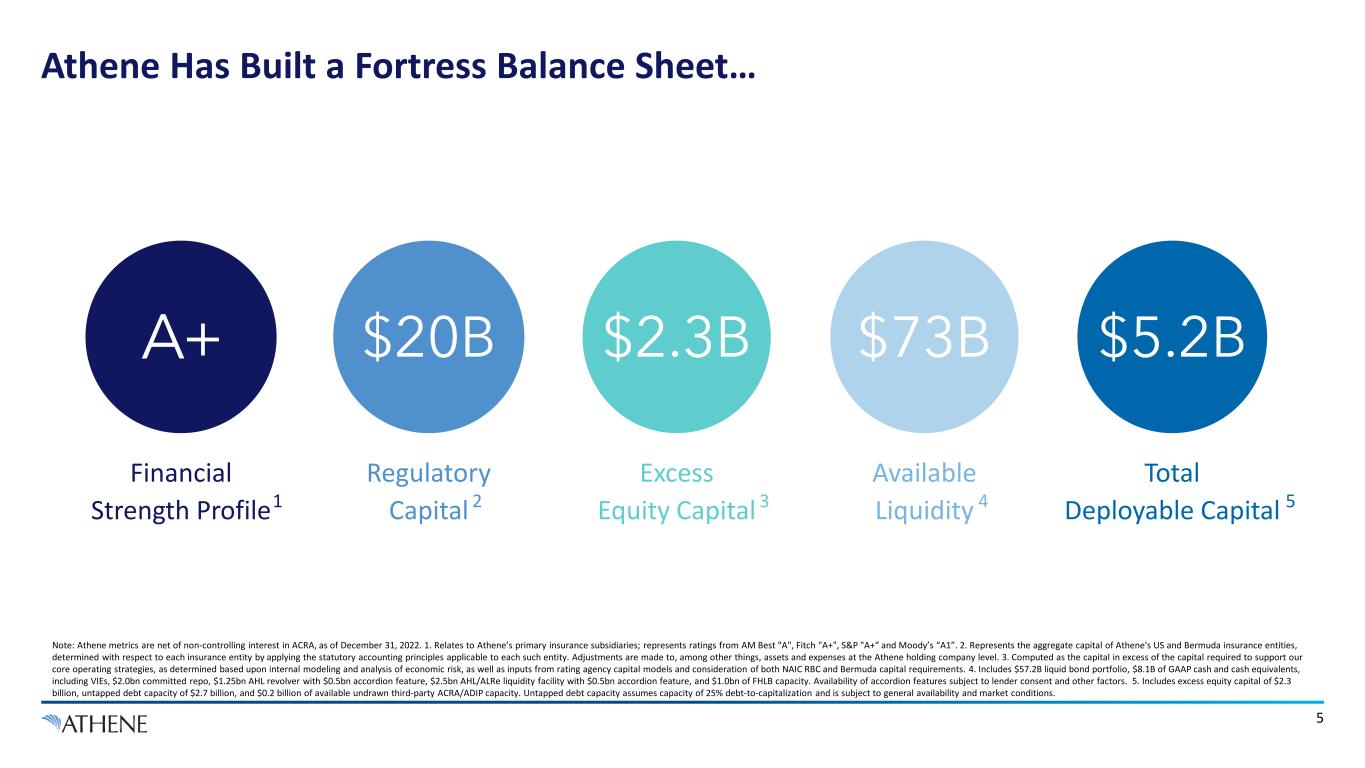
5 Note: Athene metrics are net of non-controlling interest in ACRA, as of December 31, 2022. 1. Relates to Athene’s primary insurance subsidiaries; represents ratings from AM Best "A", Fitch "A+", S&P "A+“ and Moody’s “A1”. 2. Represents the aggregate capital of Athene's US and Bermuda insurance entities, determined with respect to each insurance entity by applying the statutory accounting principles applicable to each such entity. Adjustments are made to, among other things, assets and expenses at the Athene holding company level. 3. Computed as the capital in excess of the capital required to support our core operating strategies, as determined based upon internal modeling and analysis of economic risk, as well as inputs from rating agency capital models and consideration of both NAIC RBC and Bermuda capital requirements. 4. Includes $57.2B liquid bond portfolio, $8.1B of GAAP cash and cash equivalents, including VIEs, $2.0bn committed repo, $1.25bn AHL revolver with $0.5bn accordion feature, $2.5bn AHL/ALRe liquidity facility with $0.5bn accordion feature, and $1.0bn of FHLB capacity. Availability of accordion features subject to lender consent and other factors. 5. Includes excess equity capital of $2.3 billion, untapped debt capacity of $2.7 billion, and $0.2 billion of available undrawn third-party ACRA/ADIP capacity. Untapped debt capacity assumes capacity of 25% debt-to-capitalization and is subject to general availability and market conditions. Athene Has Built a Fortress Balance Sheet… Financial Strength Profile A+ $2.3B Excess Equity Capital 3 $20B Regulatory Capital 2 $5.2B Total Deployable Capital 5 Available Liquidity $73B 41
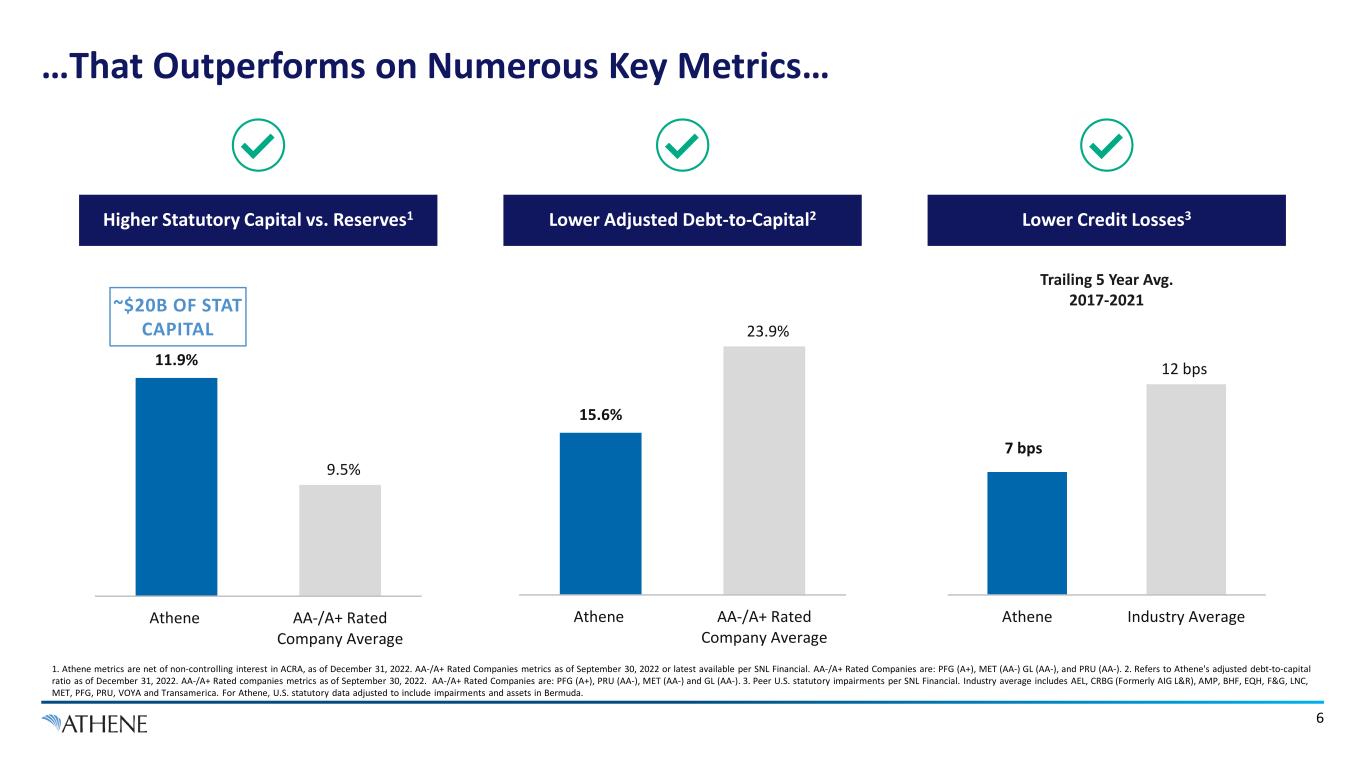
6 ~$20B OF STAT CAPITAL 7 bps 12 bps Athene Industry Average Trailing 5 Year Avg. 2017-2021 1. Athene metrics are net of non-controlling interest in ACRA, as of December 31, 2022. AA-/A+ Rated Companies metrics as of September 30, 2022 or latest available per SNL Financial. AA-/A+ Rated Companies are: PFG (A+), MET (AA-) GL (AA-), and PRU (AA-). 2. Refers to Athene's adjusted debt-to-capital ratio as of December 31, 2022. AA-/A+ Rated companies metrics as of September 30, 2022. AA-/A+ Rated Companies are: PFG (A+), PRU (AA-), MET (AA-) and GL (AA-). 3. Peer U.S. statutory impairments per SNL Financial. Industry average includes AEL, CRBG (Formerly AIG L&R), AMP, BHF, EQH, F&G, LNC, MET, PFG, PRU, VOYA and Transamerica. For Athene, U.S. statutory data adjusted to include impairments and assets in Bermuda. Higher Statutory Capital vs. Reserves1 Lower Adjusted Debt-to-Capital2 Lower Credit Losses3 15.6% 23.9% Athene AA-/A+ Rated Company Average …That Outperforms on Numerous Key Metrics… 11.9% 9.5% Athene AA-/A+ Rated Company Average
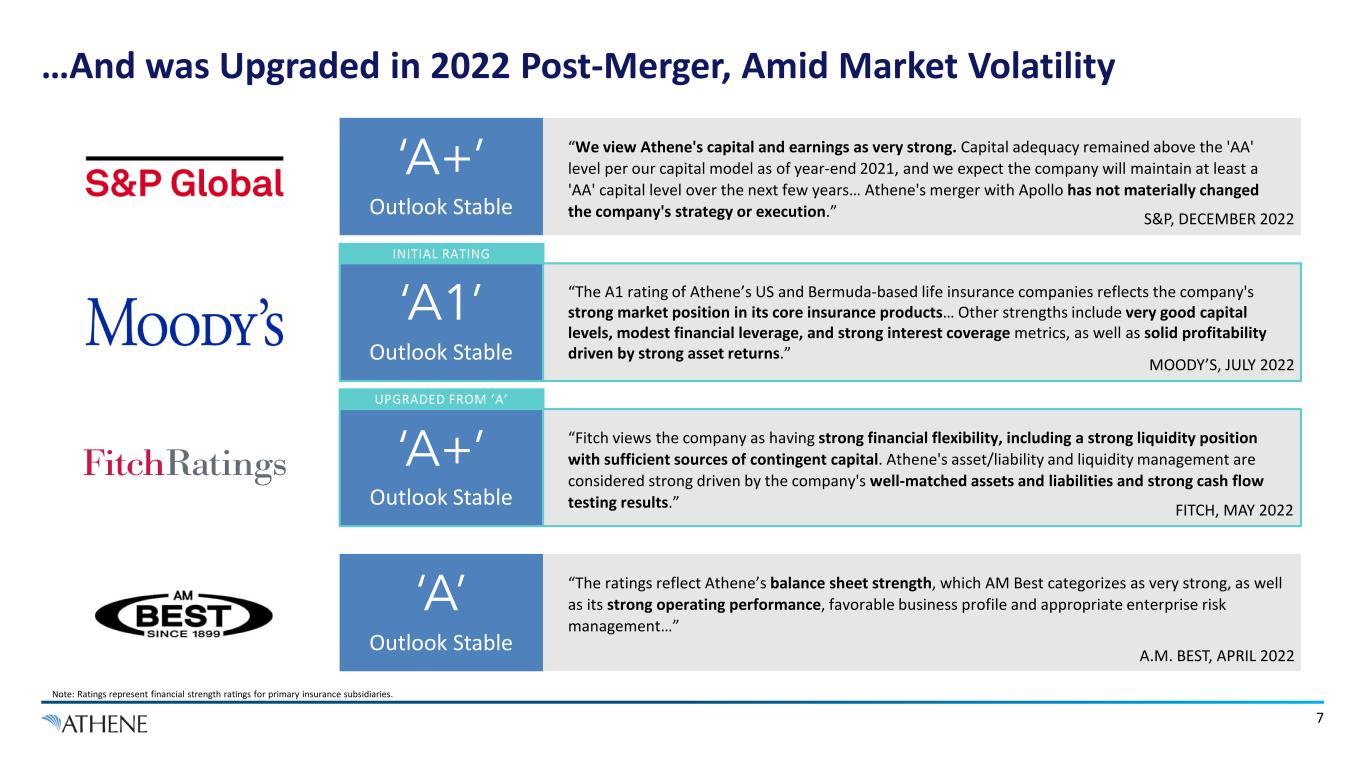
7 Note: Ratings represent financial strength ratings for primary insurance subsidiaries. …And was Upgraded in 2022 Post-Merger, Amid Market Volatility “The A1 rating of Athene’s US and Bermuda-based life insurance companies reflects the company's strong market position in its core insurance products… Other strengths include very good capital levels, modest financial leverage, and strong interest coverage metrics, as well as solid profitability driven by strong asset returns.” ‘A1’ Outlook Stable “Fitch views the company as having strong financial flexibility, including a strong liquidity position with sufficient sources of contingent capital. Athene's asset/liability and liquidity management are considered strong driven by the company's well-matched assets and liabilities and strong cash flow testing results.” ‘A+’ Outlook Stable “We view Athene's capital and earnings as very strong. Capital adequacy remained above the 'AA' level per our capital model as of year-end 2021, and we expect the company will maintain at least a 'AA' capital level over the next few years… Athene's merger with Apollo has not materially changed the company's strategy or execution.” ‘A+’ Outlook Stable “The ratings reflect Athene’s balance sheet strength, which AM Best categorizes as very strong, as well as its strong operating performance, favorable business profile and appropriate enterprise risk management…” ‘A’ Outlook Stable S&P, DECEMBER 2022 FITCH, MAY 2022 A.M. BEST, APRIL 2022 MOODY’S, JULY 2022 UPGRADED FROM ‘A’ INITIAL RATING
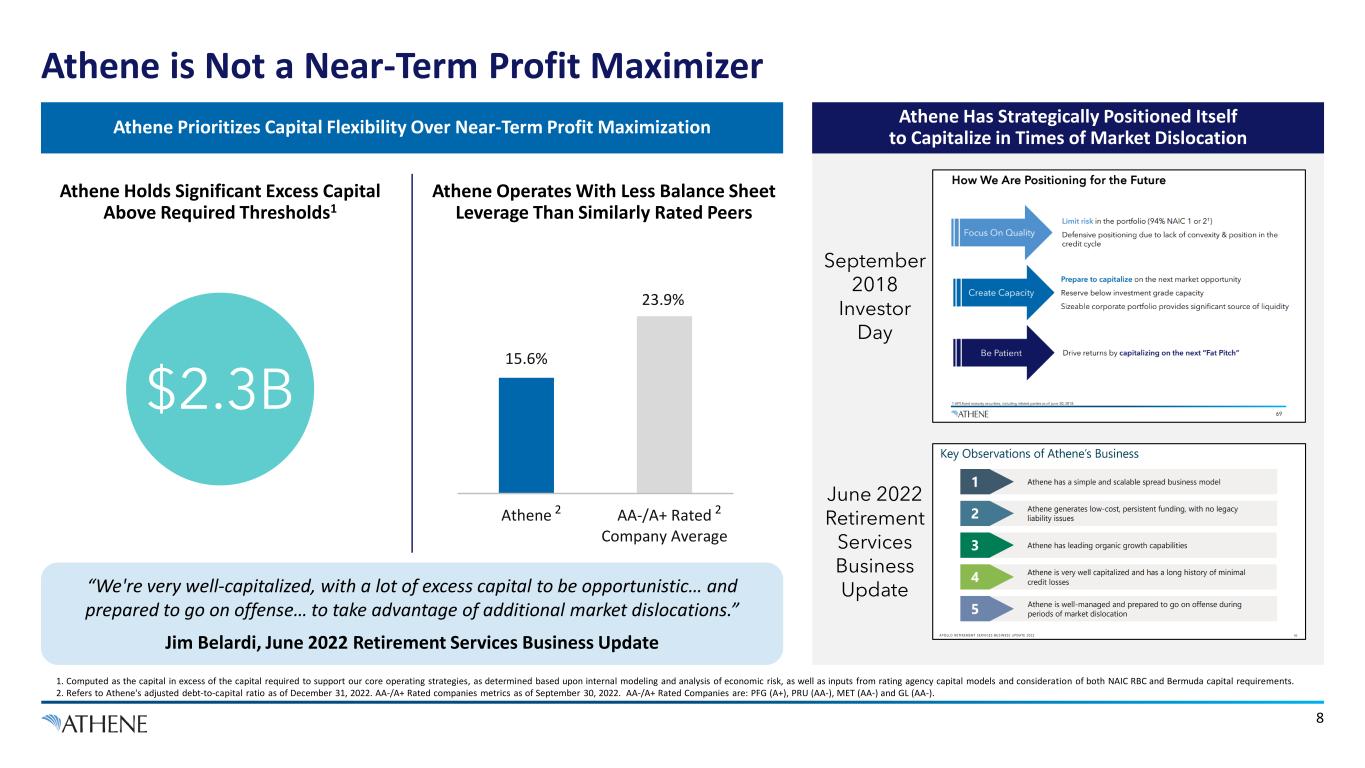
8 1. Computed as the capital in excess of the capital required to support our core operating strategies, as determined based upon internal modeling and analysis of economic risk, as well as inputs from rating agency capital models and consideration of both NAIC RBC and Bermuda capital requirements. 2. Refers to Athene's adjusted debt-to-capital ratio as of December 31, 2022. AA-/A+ Rated companies metrics as of September 30, 2022. AA-/A+ Rated Companies are: PFG (A+), PRU (AA-), MET (AA-) and GL (AA-). September 2018 Investor Day Athene Has Strategically Positioned Itself to Capitalize in Times of Market Dislocation June 2022 Retirement Services Business Update Athene Prioritizes Capital Flexibility Over Near-Term Profit Maximization 15.6% 23.9% Athene AA-/A+ Rated Company Average 22 $2.3B “We're very well-capitalized, with a lot of excess capital to be opportunistic… and prepared to go on offense… to take advantage of additional market dislocations.” Jim Belardi, June 2022 Retirement Services Business Update Athene Holds Significant Excess Capital Above Required Thresholds1 Athene Operates With Less Balance Sheet Leverage Than Similarly Rated Peers Athene is Not a Near-Term Profit Maximizer
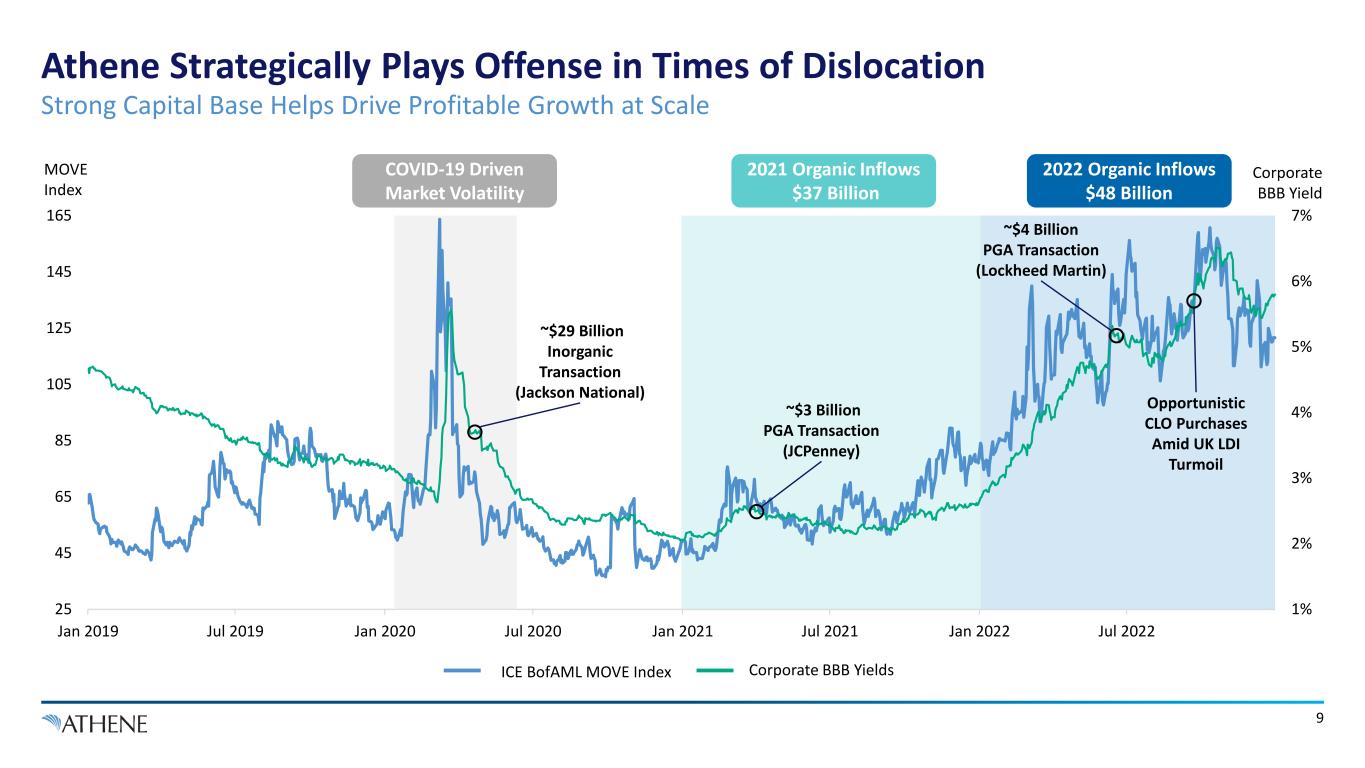
1% 2% 3% 4% 5% 6% 7% 25 45 65 85 105 125 145 165 Jan 2019 Jul 2019 Jan 2020 Jul 2020 Jan 2021 Jul 2021 Jan 2022 Jul 2022 2022 Organic Inflows $48 Billion 9 Corporate BBB Yield MOVE Index ICE BofAML MOVE Index Corporate BBB Yields COVID-19 Driven Market Volatility ~$29 Billion Inorganic Transaction (Jackson National) 2021 Organic Inflows $37 Billion Opportunistic CLO Purchases Amid UK LDI Turmoil ~$4 Billion PGA Transaction (Lockheed Martin) ~$3 Billion PGA Transaction (JCPenney) Strong Capital Base Helps Drive Profitable Growth at Scale Athene Strategically Plays Offense in Times of Dislocation
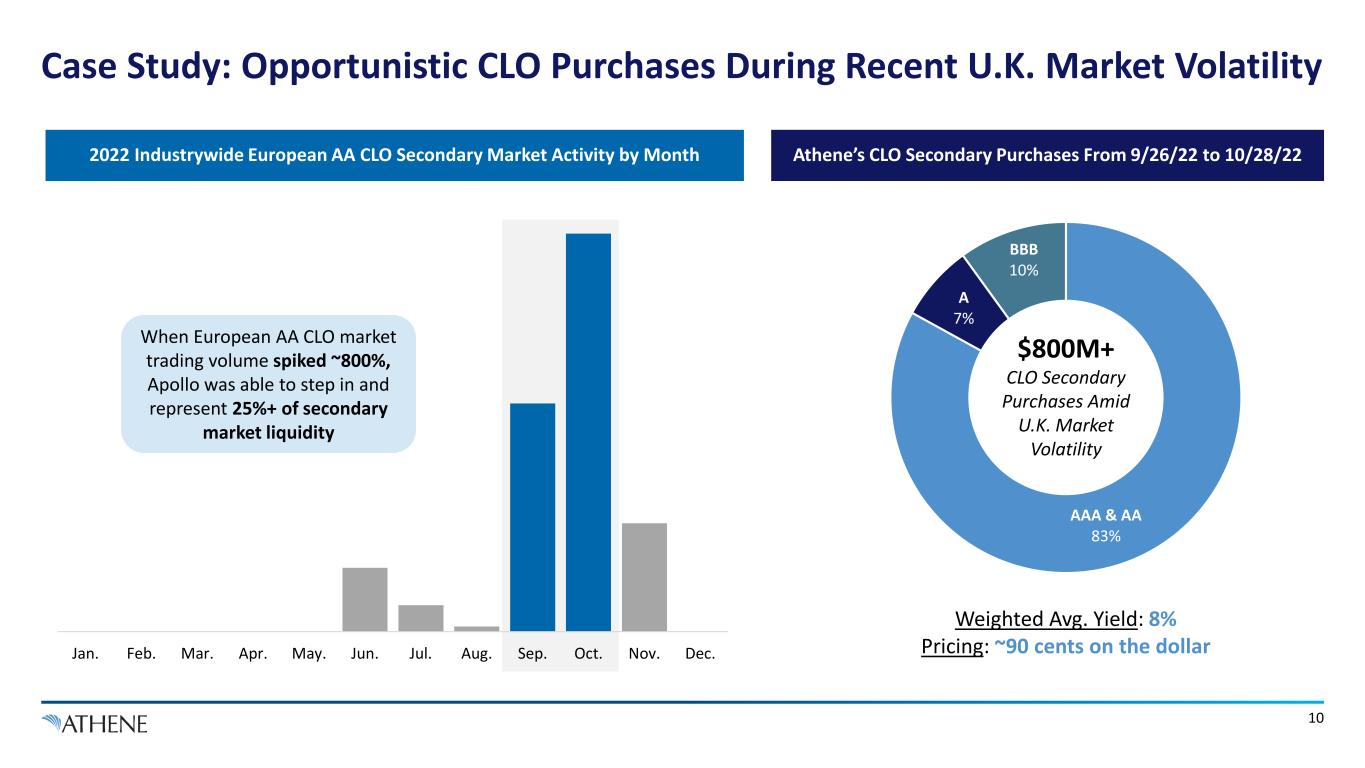
Jan. Feb. Mar. Apr. May. Jun. Jul. Aug. Sep. Oct. Nov. Dec. When European AA CLO market trading volume spiked ~800%, Apollo was able to step in and represent 25%+ of secondary market liquidity 10 2022 Industrywide European AA CLO Secondary Market Activity by Month AAA & AA 83% A 7% BBB 10% Weighted Avg. Yield: 8% Pricing: ~90 cents on the dollar $800M+ CLO Secondary Purchases Amid U.K. Market Volatility Athene’s CLO Secondary Purchases From 9/26/22 to 10/28/22 Case Study: Opportunistic CLO Purchases During Recent U.K. Market Volatility
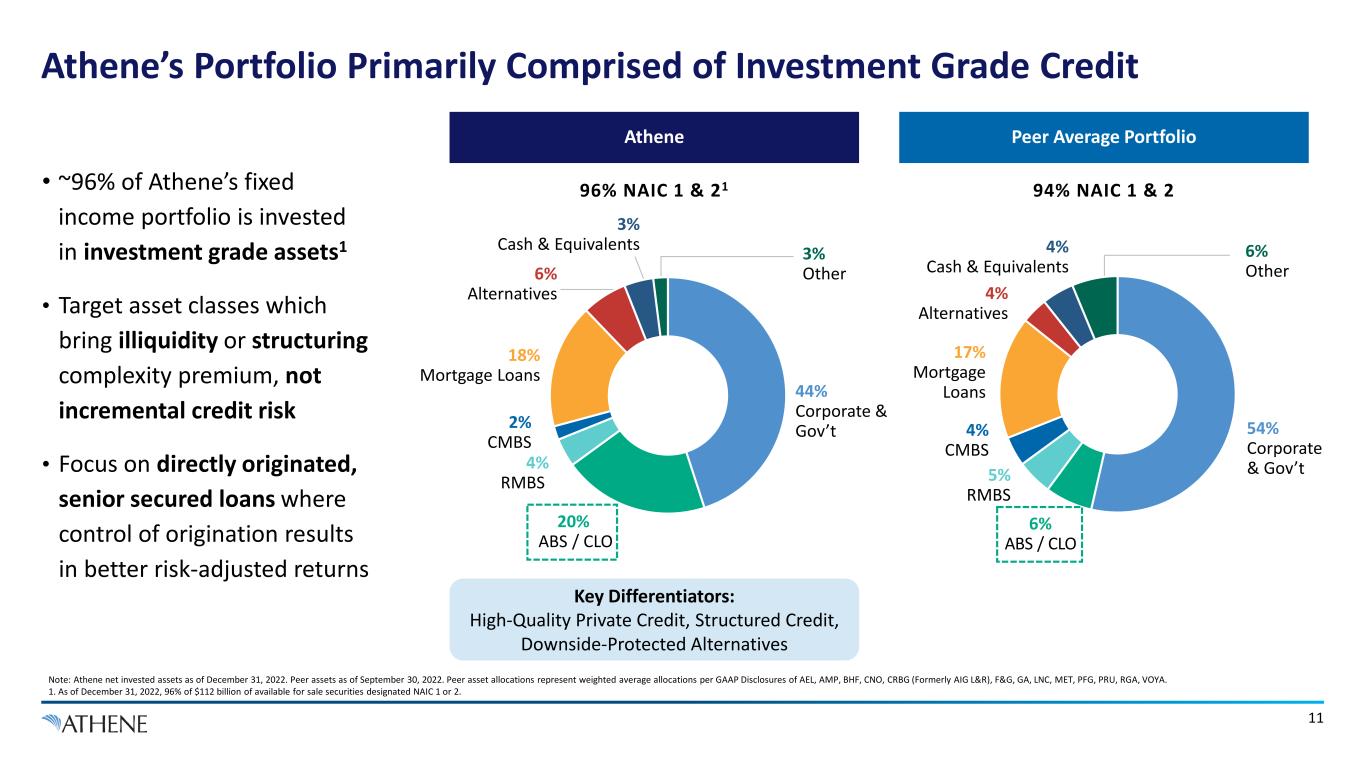
11 • ~96% of Athene’s fixed income portfolio is invested in investment grade assets1 • Target asset classes which bring illiquidity or structuring complexity premium, not incremental credit risk • Focus on directly originated, senior secured loans where control of origination results in better risk-adjusted returns 3% Other 3% Cash & Equivalents 44% Corporate & Gov’t 4% RMBS 20% ABS / CLO 2% CMBS 6% Alternatives 18% Mortgage Loans 4% Cash & Equivalents 54% Corporate & Gov’t5% RMBS 4% CMBS 17% Mortgage Loans 6% Other 6% ABS / CLO 4% Alternatives 94% NAIC 1 & 296% NAIC 1 & 21 Note: Athene net invested assets as of December 31, 2022. Peer assets as of September 30, 2022. Peer asset allocations represent weighted average allocations per GAAP Disclosures of AEL, AMP, BHF, CNO, CRBG (Formerly AIG L&R), F&G, GA, LNC, MET, PFG, PRU, RGA, VOYA. 1. As of December 31, 2022, 96% of $112 billion of available for sale securities designated NAIC 1 or 2. Athene Peer Average Portfolio Key Differentiators: High-Quality Private Credit, Structured Credit, Downside-Protected Alternatives Athene’s Portfolio Primarily Comprised of Investment Grade Credit
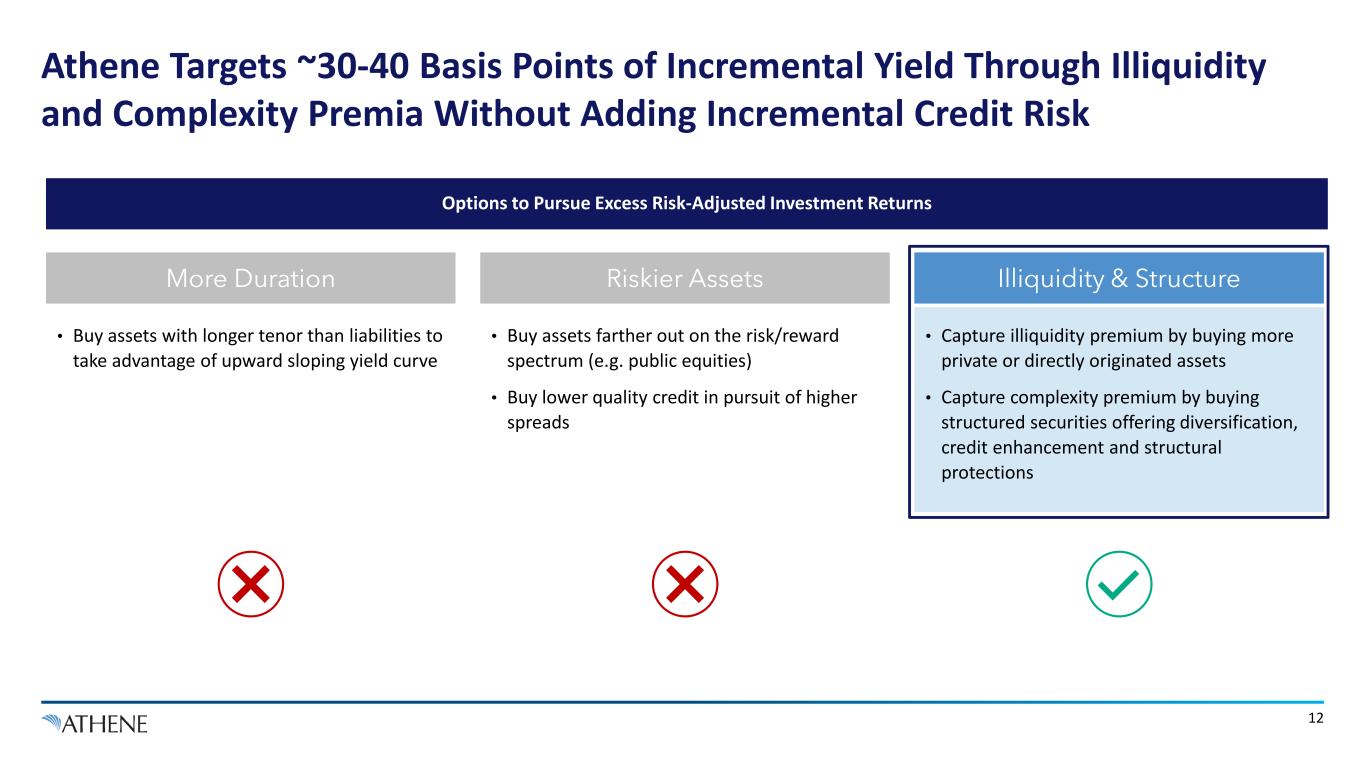
More Duration Riskier Assets Illiquidity & Structure • Buy assets with longer tenor than liabilities to take advantage of upward sloping yield curve • Buy assets farther out on the risk/reward spectrum (e.g. public equities) • Buy lower quality credit in pursuit of higher spreads • Capture illiquidity premium by buying more private or directly originated assets • Capture complexity premium by buying structured securities offering diversification, credit enhancement and structural protections Options to Pursue Excess Risk-Adjusted Investment Returns Athene Targets ~30-40 Basis Points of Incremental Yield Through Illiquidity and Complexity Premia Without Adding Incremental Credit Risk 12
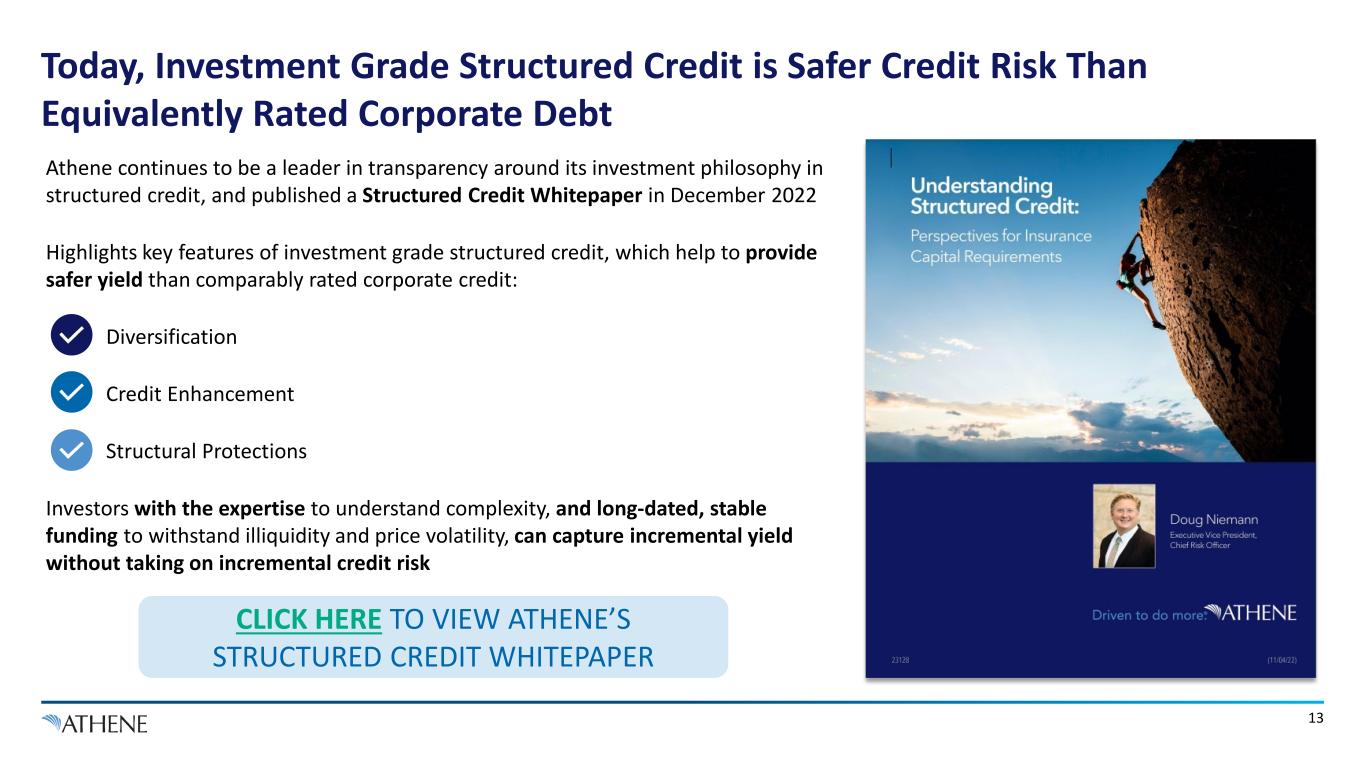
Today, Investment Grade Structured Credit is Safer Credit Risk Than Equivalently Rated Corporate Debt Athene continues to be a leader in transparency around its investment philosophy in structured credit, and published a Structured Credit Whitepaper in December 2022 Highlights key features of investment grade structured credit, which help to provide safer yield than comparably rated corporate credit: Diversification Credit Enhancement Structural Protections Investors with the expertise to understand complexity, and long-dated, stable funding to withstand illiquidity and price volatility, can capture incremental yield without taking on incremental credit risk CLICK HERE TO VIEW ATHENE’S STRUCTURED CREDIT WHITEPAPER 13
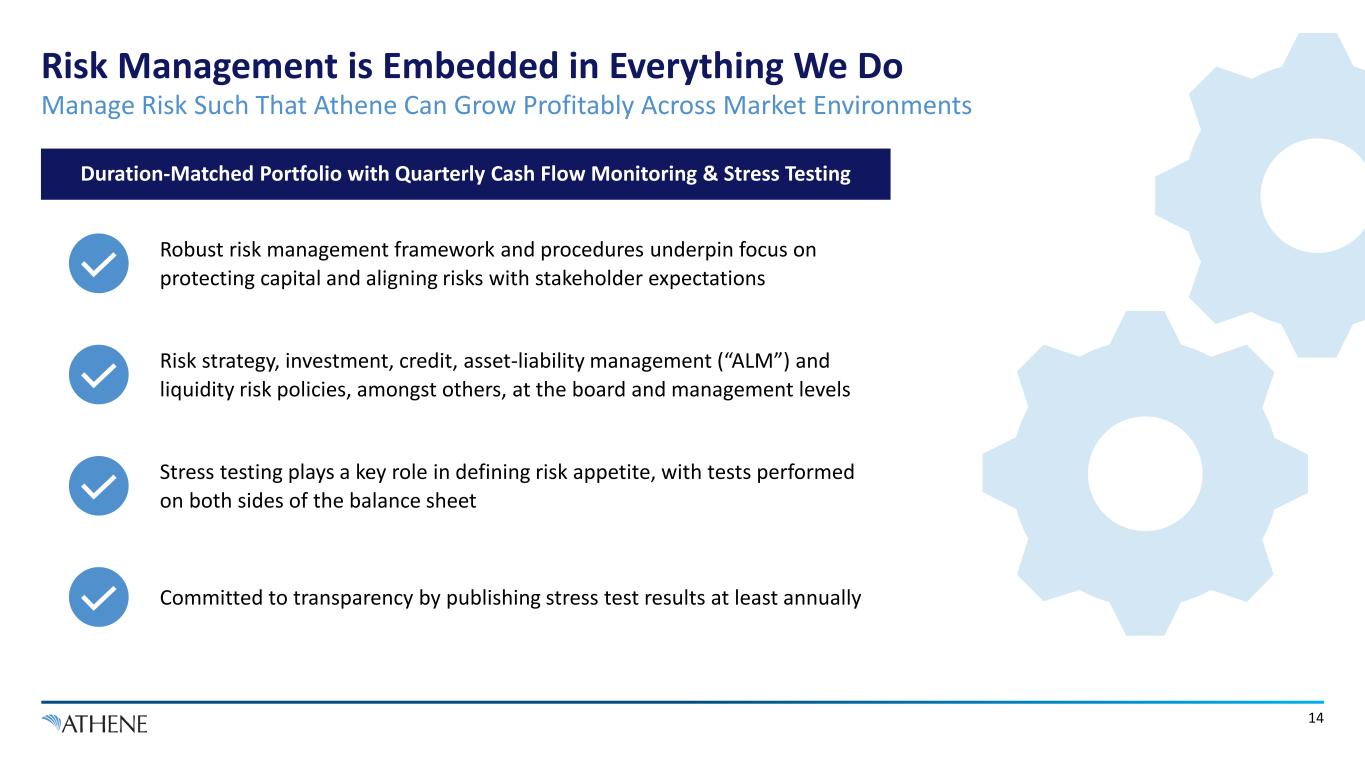
14 Risk Management is Embedded in Everything We Do Manage Risk Such That Athene Can Grow Profitably Across Market Environments Robust risk management framework and procedures underpin focus on protecting capital and aligning risks with stakeholder expectations Risk strategy, investment, credit, asset-liability management (“ALM”) and liquidity risk policies, amongst others, at the board and management levels Stress testing plays a key role in defining risk appetite, with tests performed on both sides of the balance sheet Duration-Matched Portfolio with Quarterly Cash Flow Monitoring & Stress Testing Committed to transparency by publishing stress test results at least annually
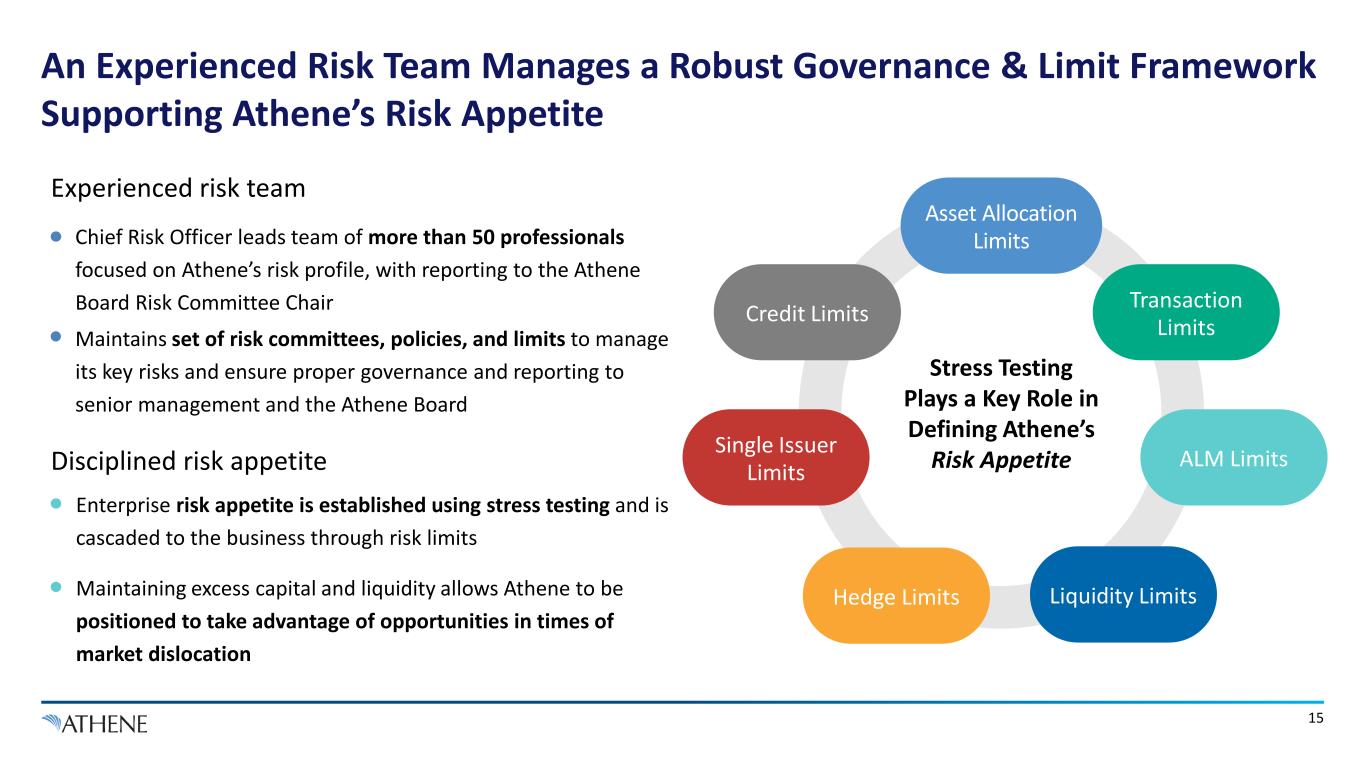
15 Disciplined risk appetite Experienced risk team Enterprise risk appetite is established using stress testing and is cascaded to the business through risk limits Maintaining excess capital and liquidity allows Athene to be positioned to take advantage of opportunities in times of market dislocation Chief Risk Officer leads team of more than 50 professionals focused on Athene’s risk profile, with reporting to the Athene Board Risk Committee Chair Maintains set of risk committees, policies, and limits to manage its key risks and ensure proper governance and reporting to senior management and the Athene Board Stress Testing Plays a Key Role in Defining Athene’s Risk Appetite ALM Limits Liquidity LimitsHedge Limits Single Issuer Limits Credit Limits Transaction Limits Asset Allocation Limits An Experienced Risk Team Manages a Robust Governance & Limit Framework Supporting Athene’s Risk Appetite
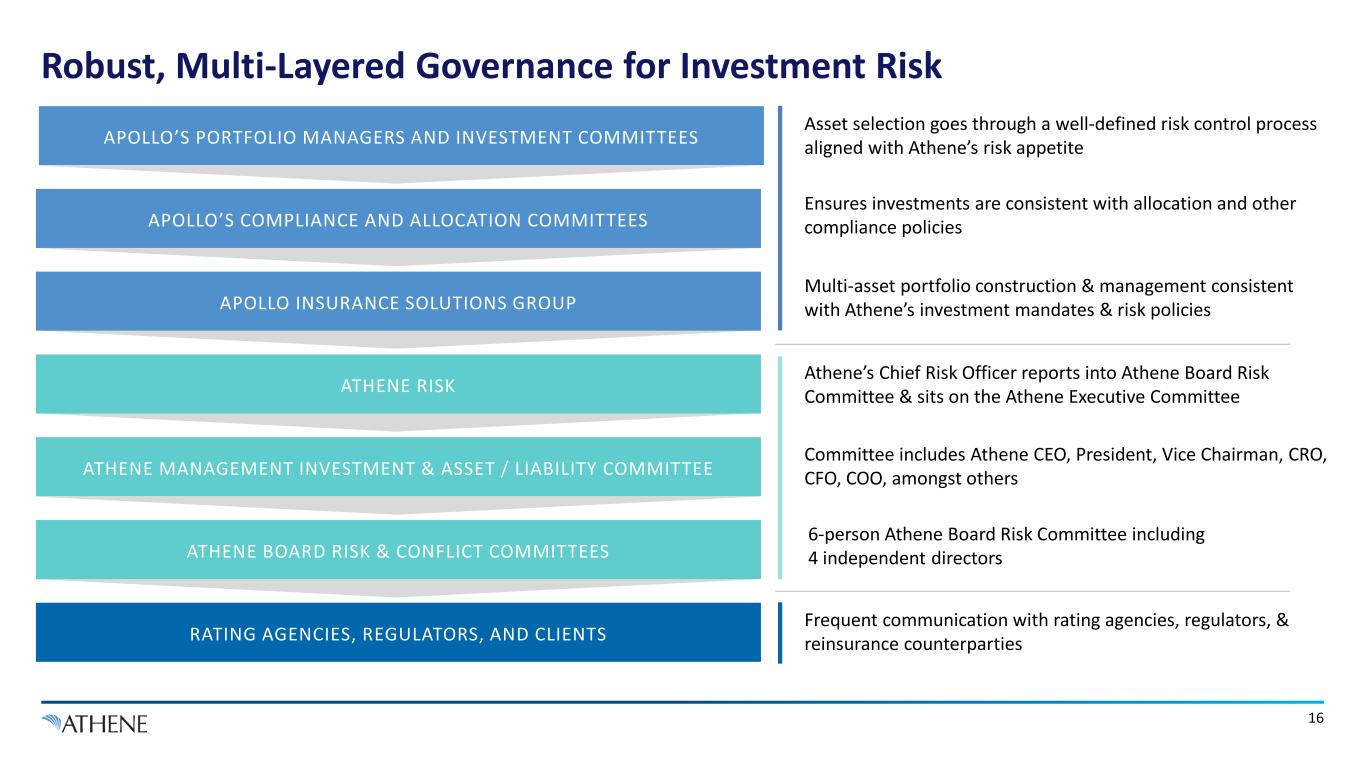
16 APOLLO’S PORTFOLIO MANAGERS AND INVESTMENT COMMITTEES APOLLO INSURANCE SOLUTIONS GROUP APOLLO’S COMPLIANCE AND ALLOCATION COMMITTEES ATHENE RISK ATHENE MANAGEMENT INVESTMENT & ASSET / LIABILITY COMMITTEE ATHENE BOARD RISK & CONFLICT COMMITTEES RATING AGENCIES, REGULATORS, AND CLIENTS Ensures investments are consistent with allocation and other compliance policies Athene’s Chief Risk Officer reports into Athene Board Risk Committee & sits on the Athene Executive Committee Frequent communication with rating agencies, regulators, & reinsurance counterparties Multi-asset portfolio construction & management consistent with Athene’s investment mandates & risk policies Committee includes Athene CEO, President, Vice Chairman, CRO, CFO, COO, amongst others 6-person Athene Board Risk Committee including 4 independent directors Robust, Multi-Layered Governance for Investment Risk Asset selection goes through a well-defined risk control process aligned with Athene’s risk appetite
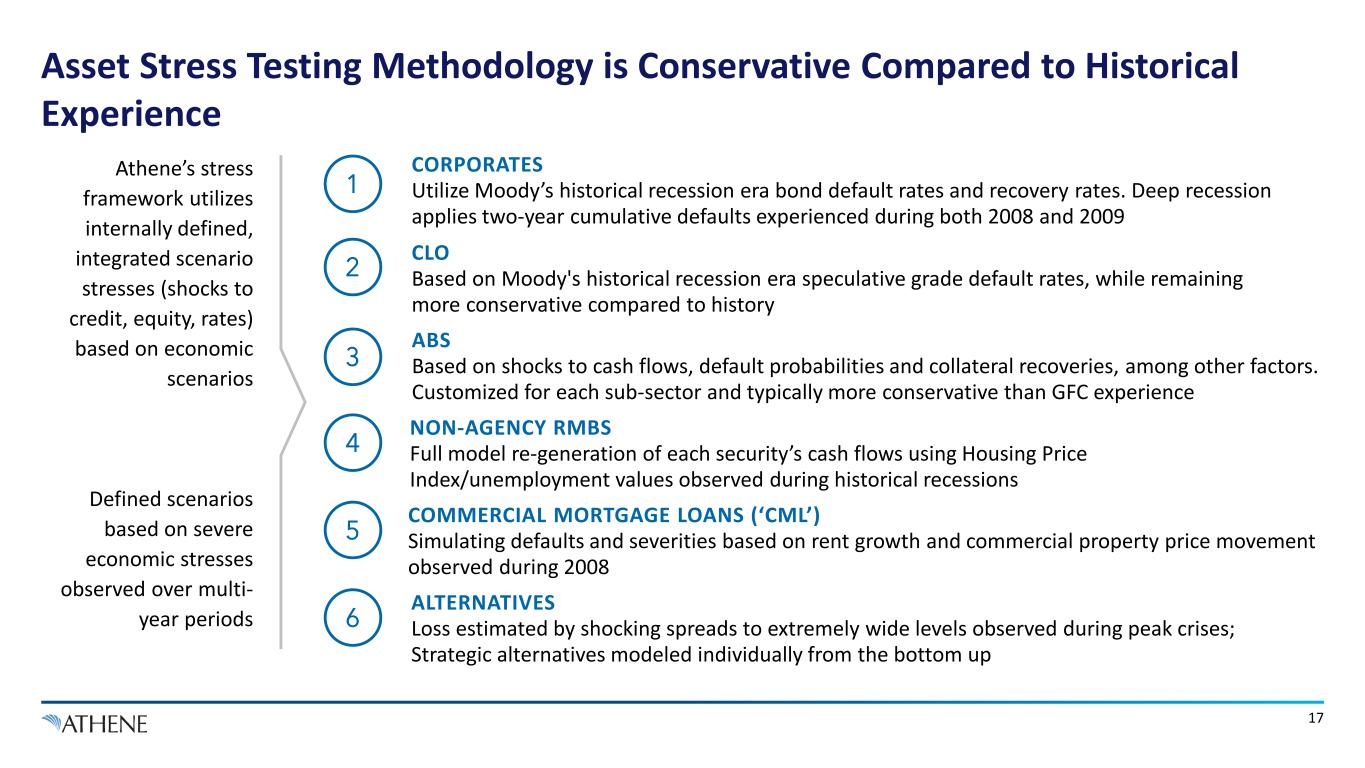
17 Athene’s stress framework utilizes internally defined, integrated scenario stresses (shocks to credit, equity, rates) based on economic scenarios Defined scenarios based on severe economic stresses observed over multi- year periods CORPORATES Utilize Moody’s historical recession era bond default rates and recovery rates. Deep recession applies two-year cumulative defaults experienced during both 2008 and 2009 1 CLO Based on Moody's historical recession era speculative grade default rates, while remaining more conservative compared to history 2 NON-AGENCY RMBS Full model re-generation of each security’s cash flows using Housing Price Index/unemployment values observed during historical recessions 4 COMMERCIAL MORTGAGE LOANS (‘CML’) Simulating defaults and severities based on rent growth and commercial property price movement observed during 2008 5 ALTERNATIVES Loss estimated by shocking spreads to extremely wide levels observed during peak crises; Strategic alternatives modeled individually from the bottom up 6 3 ABS Based on shocks to cash flows, default probabilities and collateral recoveries, among other factors. Customized for each sub-sector and typically more conservative than GFC experience Asset Stress Testing Methodology is Conservative Compared to Historical Experience
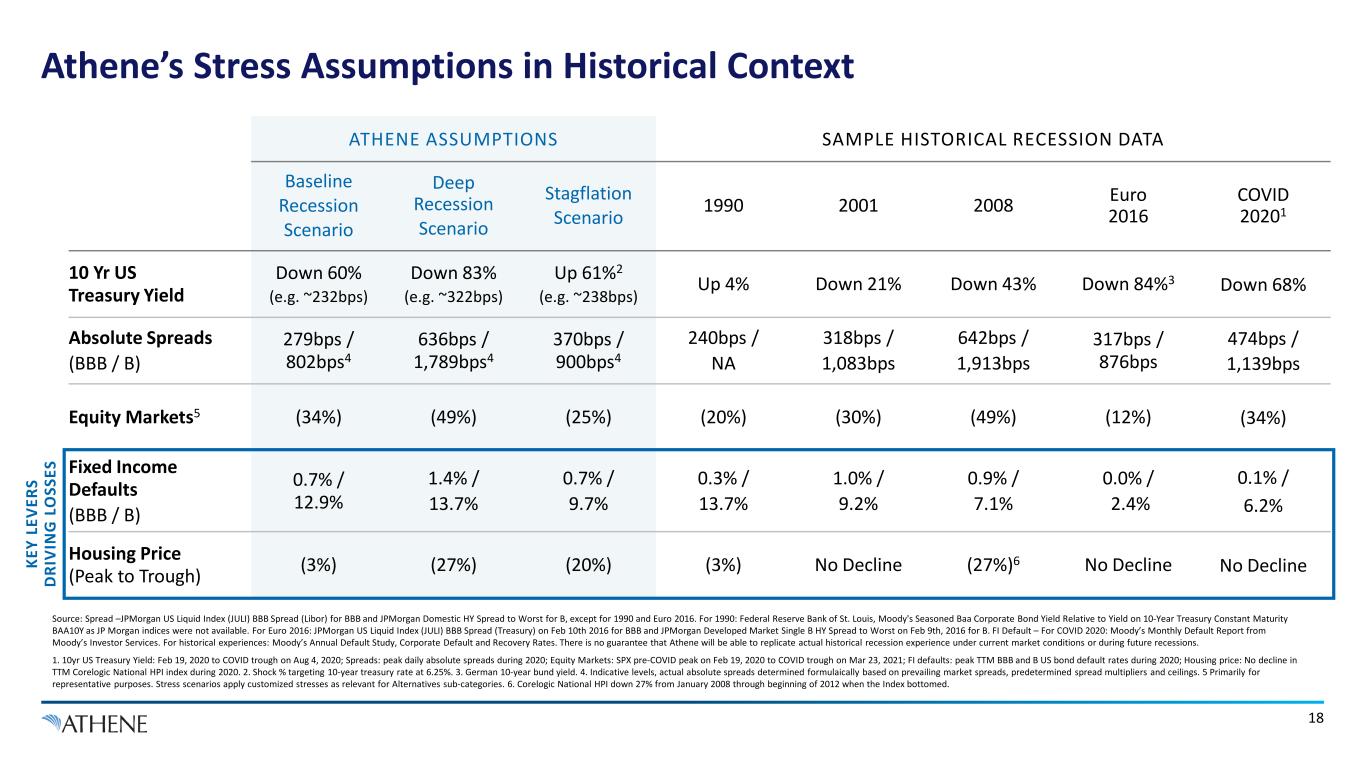
18 ATHENE ASSUMPTIONS SAMPLE HISTORICAL RECESSION DATA Baseline Recession Scenario Deep Recession Scenario Stagflation Scenario 1990 2001 2008 Euro 2016 COVID 20201 10 Yr US Treasury Yield Down 60% (e.g. ~232bps) Down 83% (e.g. ~322bps) Up 61%2 (e.g. ~238bps) Up 4% Down 21% Down 43% Down 84%3 Down 68% Absolute Spreads (BBB / B) 279bps / 802bps4 636bps / 1,789bps4 370bps / 900bps4 240bps / NA 318bps / 1,083bps 642bps / 1,913bps 317bps / 876bps 474bps / 1,139bps Equity Markets5 (34%) (49%) (25%) (20%) (30%) (49%) (12%) (34%) Fixed Income Defaults (BBB / B) 0.7% / 12.9% 1.4% / 13.7% 0.7% / 9.7% 0.3% / 13.7% 1.0% / 9.2% 0.9% / 7.1% 0.0% / 2.4% 0.1% / 6.2% Housing Price (Peak to Trough) (3%) (27%) (20%) (3%) No Decline (27%)6 No Decline No DeclineKE Y LE VE RS D RI VI N G L O SS ES Source: Spread –JPMorgan US Liquid Index (JULI) BBB Spread (Libor) for BBB and JPMorgan Domestic HY Spread to Worst for B, except for 1990 and Euro 2016. For 1990: Federal Reserve Bank of St. Louis, Moody's Seasoned Baa Corporate Bond Yield Relative to Yield on 10-Year Treasury Constant Maturity BAA10Y as JP Morgan indices were not available. For Euro 2016: JPMorgan US Liquid Index (JULI) BBB Spread (Treasury) on Feb 10th 2016 for BBB and JPMorgan Developed Market Single B HY Spread to Worst on Feb 9th, 2016 for B. FI Default – For COVID 2020: Moody’s Monthly Default Report from Moody’s Investor Services. For historical experiences: Moody’s Annual Default Study, Corporate Default and Recovery Rates. There is no guarantee that Athene will be able to replicate actual historical recession experience under current market conditions or during future recessions. 1. 10yr US Treasury Yield: Feb 19, 2020 to COVID trough on Aug 4, 2020; Spreads: peak daily absolute spreads during 2020; Equity Markets: SPX pre-COVID peak on Feb 19, 2020 to COVID trough on Mar 23, 2021; FI defaults: peak TTM BBB and B US bond default rates during 2020; Housing price: No decline in TTM Corelogic National HPI index during 2020. 2. Shock % targeting 10-year treasury rate at 6.25%. 3. German 10-year bund yield. 4. Indicative levels, actual absolute spreads determined formulaically based on prevailing market spreads, predetermined spread multipliers and ceilings. 5 Primarily for representative purposes. Stress scenarios apply customized stresses as relevant for Alternatives sub-categories. 6. Corelogic National HPI down 27% from January 2008 through beginning of 2012 when the Index bottomed. Athene’s Stress Assumptions in Historical Context
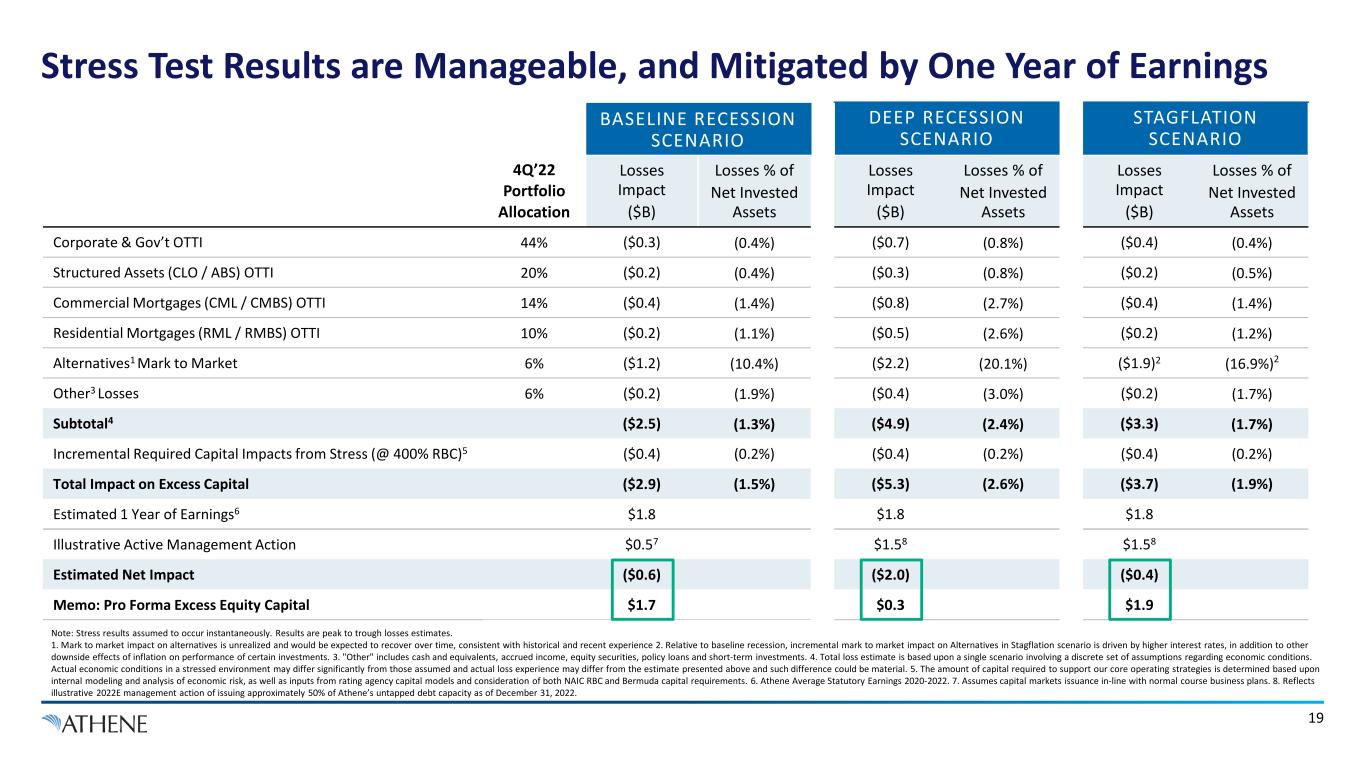
19 4Q’22 Portfolio Allocation BASELINE RECESSION SCENARIO DEEP RECESSION SCENARIO STAGFLATION SCENARIO Losses Impact ($B) Losses % of Net Invested Assets Losses Impact ($B) Losses % of Net Invested Assets Losses Impact ($B) Losses % of Net Invested Assets Corporate & Gov’t OTTI 44% ($0.3) (0.4%) ($0.7) (0.8%) ($0.4) (0.4%) Structured Assets (CLO / ABS) OTTI 20% ($0.2) (0.4%) ($0.3) (0.8%) ($0.2) (0.5%) Commercial Mortgages (CML / CMBS) OTTI 14% ($0.4) (1.4%) ($0.8) (2.7%) ($0.4) (1.4%) Residential Mortgages (RML / RMBS) OTTI 10% ($0.2) (1.1%) ($0.5) (2.6%) ($0.2) (1.2%) Alternatives1 Mark to Market 6% ($1.2) (10.4%) ($2.2) (20.1%) ($1.9)2 (16.9%)2 Other3 Losses 6% ($0.2) (1.9%) ($0.4) (3.0%) ($0.2) (1.7%) Subtotal4 ($2.5) (1.3%) ($4.9) (2.4%) ($3.3) (1.7%) Incremental Required Capital Impacts from Stress (@ 400% RBC)5 ($0.4) (0.2%) ($0.4) (0.2%) ($0.4) (0.2%) Total Impact on Excess Capital ($2.9) (1.5%) ($5.3) (2.6%) ($3.7) (1.9%) Estimated 1 Year of Earnings6 $1.8 $1.8 $1.8 Illustrative Active Management Action $0.57 $1.58 $1.58 Estimated Net Impact ($0.6) ($2.0) ($0.4) Memo: Pro Forma Excess Equity Capital $1.7 $0.3 $1.9 Note: Stress results assumed to occur instantaneously. Results are peak to trough losses estimates. 1. Mark to market impact on alternatives is unrealized and would be expected to recover over time, consistent with historical and recent experience 2. Relative to baseline recession, incremental mark to market impact on Alternatives in Stagflation scenario is driven by higher interest rates, in addition to other downside effects of inflation on performance of certain investments. 3. "Other" includes cash and equivalents, accrued income, equity securities, policy loans and short-term investments. 4. Total loss estimate is based upon a single scenario involving a discrete set of assumptions regarding economic conditions. Actual economic conditions in a stressed environment may differ significantly from those assumed and actual loss experience may differ from the estimate presented above and such difference could be material. 5. The amount of capital required to support our core operating strategies is determined based upon internal modeling and analysis of economic risk, as well as inputs from rating agency capital models and consideration of both NAIC RBC and Bermuda capital requirements. 6. Athene Average Statutory Earnings 2020-2022. 7. Assumes capital markets issuance in-line with normal course business plans. 8. Reflects illustrative 2022E management action of issuing approximately 50% of Athene’s untapped debt capacity as of December 31, 2022. Stress Test Results are Manageable, and Mitigated by One Year of Earnings
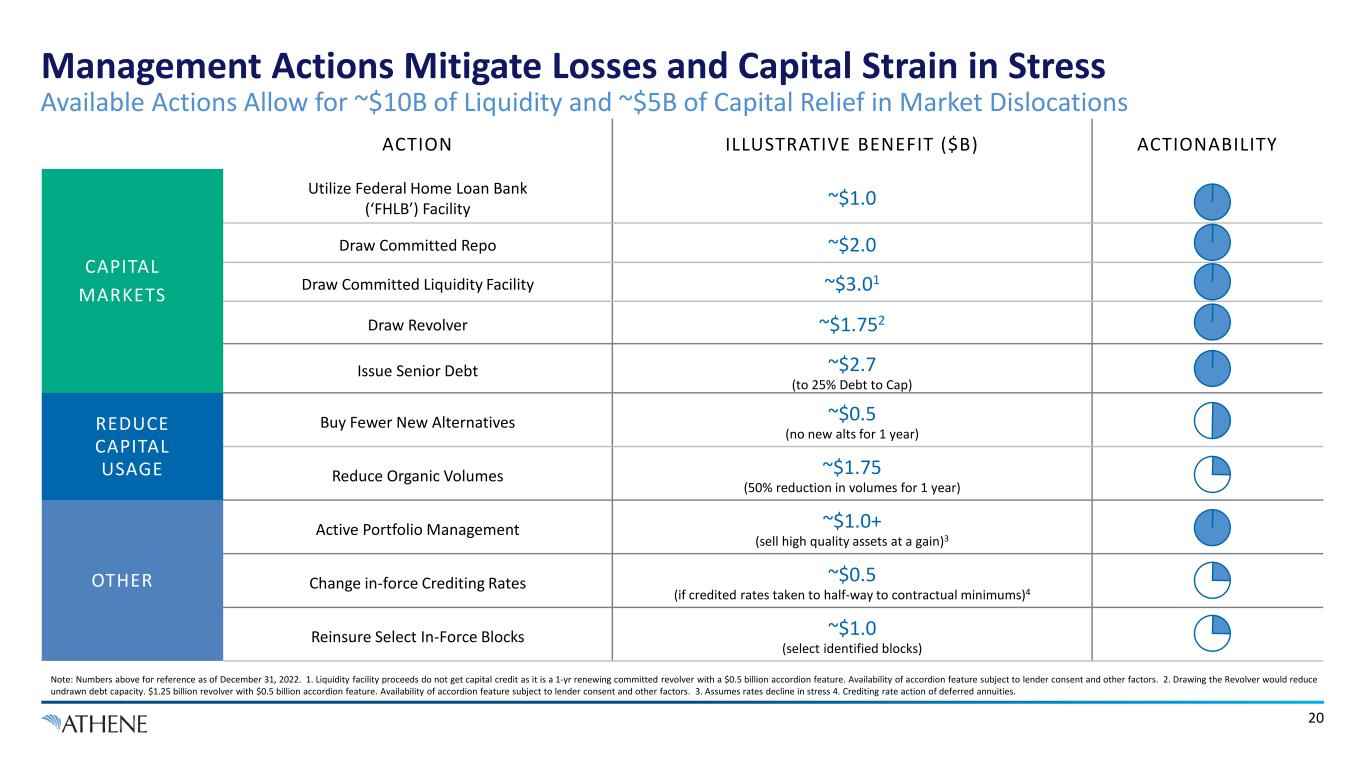
Available Actions Allow for ~$10B of Liquidity and ~$5B of Capital Relief in Market Dislocations 20 ACTION ILLUSTRATIVE BENEFIT ($B) ACTIONABILITY CAPITAL MARKETS Utilize Federal Home Loan Bank (‘FHLB’) Facility ~$1.0 Draw Committed Repo ~$2.0 Draw Committed Liquidity Facility ~$3.01 Draw Revolver ~$1.752 Issue Senior Debt ~$2.7 (to 25% Debt to Cap) REDUCE CAPITAL USAGE Buy Fewer New Alternatives ~$0.5 (no new alts for 1 year) Reduce Organic Volumes ~$1.75 (50% reduction in volumes for 1 year) OTHER Active Portfolio Management ~$1.0+ (sell high quality assets at a gain)3 Change in-force Crediting Rates ~$0.5 (if credited rates taken to half-way to contractual minimums)4 Reinsure Select In-Force Blocks ~$1.0 (select identified blocks) Note: Numbers above for reference as of December 31, 2022. 1. Liquidity facility proceeds do not get capital credit as it is a 1-yr renewing committed revolver with a $0.5 billion accordion feature. Availability of accordion feature subject to lender consent and other factors. 2. Drawing the Revolver would reduce undrawn debt capacity. $1.25 billion revolver with $0.5 billion accordion feature. Availability of accordion feature subject to lender consent and other factors. 3. Assumes rates decline in stress 4. Crediting rate action of deferred annuities. Management Actions Mitigate Losses and Capital Strain in Stress
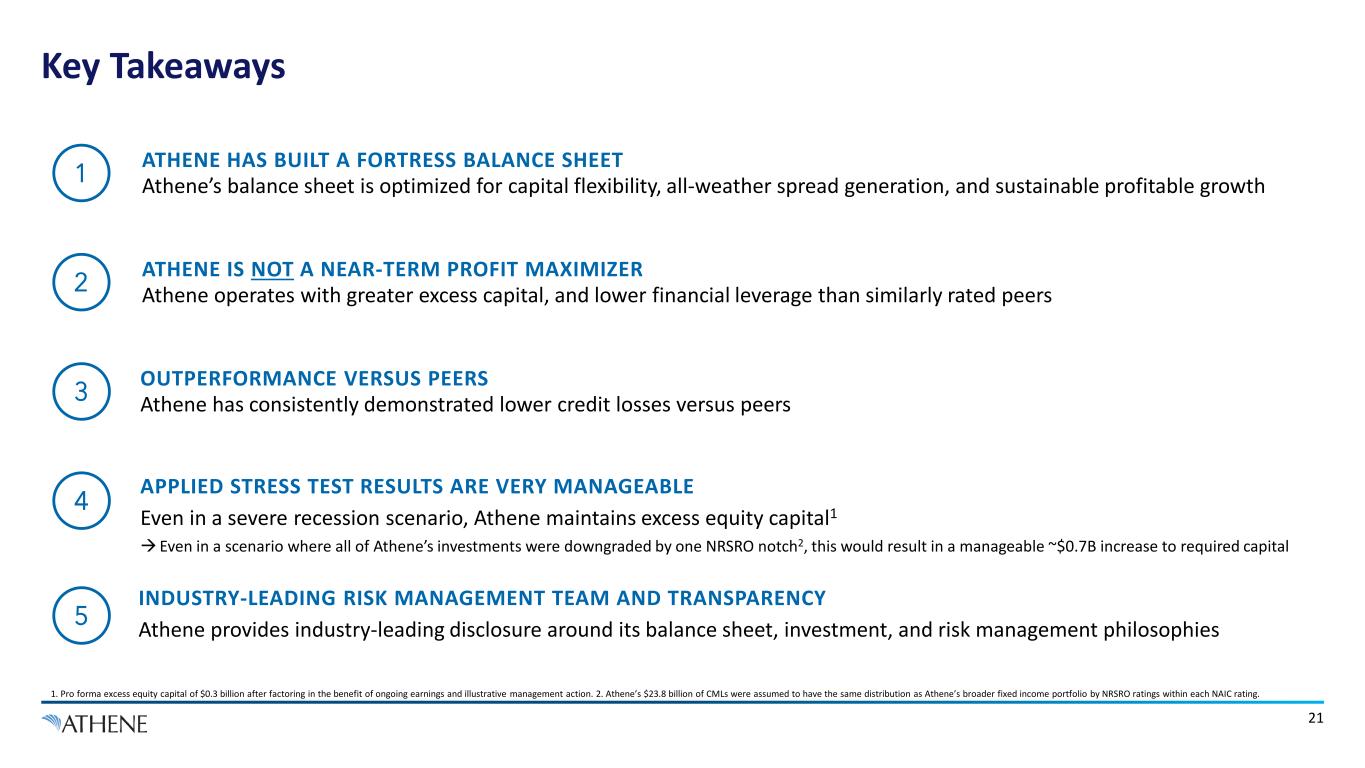
1. Pro forma excess equity capital of $0.3 billion after factoring in the benefit of ongoing earnings and illustrative management action. 2. Athene’s $23.8 billion of CMLs were assumed to have the same distribution as Athene’s broader fixed income portfolio by NRSRO ratings within each NAIC rating. OUTPERFORMANCE VERSUS PEERS Athene has consistently demonstrated lower credit losses versus peers3 ATHENE IS NOT A NEAR-TERM PROFIT MAXIMIZER Athene operates with greater excess capital, and lower financial leverage than similarly rated peers2 5 INDUSTRY-LEADING RISK MANAGEMENT TEAM AND TRANSPARENCY Athene provides industry-leading disclosure around its balance sheet, investment, and risk management philosophies APPLIED STRESS TEST RESULTS ARE VERY MANAGEABLE Even in a severe recession scenario, Athene maintains excess equity capital1 Even in a scenario where all of Athene’s investments were downgraded by one NRSRO notch2, this would result in a manageable ~$0.7B increase to required capital 4 ATHENE HAS BUILT A FORTRESS BALANCE SHEET Athene’s balance sheet is optimized for capital flexibility, all-weather spread generation, and sustainable profitable growth1 Key Takeaways 21
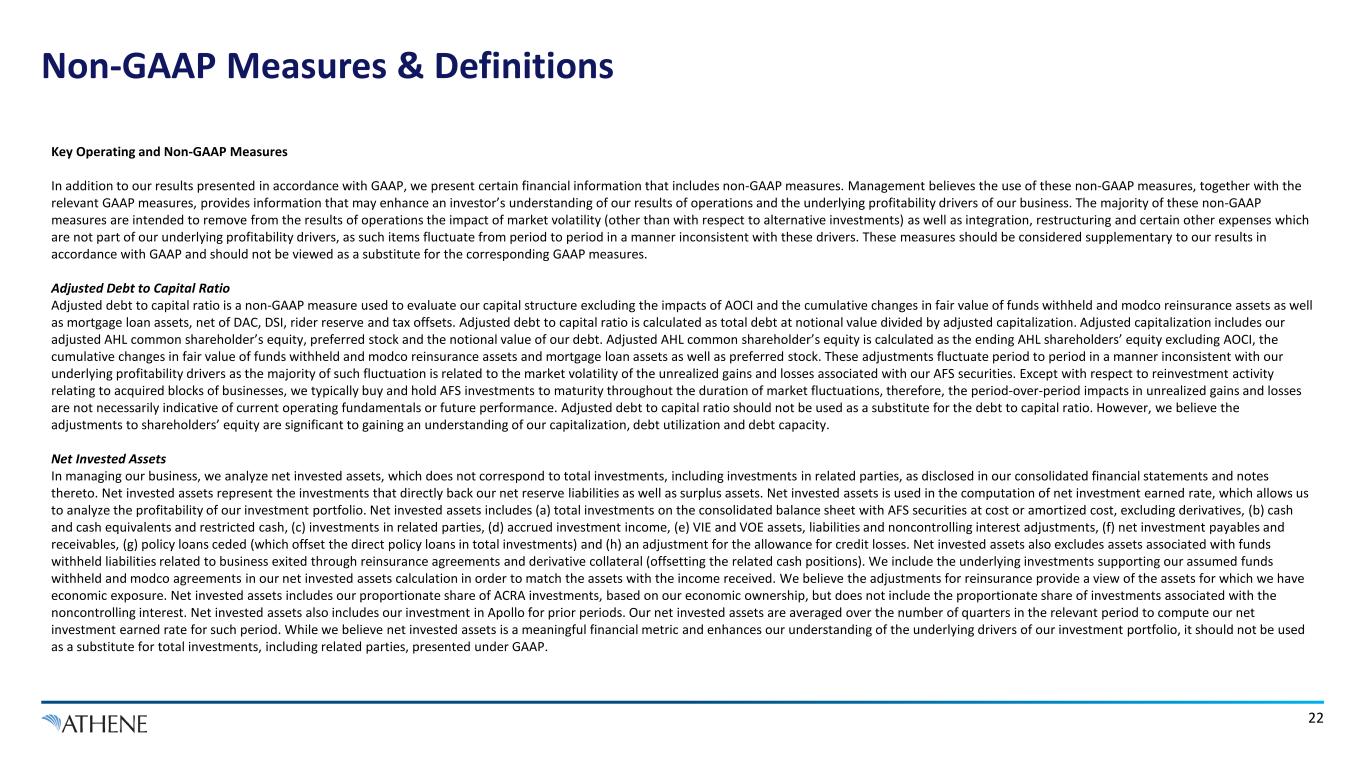
Non-GAAP Measures & Definitions Key Operating and Non-GAAP Measures In addition to our results presented in accordance with GAAP, we present certain financial information that includes non-GAAP measures. Management believes the use of these non-GAAP measures, together with the relevant GAAP measures, provides information that may enhance an investor’s understanding of our results of operations and the underlying profitability drivers of our business. The majority of these non-GAAP measures are intended to remove from the results of operations the impact of market volatility (other than with respect to alternative investments) as well as integration, restructuring and certain other expenses which are not part of our underlying profitability drivers, as such items fluctuate from period to period in a manner inconsistent with these drivers. These measures should be considered supplementary to our results in accordance with GAAP and should not be viewed as a substitute for the corresponding GAAP measures. Adjusted Debt to Capital Ratio Adjusted debt to capital ratio is a non-GAAP measure used to evaluate our capital structure excluding the impacts of AOCI and the cumulative changes in fair value of funds withheld and modco reinsurance assets as well as mortgage loan assets, net of DAC, DSI, rider reserve and tax offsets. Adjusted debt to capital ratio is calculated as total debt at notional value divided by adjusted capitalization. Adjusted capitalization includes our adjusted AHL common shareholder’s equity, preferred stock and the notional value of our debt. Adjusted AHL common shareholder’s equity is calculated as the ending AHL shareholders’ equity excluding AOCI, the cumulative changes in fair value of funds withheld and modco reinsurance assets and mortgage loan assets as well as preferred stock. These adjustments fluctuate period to period in a manner inconsistent with our underlying profitability drivers as the majority of such fluctuation is related to the market volatility of the unrealized gains and losses associated with our AFS securities. Except with respect to reinvestment activity relating to acquired blocks of businesses, we typically buy and hold AFS investments to maturity throughout the duration of market fluctuations, therefore, the period-over-period impacts in unrealized gains and losses are not necessarily indicative of current operating fundamentals or future performance. Adjusted debt to capital ratio should not be used as a substitute for the debt to capital ratio. However, we believe the adjustments to shareholders’ equity are significant to gaining an understanding of our capitalization, debt utilization and debt capacity. Net Invested Assets In managing our business, we analyze net invested assets, which does not correspond to total investments, including investments in related parties, as disclosed in our consolidated financial statements and notes thereto. Net invested assets represent the investments that directly back our net reserve liabilities as well as surplus assets. Net invested assets is used in the computation of net investment earned rate, which allows us to analyze the profitability of our investment portfolio. Net invested assets includes (a) total investments on the consolidated balance sheet with AFS securities at cost or amortized cost, excluding derivatives, (b) cash and cash equivalents and restricted cash, (c) investments in related parties, (d) accrued investment income, (e) VIE and VOE assets, liabilities and noncontrolling interest adjustments, (f) net investment payables and receivables, (g) policy loans ceded (which offset the direct policy loans in total investments) and (h) an adjustment for the allowance for credit losses. Net invested assets also excludes assets associated with funds withheld liabilities related to business exited through reinsurance agreements and derivative collateral (offsetting the related cash positions). We include the underlying investments supporting our assumed funds withheld and modco agreements in our net invested assets calculation in order to match the assets with the income received. We believe the adjustments for reinsurance provide a view of the assets for which we have economic exposure. Net invested assets includes our proportionate share of ACRA investments, based on our economic ownership, but does not include the proportionate share of investments associated with the noncontrolling interest. Net invested assets also includes our investment in Apollo for prior periods. Our net invested assets are averaged over the number of quarters in the relevant period to compute our net investment earned rate for such period. While we believe net invested assets is a meaningful financial metric and enhances our understanding of the underlying drivers of our investment portfolio, it should not be used as a substitute for total investments, including related parties, presented under GAAP. 22
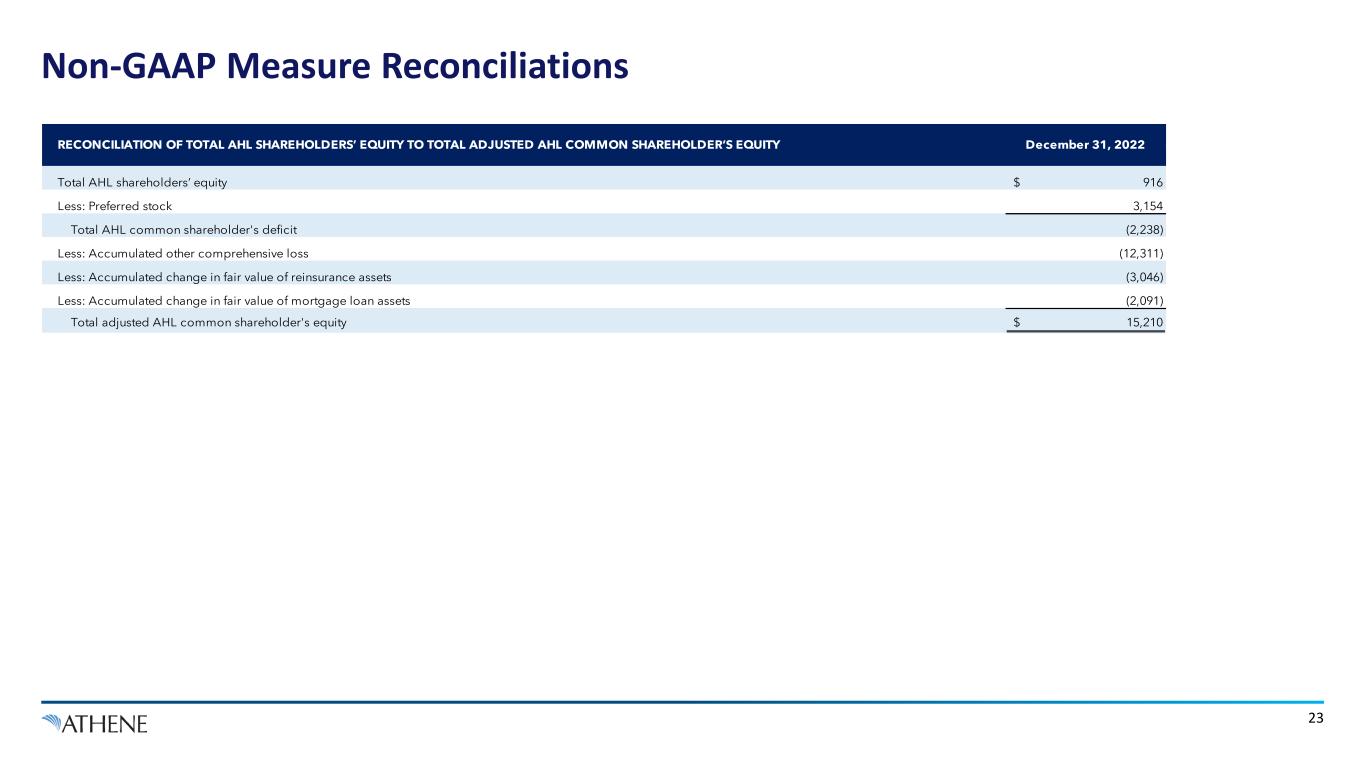
Non-GAAP Measure Reconciliations 23 Total AHL shareholders’ equity $ 916 Less: Preferred stock 3,154 Total AHL common shareholder's deficit (2,238) Less: Accumulated other comprehensive loss (12,311) Less: Accumulated change in fair value of reinsurance assets (3,046) Less: Accumulated change in fair value of mortgage loan assets (2,091) Total adjusted AHL common shareholder's equity $ 15,210 RECONCILIATION OF TOTAL AHL SHAREHOLDERS’ EQUITY TO TOTAL ADJUSTED AHL COMMON SHAREHOLDER’S EQUITY December 31, 2022
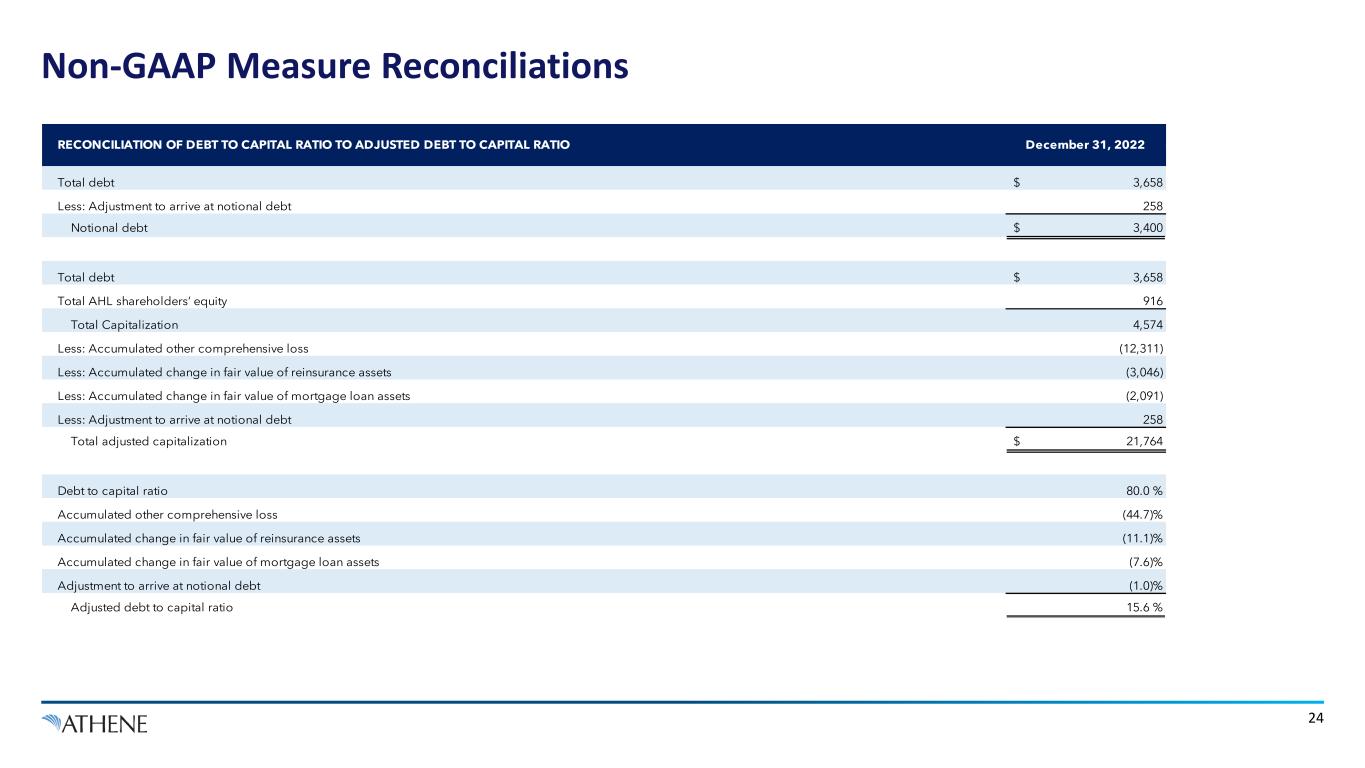
Non-GAAP Measure Reconciliations 24 Total debt $ 3,658 Less: Adjustment to arrive at notional debt 258 Notional debt $ 3,400 Total debt $ 3,658 Total AHL shareholders’ equity 916 Total Capitalization 4,574 Less: Accumulated other comprehensive loss (12,311) Less: Accumulated change in fair value of reinsurance assets (3,046) Less: Accumulated change in fair value of mortgage loan assets (2,091) Less: Adjustment to arrive at notional debt 258 Total adjusted capitalization $ 21,764 Debt to capital ratio 80.0 % Accumulated other comprehensive loss (44.7)% Accumulated change in fair value of reinsurance assets (11.1)% Accumulated change in fair value of mortgage loan assets (7.6)% Adjustment to arrive at notional debt (1.0)% Adjusted debt to capital ratio 15.6 % RECONCILIATION OF DEBT TO CAPITAL RATIO TO ADJUSTED DEBT TO CAPITAL RATIO December 31, 2022
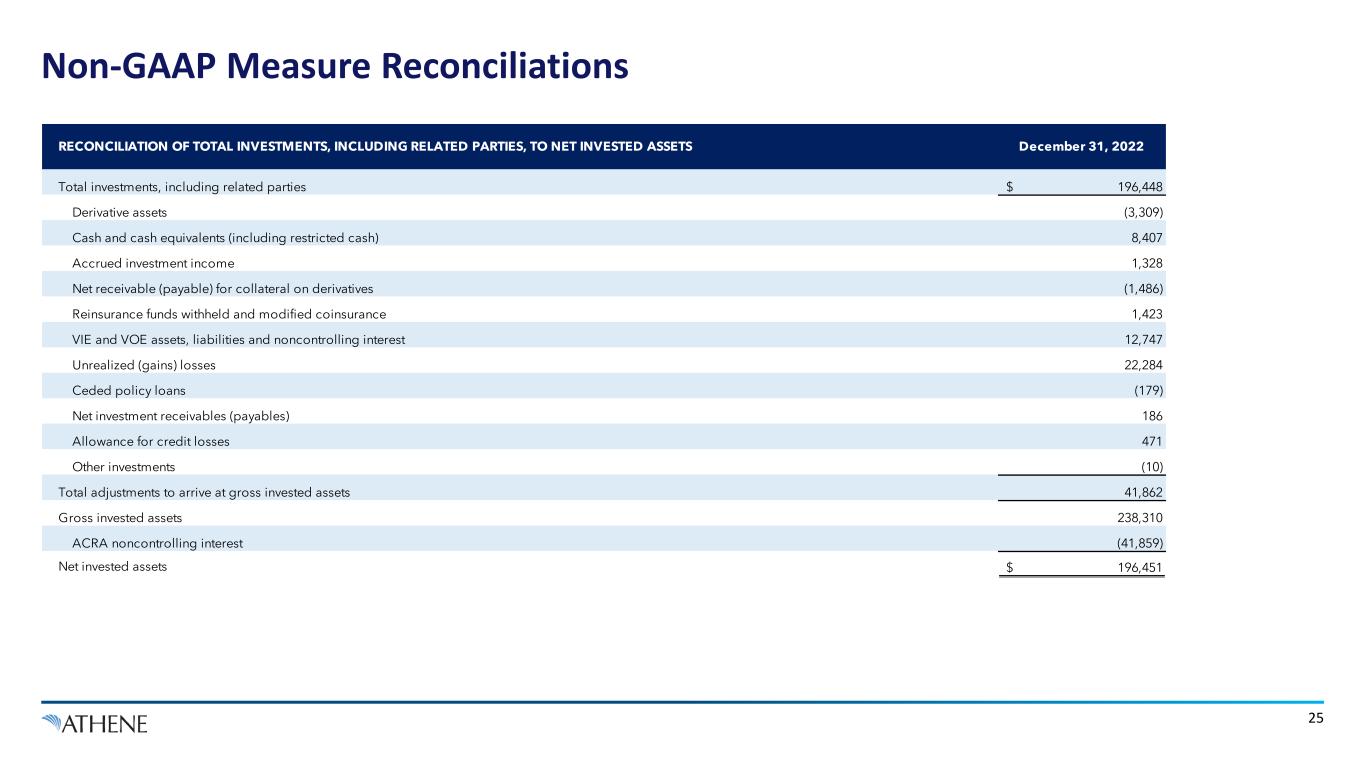
Non-GAAP Measure Reconciliations 25 Total investments, including related parties Derivative assets Cash and cash equivalents (including restricted cash) Accrued investment income Net receivable (payable) for collateral on derivatives Reinsurance funds withheld and modified coinsurance VIE and VOE assets, liabilities and noncontrolling interest Unrealized (gains) losses Ceded policy loans Net investment receivables (payables) Allowance for credit losses Other investments Total adjustments to arrive at gross invested assets Gross invested assets ACRA noncontrolling interest Net invested assets RECONCILIATION OF TOTAL INVESTMENTS, INCLUDING RELATED PARTIES, TO NET INVESTED ASSETS December 31, 2022 (1,486) 1,423 8,407 1,328 $ 196,448 (3,309) 471 41,862 (179) 186 12,747 22,284 $ 196,451 (10) 238,310 (41,859)