EX-99.1
Published on June 13, 2022

June 13, 2022 Exhibit 99.1
APOLLO RETIREMENT SERVICES BUSINESS UPDATE 2022 Forward-Looking Statements and Important Disclosures 2 This presentation has been prepared by Apollo Global Management, Inc., a Delaware corporation. (“HoldCo” and together with its subsidiaries, “Apollo,” “we,” “us,” “our” and the “Company”), solely for informational purposes for its public stockholders in connection with evaluating the business, operations and financial results of Apollo, including Athene Holding Ltd., a Bermuda exempted company (together with its subsidiaries, “Athene”). Information contained herein is as of March 31, 2022 unless otherwise noted, including information and data labeled “2022”, “Current”, “Today” and similar labeled content. This presentation is not complete and the information contained herein may change at any time without notice. Apollo Safe Harbor for Forward-Looking Statements This presentation may contain forward-looking statements that are within the meaning of Section 27A of the Securities Act of 1933, as amended (the “Securities Act”), and Section 21E of the Securities Exchange Act of 1934, as amended (the “Exchange Act”). These statements include, but are not limited to, discussions related to Apollo’s expectations regarding the performance of its business, liquidity and capital resources and the other non-historical statements. These forward-looking statements are based on management’s beliefs, as well as assumptions made by, and information currently available to, management. When used in this presentation, the words “believe,” “anticipate,” “estimate,” “expect,” “intend,” “target,” “goal,” “outlook” or future or conditional verbs, such as “will,” “should,” “could,” or “may,” and variations of such words or similar expressions are intended to identify forward-looking statements. Although management believes that the expectations reflected in these forward-looking statements are reasonable, it can give no assurance that these expectations will prove to be correct. These statements are subject to certain risks, uncertainties and assumptions, including risks relating to the impact of COVID-19, the impact of energy market dislocation, market conditions and interest rate fluctuations generally, our ability to manage our growth, our ability to operate in highly competitive environments, the performance of the funds we manage, our ability to raise new funds, the variability of our revenues, earnings and cash flow, our dependence on certain key personnel, the accuracy of management’s assumptions and estimates, our use of leverage to finance our businesses and investments by the funds we manage, Athene’s ability to maintain or improve financial strength ratings, the impact of Athene’s reinsurers failing to meet their assumed obligations, Athene’s ability to manage its business in a highly regulated industry, changes in our regulatory environment and tax status, litigation risks and our ability to recognize the benefits expected to be derived from the merger of Apollo with Athene, among others. We believe these factors include but are not limited to those described under the section entitled “Risk Factors” in the Company's Quarterly Report on Form 10-Q filed with the United States Securities and Exchange Commission (“SEC”) on May 10, 2022, as such factors may be updated from time to time in our periodic filings with the SEC, which are accessible on the SEC’s website at www.sec.gov. These factors should not be construed as exhaustive and should be read in conjunction with the other cautionary statements that are included in our filings with the SEC. We undertake no obligation to publicly update or review any forward-looking statements, whether as a result of new information, future developments or otherwise, except as required by applicable law. Athene Safe Harbor for Forward-Looking Statements This presentation contains, and certain oral statements made by Athene’s representatives from time to time may contain, forward-looking statements within the meaning of the Private Securities Litigation Reform Act of 1995, Section 27A of the Securities Act of 1933, as amended, and Section 21E of the Securities Exchange Act of 1934, as amended. Such statements are subject to risks, uncertainties and assumptions that could cause actual results, events and developments to differ materially from those set forth in, or implied by, such statements. These statements are based on the beliefs and assumptions of Athene’s management and the management of Athene’s subsidiaries. Generally, forward-looking statements include actions, events, results, strategies and expectations and are often identifiable by use of the words “believes,” “expects,” “intends,” “anticipates,” “plans,” “seeks,” “estimates,” “projects,” “may,” “will,” “could,” “might,” or “continues” or similar expressions. Forward looking statements within this presentation include, but are not limited to, benefits to be derived from Athene's capital allocation decisions; the anticipated performance of Athene's portfolio in certain recessionary environments; the performance of Athene's business; the magnitude of potential future growth in invested assets; general economic conditions; the failure to realize economic benefits from the merger with Apollo; expected future operating results; Athene's liquidity and capital resources; and other non-historical statements. Although the Athene management believes that the expectations reflected in these forward-looking statements are reasonable, it can give no assurance that these expectations will prove to be correct. For a discussion of other risks and uncertainties related to Athene's forward-looking statements, see its annual report on Form 10-K for the year ended December 31, 2021 and quarterly report on Form 10-Q filed for the period ended March 31, 2022, which can be found at the SEC’s website at www.sec.gov. All forward-looking statements described herein are qualified by these cautionary statements and there can be no assurance that the actual results, events or developments referenced herein will occur or be realized. Athene does not undertake any obligation to update or revise forward-looking statements to reflect changed assumptions, the occurrence of unanticipated events or changes to future operating results. The contents of any website referenced in this presentation are not incorporated by reference. This presentation contains information regarding Apollo's and Athene’s financial results that is calculated and presented on the basis of methodologies other than in accordance with accounting principles generally accepted in the United States ("non-GAAP measures"). Refer to slides at the end of this presentation for the definitions of Adjusted Segment Income (“ASI”), Adjusted Net Income (“ANI”), Fee Related Earnings (“FRE”), Spread Related Earnings (“SRE”), Principal Investing Income (“PII”), and other non- GAAP measures presented herein, and reconciliations of GAAP financial measures to the applicable non-GAAP measures. This presentation is for informational purposes only and not intended to and does not constitute an offer to subscribe for, buy or sell, the solicitation of an offer to subscribe for, buy or sell or an invitation to subscribe for, buy or sell any securities, products or services, including interests in the funds, vehicles or accounts sponsored or managed by Apollo (each, an “Apollo Fund”), any capital markets services offered by Apollo, or any security of Athene, nor shall there be any sale, issuance or transfer of securities in any jurisdiction in contravention of applicable law.
APOLLO RETIREMENT SERVICES BUSINESS UPDATE 2022 Forward-Looking Statements and Important Disclosures 3 Apollo makes no representation or warranty, express or implied, as to the fairness, accuracy, reasonableness or completeness of the information contained herein, including, but not limited to, information obtained from third parties. Unless otherwise specified, information included herein is sourced from and reflects the views and opinions of Apollo Analysts. Certain information contained in these materials has been obtained from sources other than Apollo. While such information is believed to be reliable for purposes used herein, no representations are made as to the accuracy or completeness thereof and Apollo does not take any responsibility for such information. This presentation may contain trade names, trademarks and service marks of companies which (i) neither Apollo nor Apollo Funds own or (ii) are investments of Apollo or one or more Apollo Funds. We do not intend our use or display of these companies’ trade names, trademarks or service marks to imply a relationship with, or endorsement or sponsorship of us by, such companies. Certain information contained in the presentation discusses general market activity, industry or sector trends, or other broad-based economic, market or political conditions and should not be construed as research or investment advice. This presentation is not complete and the information contained herein may change at any time without notice. Apollo does not have any responsibility to update the presentation to account for such changes. The information contained herein is not intended to provide, and should not be relied upon for, accounting, legal or tax advice or investment recommendations. Past performance is not necessarily indicative of future results and there can be no assurance that Apollo, Athene or any Apollo Fund or strategy will achieve comparable results, or that any investments made by Apollo in the future will be profitable. Actual realized value of currently unrealized investments will depend on, among other factors, future operating results, the value of the assets and market conditions at the time of disposition, any related transaction costs and the timing and manner of sale, all of which may differ from the assumptions and circumstances on which the current unrealized valuations are based. Accordingly, the actual realized values of unrealized investments may differ materially from the values indicated herein. Information contained herein may include information with respect to prior investment performance of one or more Apollo funds or investments, including gross and/or net internal rates of return (“IRR”). Information with respect to prior performance, while a useful tool in evaluating investment activities, is not necessarily indicative of actual results that may be achieved for unrealized investments. The realization of such performance is dependent upon many factors, many of which are beyond the control of Apollo. Aggregated return information is not reflective of an investable product, and as such does not reflect the returns of any Apollo Fund. Please refer to the slides at the end of this presentation for additional important information.
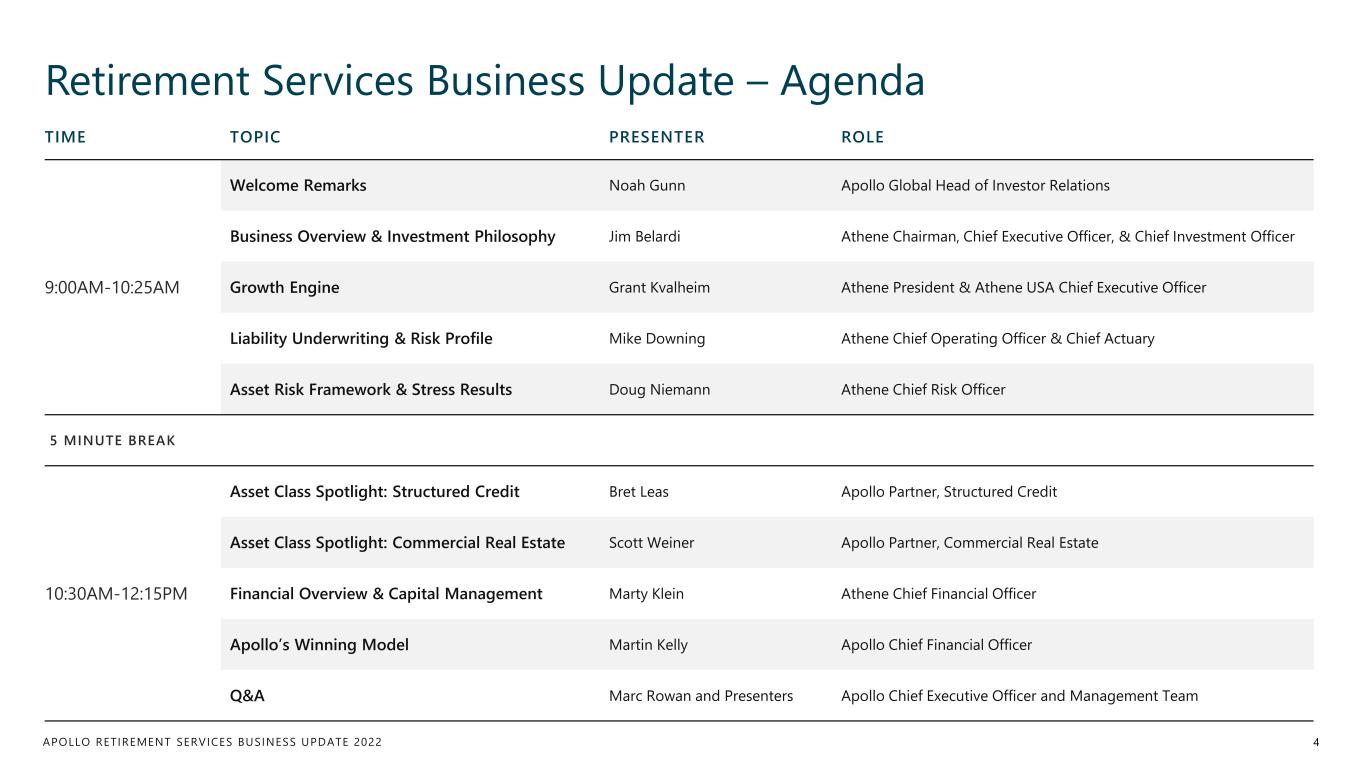
APOLLO RETIREMENT SERVICES BUSINESS UPDATE 2022 TIME TOPIC PRESENTER ROLE 9:00AM-10:25AM Welcome Remarks Noah Gunn Apollo Global Head of Investor Relations Business Overview & Investment Philosophy Jim Belardi Athene Chairman, Chief Executive Officer, & Chief Investment Officer Growth Engine Grant Kvalheim Athene President & Athene USA Chief Executive Officer Liability Underwriting & Risk Profile Mike Downing Athene Chief Operating Officer & Chief Actuary Asset Risk Framework & Stress Results Doug Niemann Athene Chief Risk Officer 5 MINUTE BREAK 10:30AM-12:15PM Asset Class Spotlight: Structured Credit Bret Leas Apollo Partner, Structured Credit Asset Class Spotlight: Commercial Real Estate Scott Weiner Apollo Partner, Commercial Real Estate Financial Overview & Capital Management Marty Klein Athene Chief Financial Officer Apollo’s Winning Model Martin Kelly Apollo Chief Financial Officer Q&A Marc Rowan and Presenters Apollo Chief Executive Officer and Management Team Retirement Services Business Update – Agenda 4

Welcome Remarks NOAH GUNN Global Head of Investor Relations, Apollo
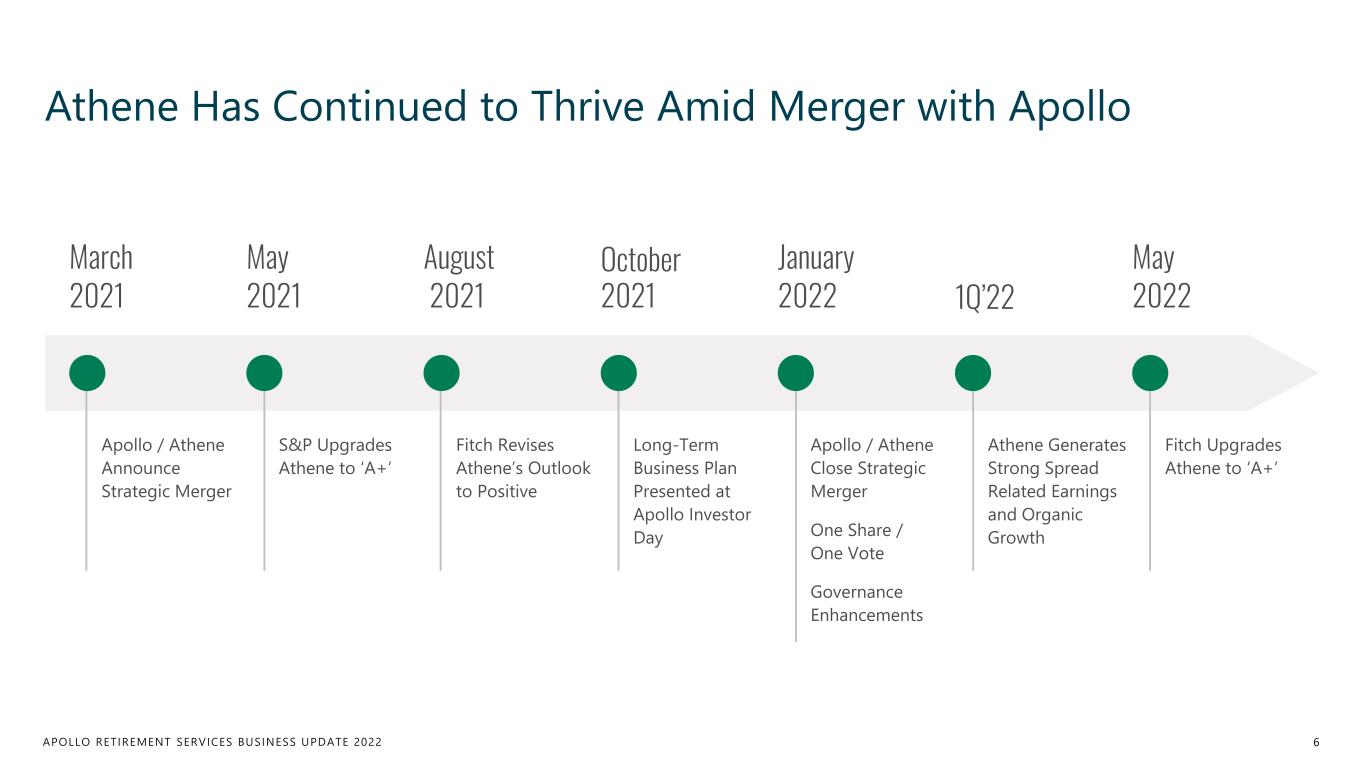
APOLLO RETIREMENT SERVICES BUSINESS UPDATE 2022 Athene Has Continued to Thrive Amid Merger with Apollo 6 March 2021 October 2021 January 2022 1Q’22 Apollo / Athene Announce Strategic Merger Long-Term Business Plan Presented at Apollo Investor Day Apollo / Athene Close Strategic Merger Athene Generates Strong Spread Related Earnings and Organic GrowthOne Share / One Vote May 2022 Fitch Upgrades Athene to ‘A+’ May 2021 S&P Upgrades Athene to ‘A+’ Governance Enhancements August 2021 Fitch Revises Athene’s Outlook to Positive
APOLLO RETIREMENT SERVICES BUSINESS UPDATE 2022 Merger Benefits Are Even Clearer and More Tangible 7 Full Alignment Drives Shareholder Value Creation Growth Accelerant Owning Asset Origination Better Client Proposition New Product Opportunities Increased Internal Collaboration Enhanced Capital Efficiency & Flexibility
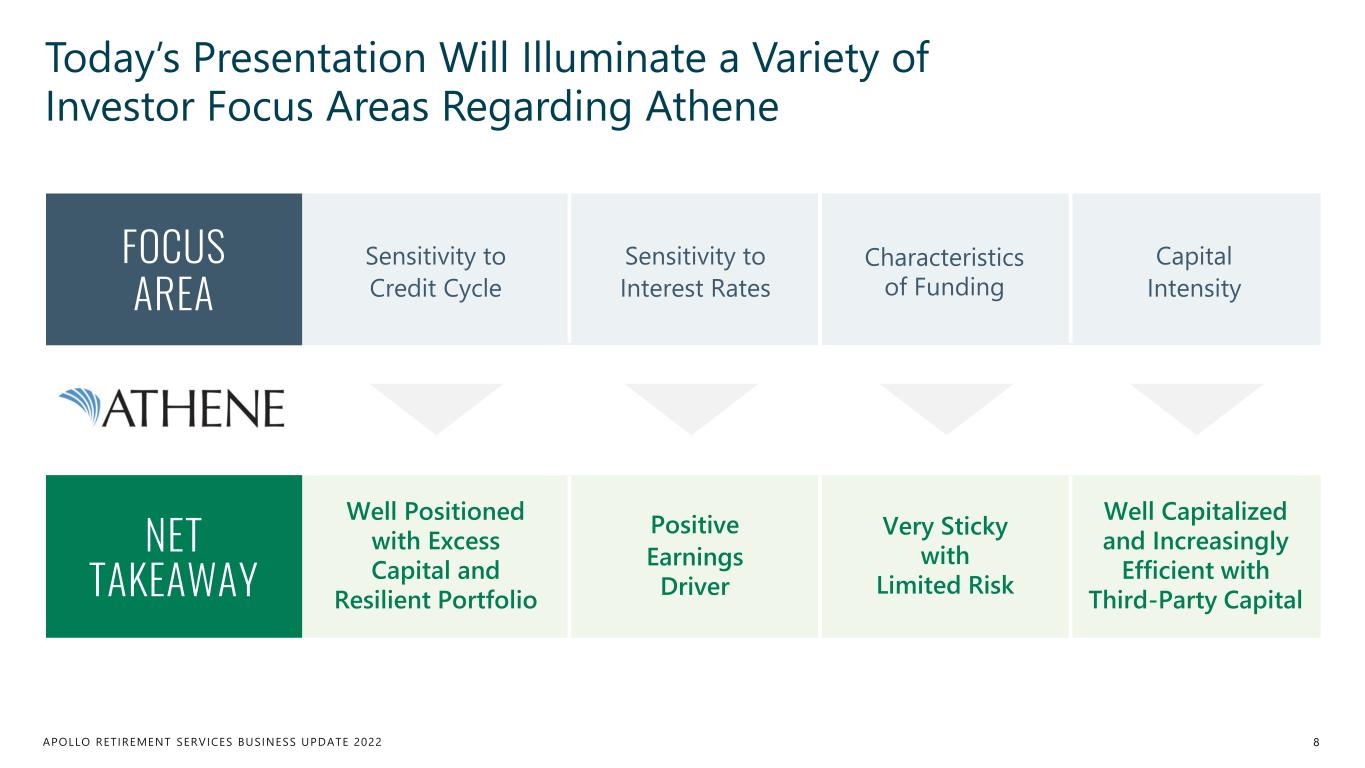
APOLLO RETIREMENT SERVICES BUSINESS UPDATE 2022 Today’s Presentation Will Illuminate a Variety of Investor Focus Areas Regarding Athene 8 FOCUS AREA Sensitivity to Credit Cycle Sensitivity to Interest Rates Characteristics of Funding Capital Intensity NET TAKEAWAY Well Positioned with Excess Capital and Resilient Portfolio Positive Earnings Driver Very Sticky with Limited Risk Well Capitalized and Increasingly Efficient with Third-Party Capital

Business Overview & Investment Philosophy JIM BELARDI Chairman, Chief Executive Officer, & Chief Investment Officer, Athene
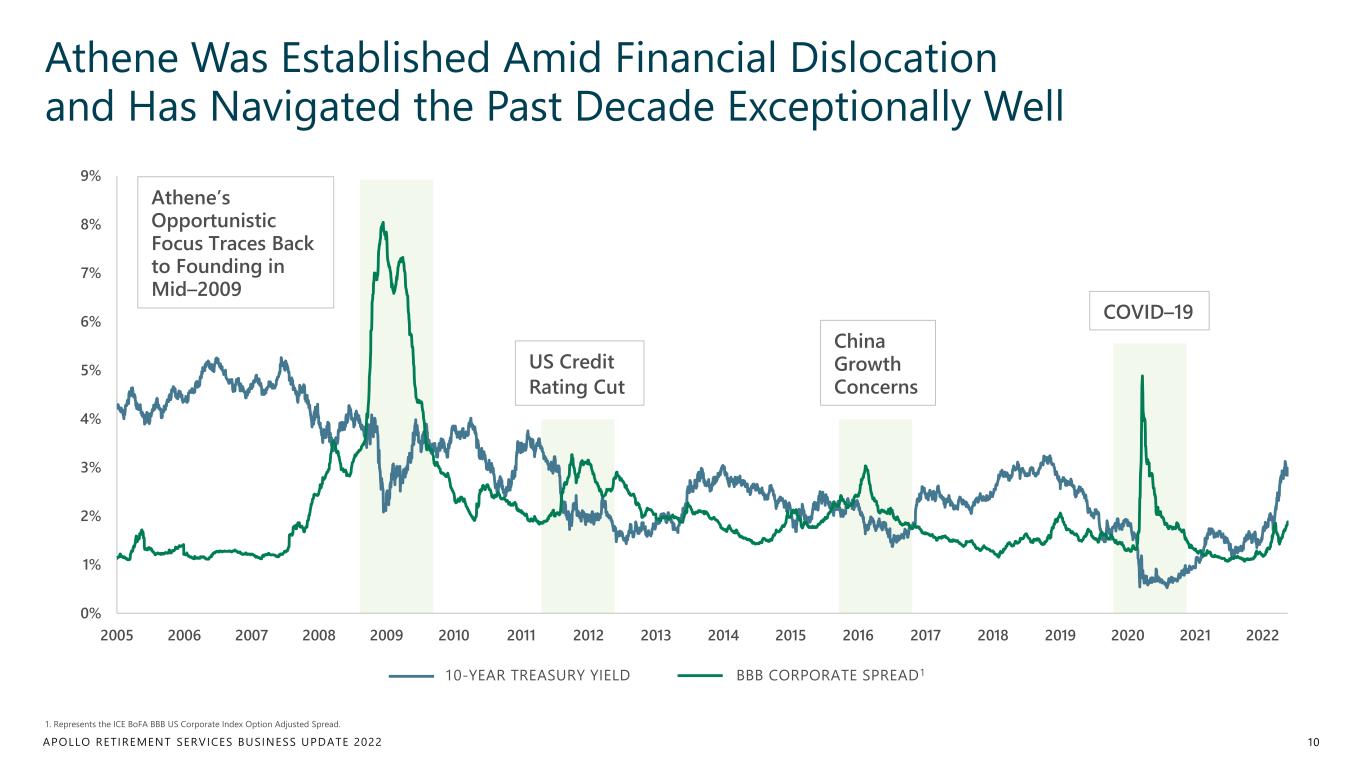
APOLLO RETIREMENT SERVICES BUSINESS UPDATE 2022 0% 1% 2% 3% 4% 5% 6% 7% 8% 9% 2005 2006 2007 2008 2009 2010 2011 2012 2013 2014 2015 2016 2017 2018 2019 2020 2021 2022 Athene Was Established Amid Financial Dislocation and Has Navigated the Past Decade Exceptionally Well 10 Athene’s Opportunistic Focus Traces Back to Founding in Mid–2009 COVID–19 China Growth Concerns US Credit Rating Cut 10-YEAR TREASURY YIELD BBB CORPORATE SPREAD1 1. Represents the ICE BoFA BBB US Corporate Index Option Adjusted Spread.
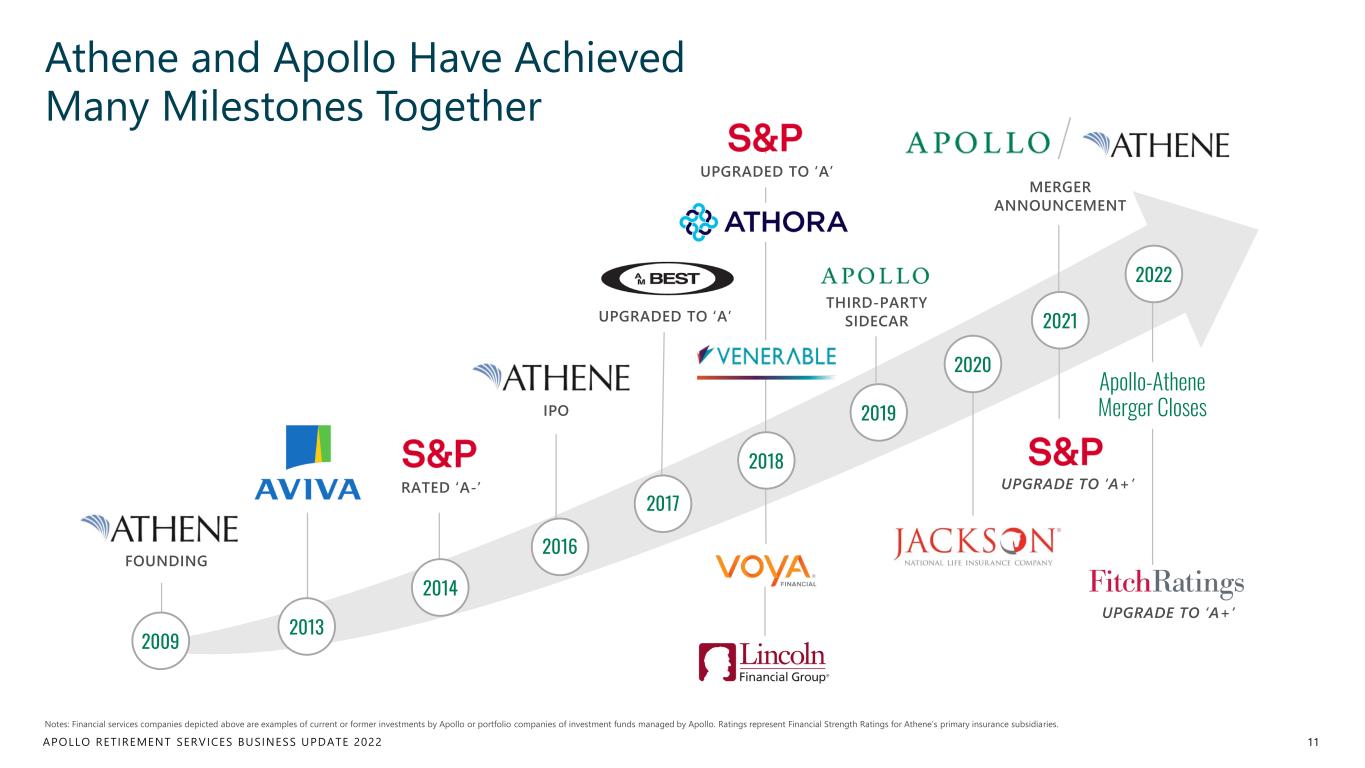
APOLLO RETIREMENT SERVICES BUSINESS UPDATE 2022 Athene and Apollo Have Achieved Many Milestones Together 11 Notes: Financial services companies depicted above are examples of current or former investments by Apollo or portfolio companies of investment funds managed by Apollo. Ratings represent Financial Strength Ratings for Athene’s primary insurance subsidiaries. THIRD-PARTY SIDECAR FOUNDING IPO MERGER ANNOUNCEMENT UPGRADE TO ‘A+’RATED ‘A-’ UPGRADE TO ‘A+’ 2009 2013 2014 2016 2019 2020 UPGRADED TO ‘A’ 2021 2018 2022 Apollo-Athene Merger Closes 2017 UPGRADED TO ‘A’
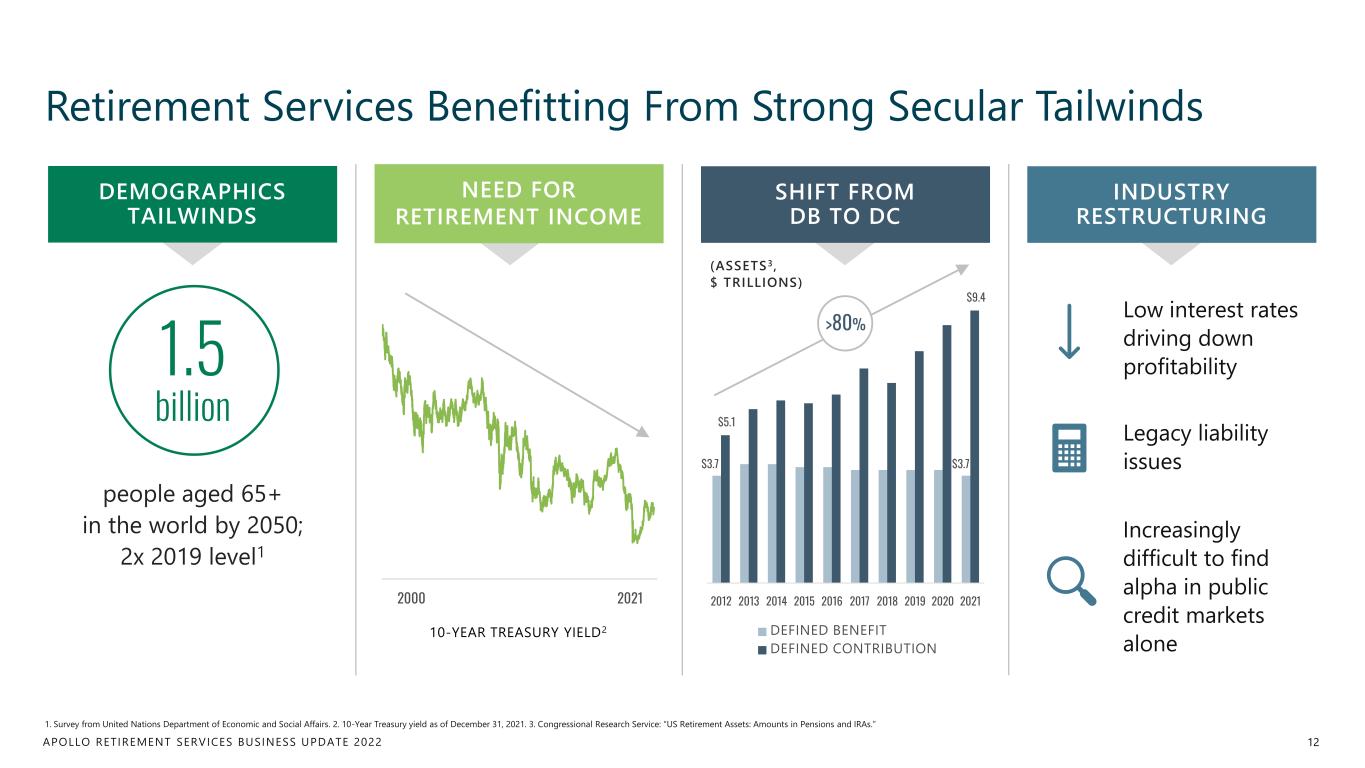
APOLLO RETIREMENT SERVICES BUSINESS UPDATE 2022 Retirement Services Benefitting From Strong Secular Tailwinds 12 1. Survey from United Nations Department of Economic and Social Affairs. 2. 10-Year Treasury yield as of December 31, 2021. 3. Congressional Research Service: “US Retirement Assets: Amounts in Pensions and IRAs.” 1.5 billion Low interest rates driving down profitability Legacy liability issues Increasingly difficult to find alpha in public credit markets alone 10-YEAR TREASURY YIELD2 INDUSTRY RESTRUCTURING SHIFT FROM DB TO DC NEED FOR RETIREMENT INCOME DEMOGRAPHICS TAILWINDS people aged 65+ in the world by 2050; 2x 2019 level1 2000 2021 $3.7 $3.7 $5.1 $9.4 2012 2013 2014 2015 2016 2017 2018 2019 2020 2021 DEFINED BENEFIT DEFINED CONTRIBUTION (ASSETS3, $ TRILLIONS) >80%
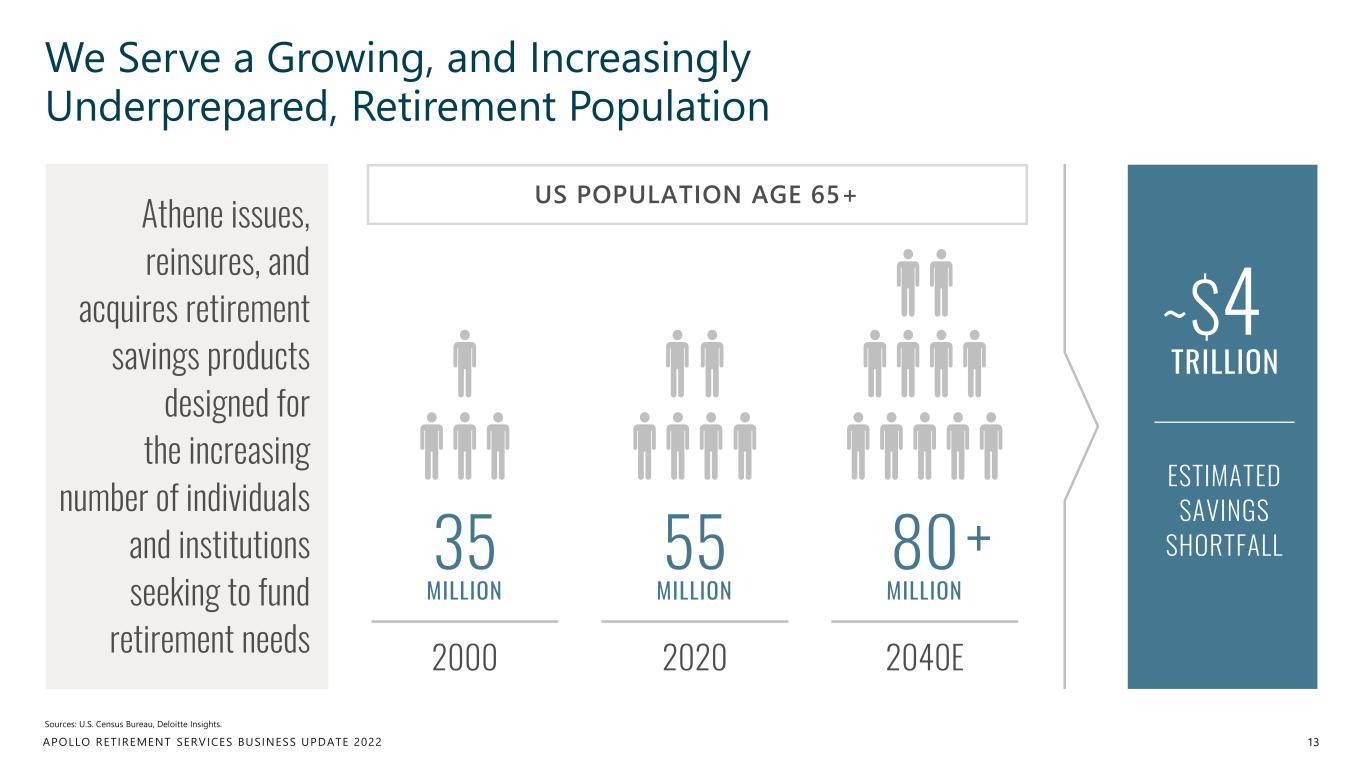
APOLLO RETIREMENT SERVICES BUSINESS UPDATE 2022 We Serve a Growing, and Increasingly Underprepared, Retirement Population 13 Sources: U.S. Census Bureau, Deloitte Insights. Athene issues, reinsures, and acquires retirement savings products designed for the increasing number of individuals and institutions seeking to fund retirement needs 35 MILLION 2000 55 MILLION 2020 +80 MILLION 2040E US POPULATION AGE 65+ $4 TRILLION ~ ESTIMATED SAVINGS SHORTFALL
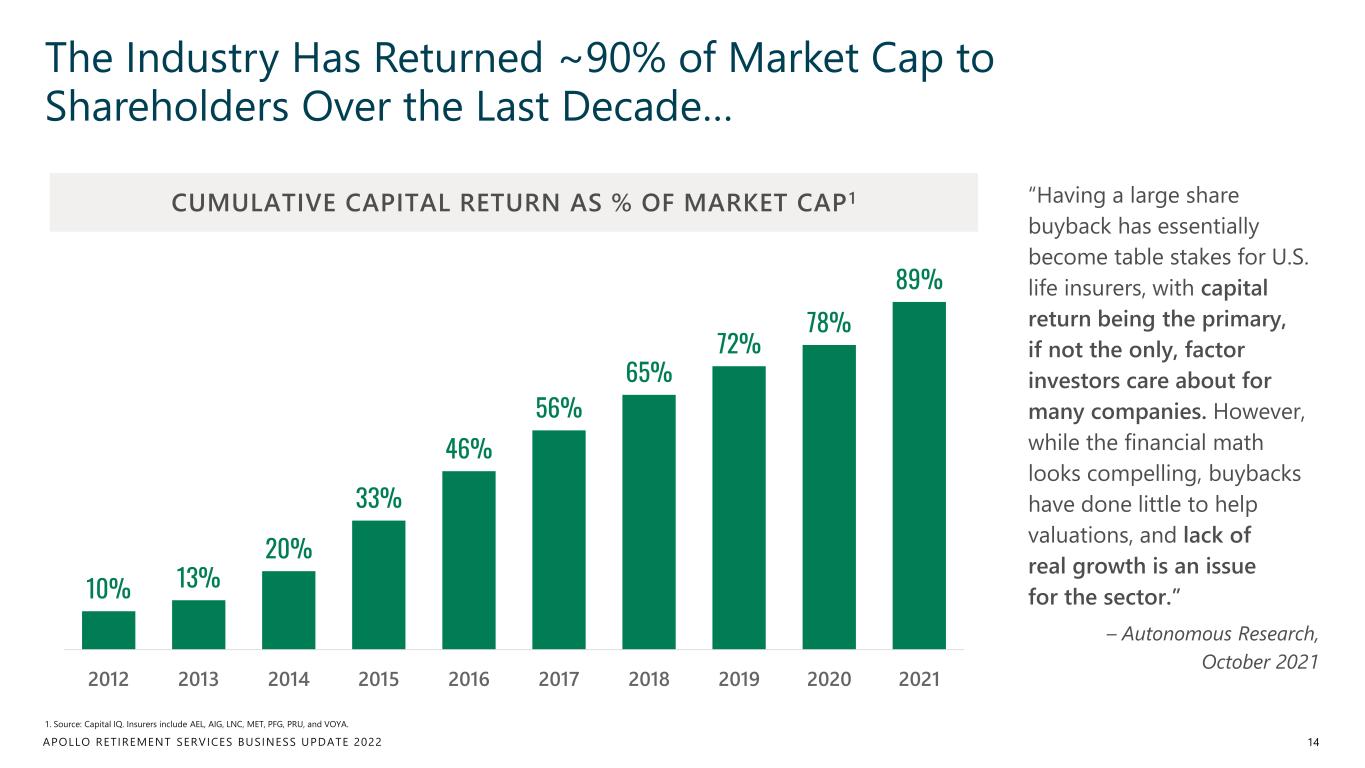
APOLLO RETIREMENT SERVICES BUSINESS UPDATE 2022 The Industry Has Returned ~90% of Market Cap to Shareholders Over the Last Decade… 14 1. Source: Capital IQ. Insurers include AEL, AIG, LNC, MET, PFG, PRU, and VOYA. CUMULATIVE CAPITAL RETURN AS % OF MARKET CAP 1 “Having a large share buyback has essentially become table stakes for U.S. life insurers, with capital return being the primary, if not the only, factor investors care about for many companies. However, while the financial math looks compelling, buybacks have done little to help valuations, and lack of real growth is an issue for the sector.” – Autonomous Research, October 2021 10% 13% 20% 33% 46% 56% 65% 72% 78% 89% 2012 2013 2014 2015 2016 2017 2018 2019 2020 2021
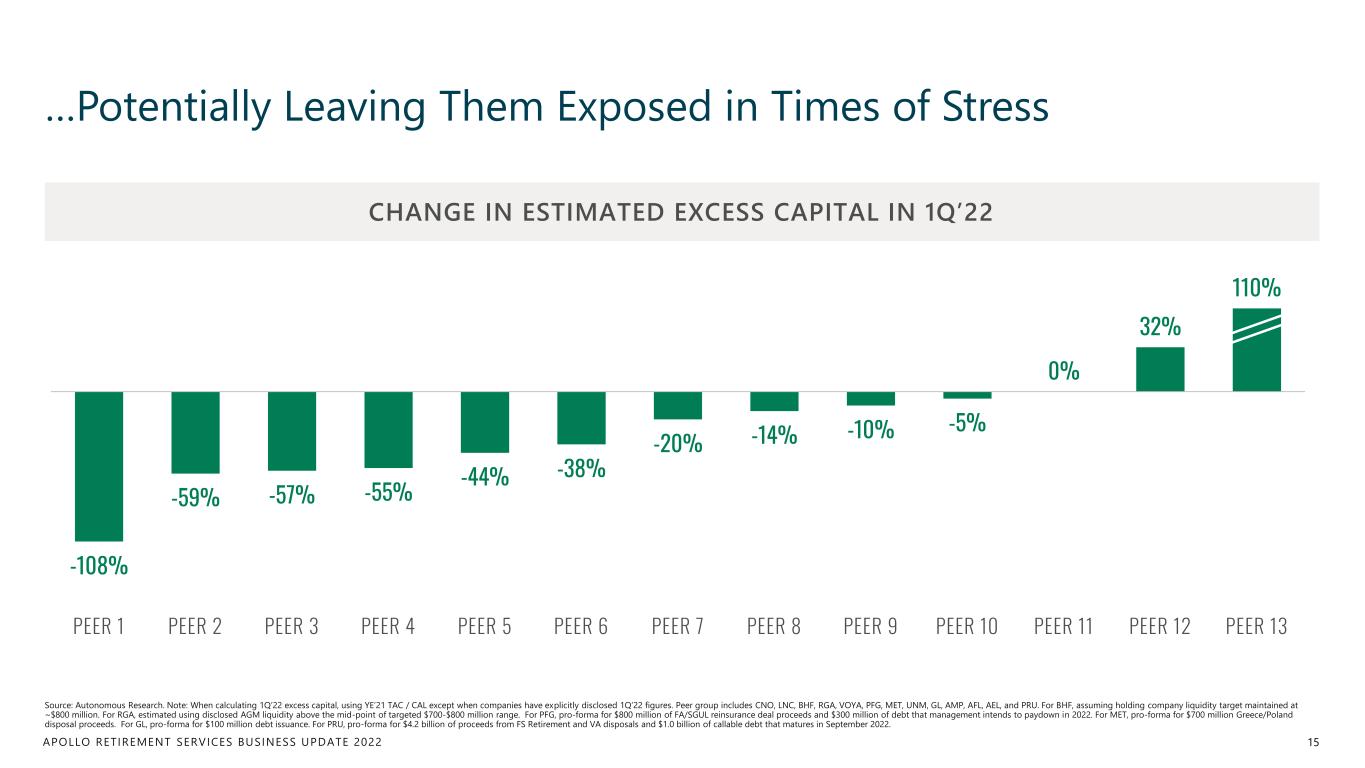
APOLLO RETIREMENT SERVICES BUSINESS UPDATE 2022 …Potentially Leaving Them Exposed in Times of Stress 15 Source: Autonomous Research. Note: When calculating 1Q’22 excess capital, using YE’21 TAC / CAL except when companies have explicitly disclosed 1Q’22 figures. Peer group includes CNO, LNC, BHF, RGA, VOYA, PFG, MET, UNM, GL, AMP, AFL, AEL, and PRU. For BHF, assuming holding company liquidity target maintained at ~$800 million. For RGA, estimated using disclosed AGM liquidity above the mid-point of targeted $700-$800 million range. For PFG, pro-forma for $800 million of FA/SGUL reinsurance deal proceeds and $300 million of debt that management intends to paydown in 2022. For MET, pro-forma for $700 million Greece/Poland disposal proceeds. For GL, pro-forma for $100 million debt issuance. For PRU, pro-forma for $4.2 billion of proceeds from FS Retirement and VA disposals and $1.0 billion of callable debt that matures in September 2022. CHANGE IN ESTIMATED EXCESS CAPITAL IN 1Q’22 -108% -59% -57% -55% -44% -38% -20% -14% -10% -5% 0% 32% 110% PEER 1 PEER 2 PEER 3 PEER 4 PEER 5 PEER 6 PEER 7 PEER 8 PEER 9 PEER 10 PEER 11 PEER 12 PEER 13
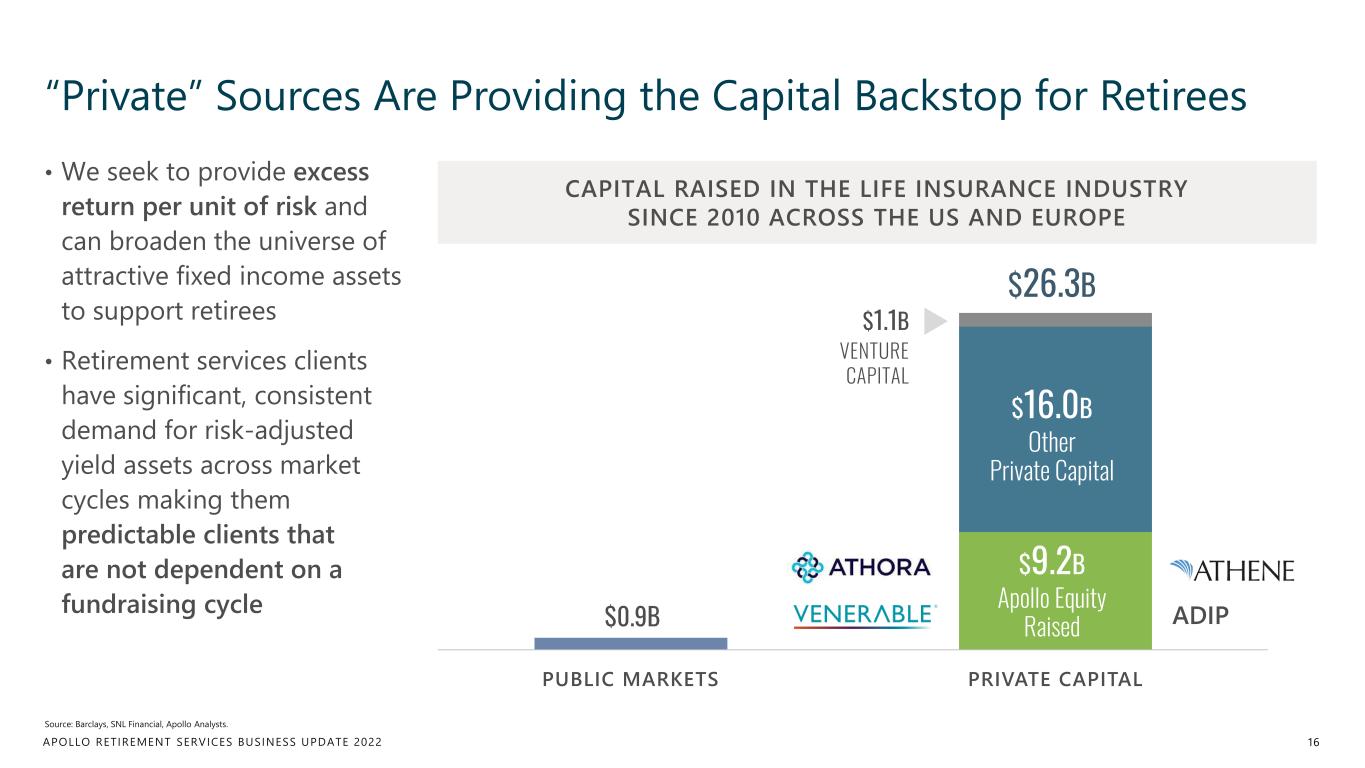
APOLLO RETIREMENT SERVICES BUSINESS UPDATE 2022 “Private” Sources Are Providing the Capital Backstop for Retirees 16 Source: Barclays, SNL Financial, Apollo Analysts. CAPITAL RAISED IN THE LIFE INSURANCE INDUSTRY SINCE 2010 ACROSS THE US AND EUROPE $0.9B PUBLIC MARKETS PRIVATE CAPITAL • We seek to provide excess return per unit of risk and can broaden the universe of attractive fixed income assets to support retirees • Retirement services clients have significant, consistent demand for risk-adjusted yield assets across market cycles making them predictable clients that are not dependent on a fundraising cycle ADIP $9.2B Apollo Equity Raised $16.0B Other Private Capital $1.1B VENTURE CAPITAL $26.3B
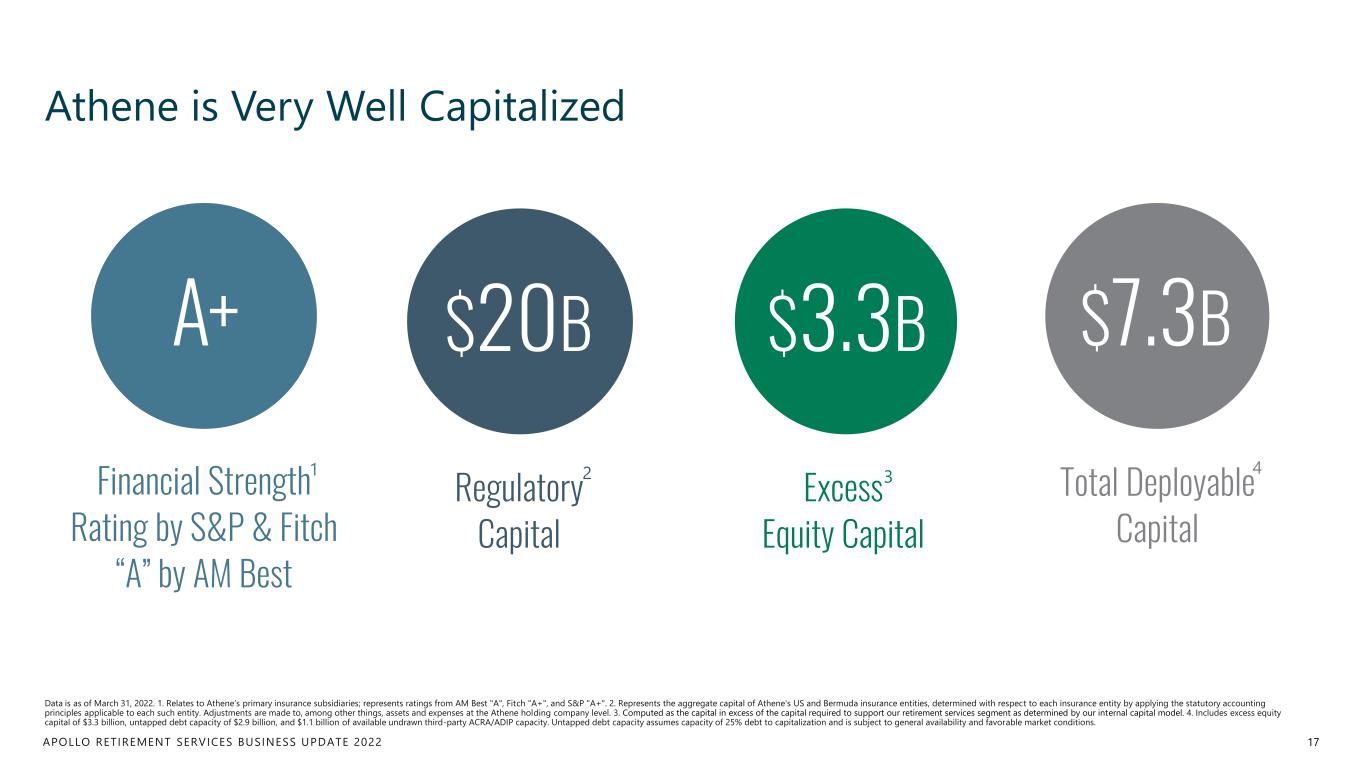
APOLLO RETIREMENT SERVICES BUSINESS UPDATE 2022 Athene is Very Well Capitalized 17 Financial Strength Rating by S&P & Fitch “A” by AM Best Total Deployable Capital A+ $7.3B Data is as of March 31, 2022. 1. Relates to Athene’s primary insurance subsidiaries; represents ratings from AM Best "A", Fitch "A+", and S&P "A+". 2. Represents the aggregate capital of Athene's US and Bermuda insurance entities, determined with respect to each insurance entity by applying the statutory accounting principles applicable to each such entity. Adjustments are made to, among other things, assets and expenses at the Athene holding company level. 3. Computed as the capital in excess of the capital required to support our retirement services segment as determined by our internal capital model. 4. Includes excess equity capital of $3.3 billion, untapped debt capacity of $2.9 billion, and $1.1 billion of available undrawn third-party ACRA/ADIP capacity. Untapped debt capacity assumes capacity of 25% debt to capitalization and is subject to general availability and favorable market conditions. 1 Excess Equity Capital $3.3B 3Regulatory Capital $20B 2 4
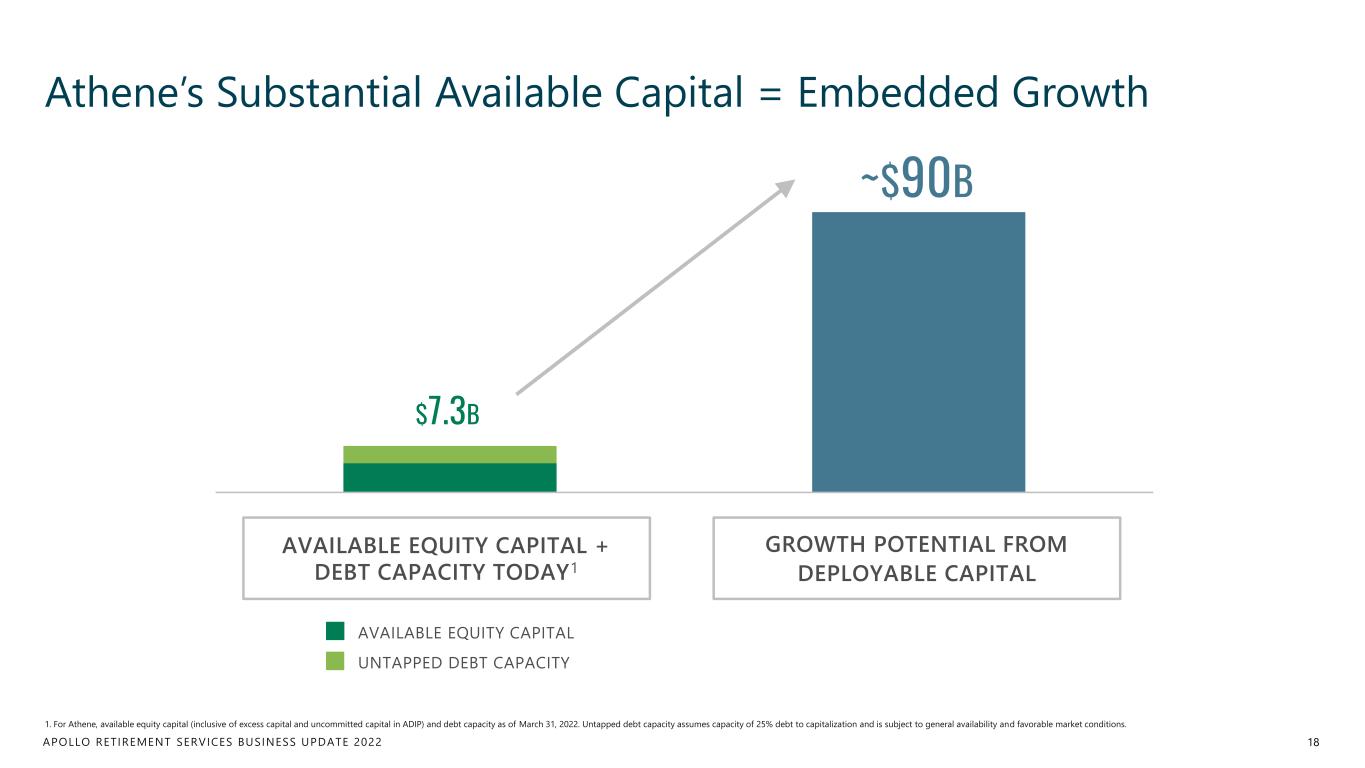
APOLLO RETIREMENT SERVICES BUSINESS UPDATE 2022 Athene’s Substantial Available Capital = Embedded Growth 18 1. For Athene, available equity capital (inclusive of excess capital and uncommitted capital in ADIP) and debt capacity as of March 31, 2022. Untapped debt capacity assumes capacity of 25% debt to capitalization and is subject to general availability and favorable market conditions. $7.3B ~$90B AVAILABLE EQUITY CAPITAL UNTAPPED DEBT CAPACITY GROWTH POTENTIAL FROM DEPLOYABLE CAPITAL AVAILABLE EQUITY CAPITAL + DEBT CAPACITY TODAY1
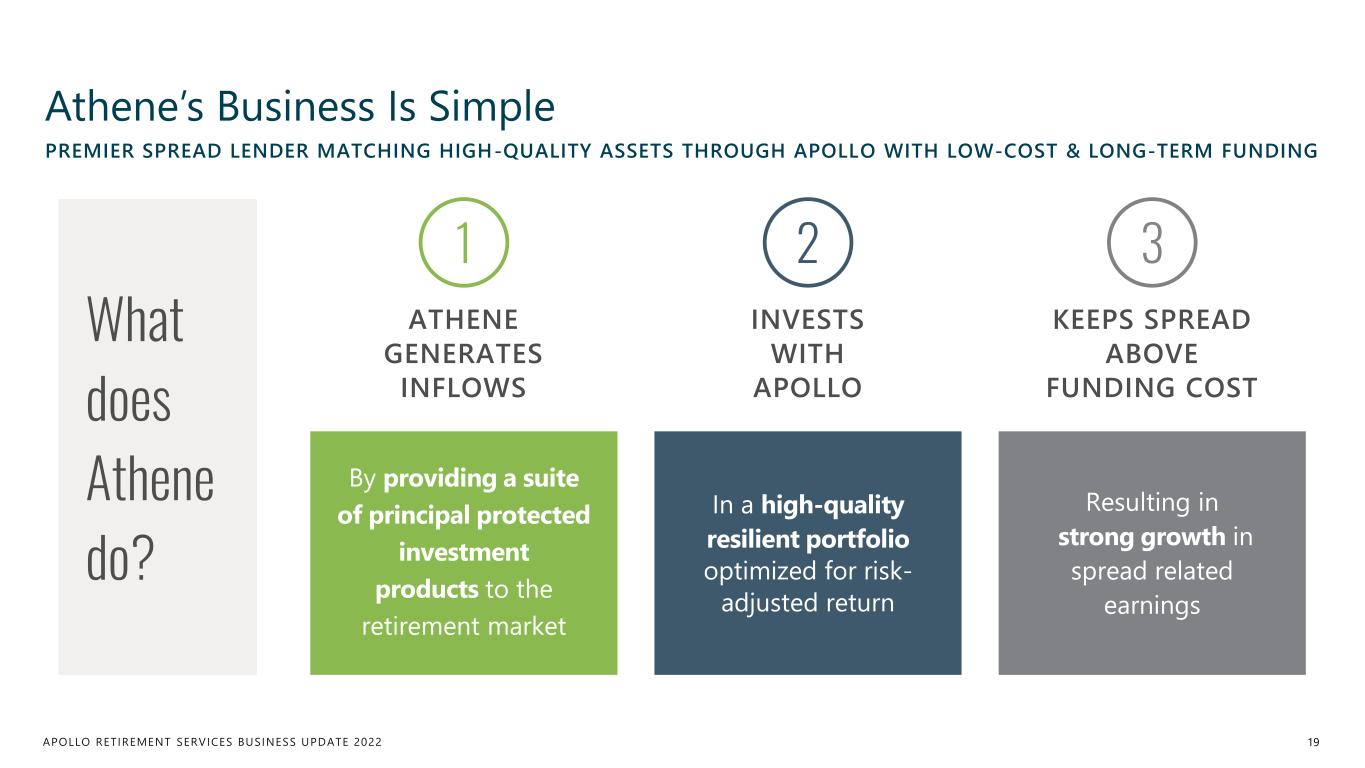
APOLLO RETIREMENT SERVICES BUSINESS UPDATE 2022 Athene’s Business Is Simple 19 By providing a suite of principal protected investment products to the retirement market ATHENE GENERATES INFLOWS 1 What does Athene do? INVESTS WITH APOLLO 2 In a high-quality resilient portfolio optimized for risk- adjusted return KEEPS SPREAD ABOVE FUNDING COST 3 Resulting in strong growth in spread related earnings PREMIER SPREAD LENDER MATCHING HIGH-QUALITY ASSETS THROUGH APOLLO WITH LOW-COST & LONG-TERM FUNDING
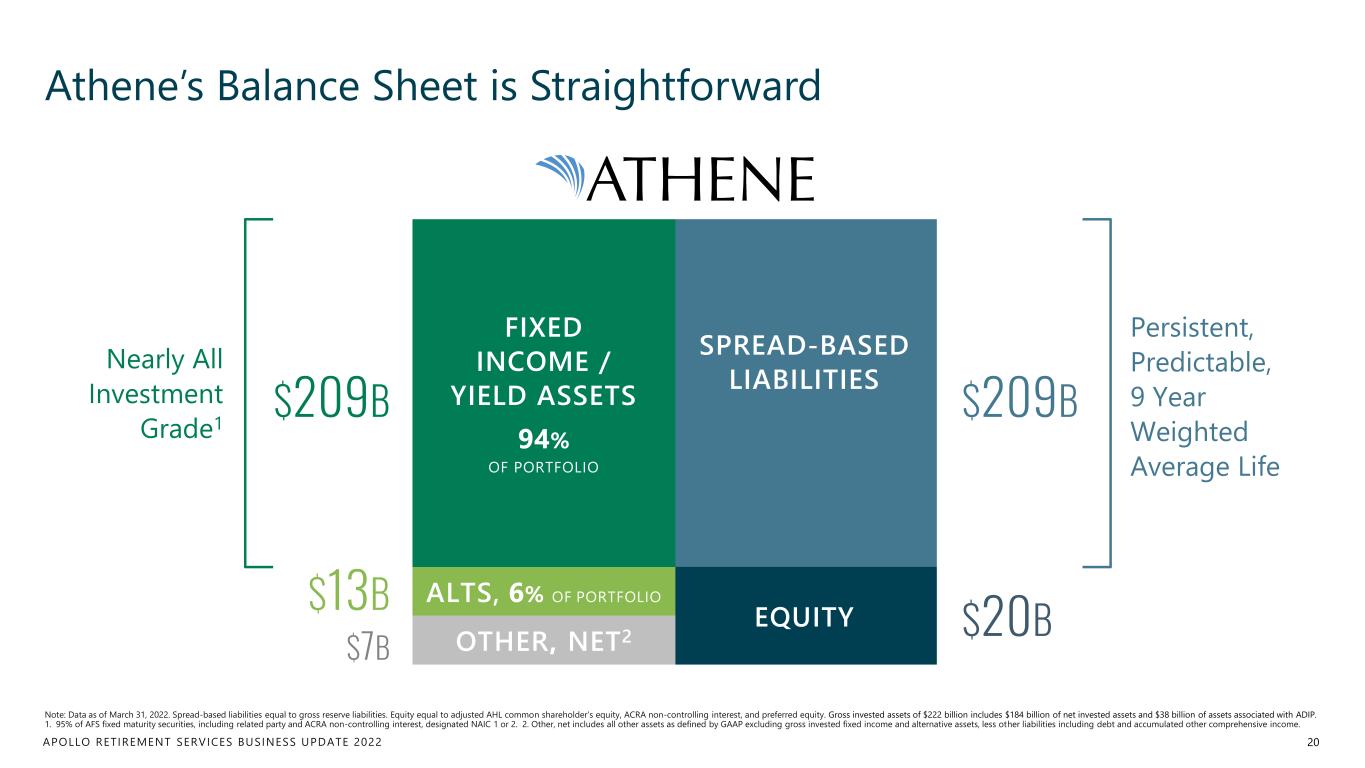
APOLLO RETIREMENT SERVICES BUSINESS UPDATE 2022 Athene’s Balance Sheet is Straightforward 20 Note: Data as of March 31, 2022. Spread-based liabilities equal to gross reserve liabilities. Equity equal to adjusted AHL common shareholder’s equity, ACRA non-controlling interest, and preferred equity. Gross invested assets of $222 billion includes $184 billion of net invested assets and $38 billion of assets associated with ADIP. 1. 95% of AFS fixed maturity securities, including related party and ACRA non-controlling interest, designated NAIC 1 or 2. 2. Other, net includes all other assets as defined by GAAP excluding gross invested fixed income and alternative assets, less other liabilities including debt and accumulated other comprehensive income. $209B $13B $209B $20B Nearly All Investment Grade1 Persistent, Predictable, 9 Year Weighted Average Life $7B SPREAD-BASED LIABILITIES FIXED INCOME / YIELD ASSETS 94% OF PORTFOLIO EQUITY ALTS, 6% OF PORTFOLIO OTHER, NET2
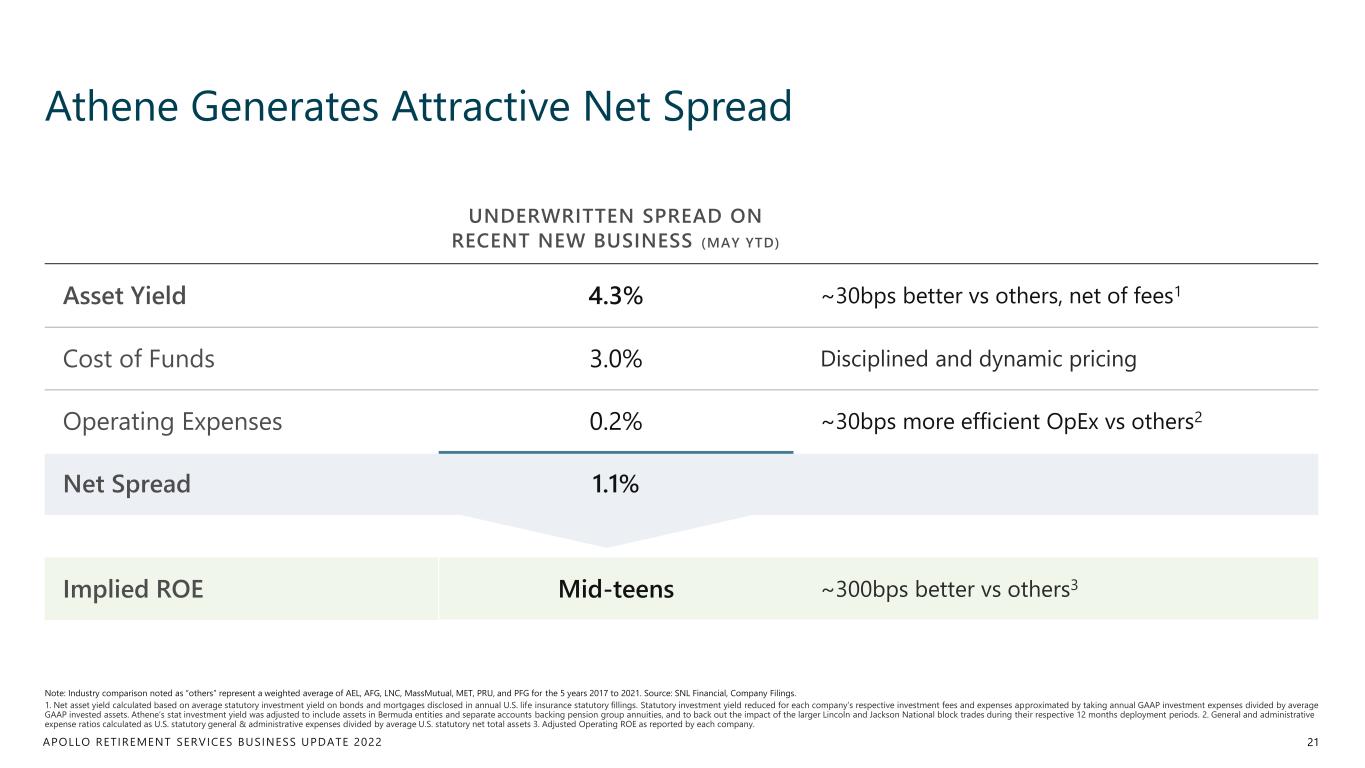
APOLLO RETIREMENT SERVICES BUSINESS UPDATE 2022 UNDERWRITTEN SPREAD ON RECENT NEW BUSINESS (MAY YTD) Asset Yield 4.3% ~30bps better vs others, net of fees1 Cost of Funds 3.0% Disciplined and dynamic pricing Operating Expenses 0.2% ~30bps more efficient OpEx vs others2 Net Spread 1.1% Implied ROE Mid-teens ~300bps better vs others3 Athene Generates Attractive Net Spread 21 Note: Industry comparison noted as “others” represent a weighted average of AEL, AFG, LNC, MassMutual, MET, PRU, and PFG for the 5 years 2017 to 2021. Source: SNL Financial, Company Filings. 1. Net asset yield calculated based on average statutory investment yield on bonds and mortgages disclosed in annual U.S. life insurance statutory fillings. Statutory investment yield reduced for each company’s respective investment fees and expenses approximated by taking annual GAAP investment expenses divided by average GAAP invested assets. Athene’s stat investment yield was adjusted to include assets in Bermuda entities and separate accounts backing pension group annuities, and to back out the impact of the larger Lincoln and Jackson National block trades during their respective 12 months deployment periods. 2. General and administrative expense ratios calculated as U.S. statutory general & administrative expenses divided by average U.S. statutory net total assets 3. Adjusted Operating ROE as reported by each company.
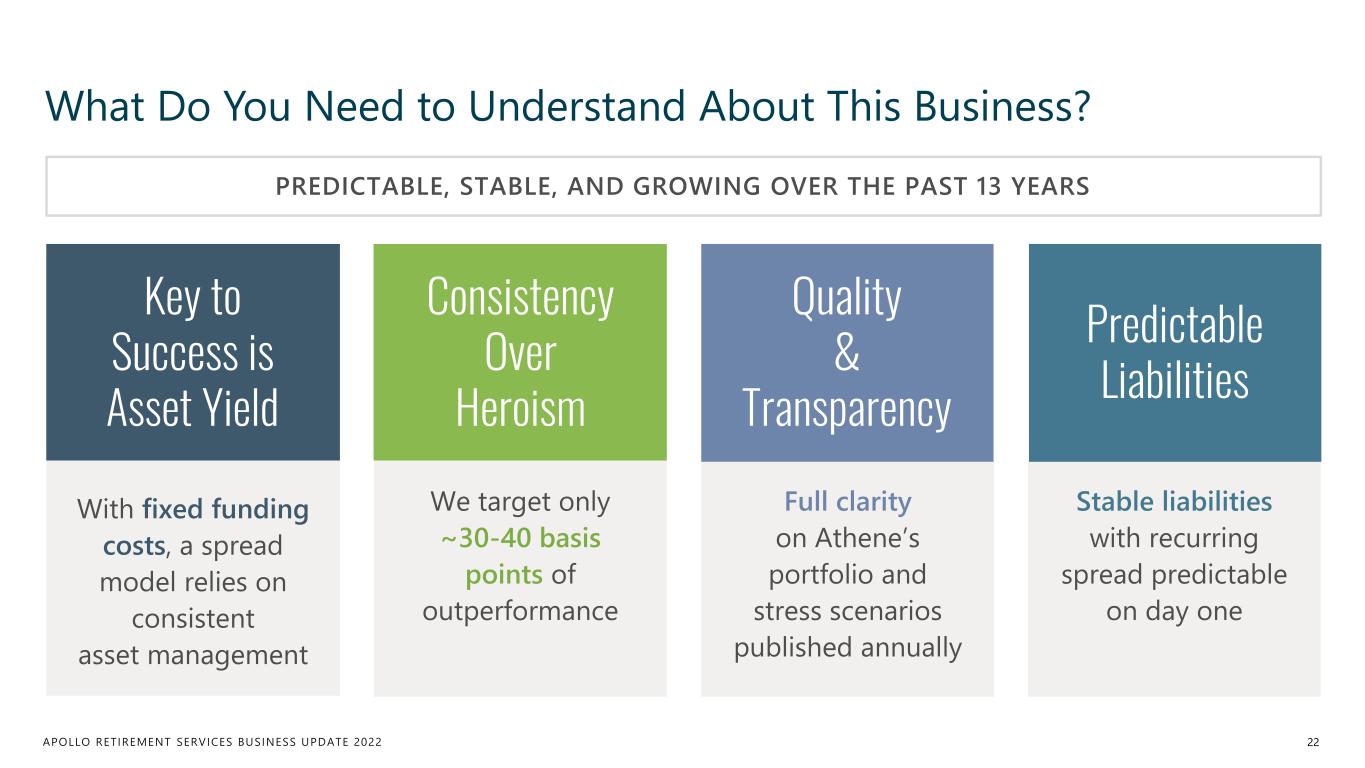
APOLLO RETIREMENT SERVICES BUSINESS UPDATE 2022 What Do You Need to Understand About This Business? 22 With fixed funding costs, a spread model relies on consistent asset management Key to Success is Asset Yield We target only ~30-40 basis points of outperformance Consistency Over Heroism Full clarity on Athene’s portfolio and stress scenarios published annually Quality & Transparency Stable liabilities with recurring spread predictable on day one Predictable Liabilities PREDICTABLE, STABLE, AND GROWING OVER THE PAST 13 YEARS
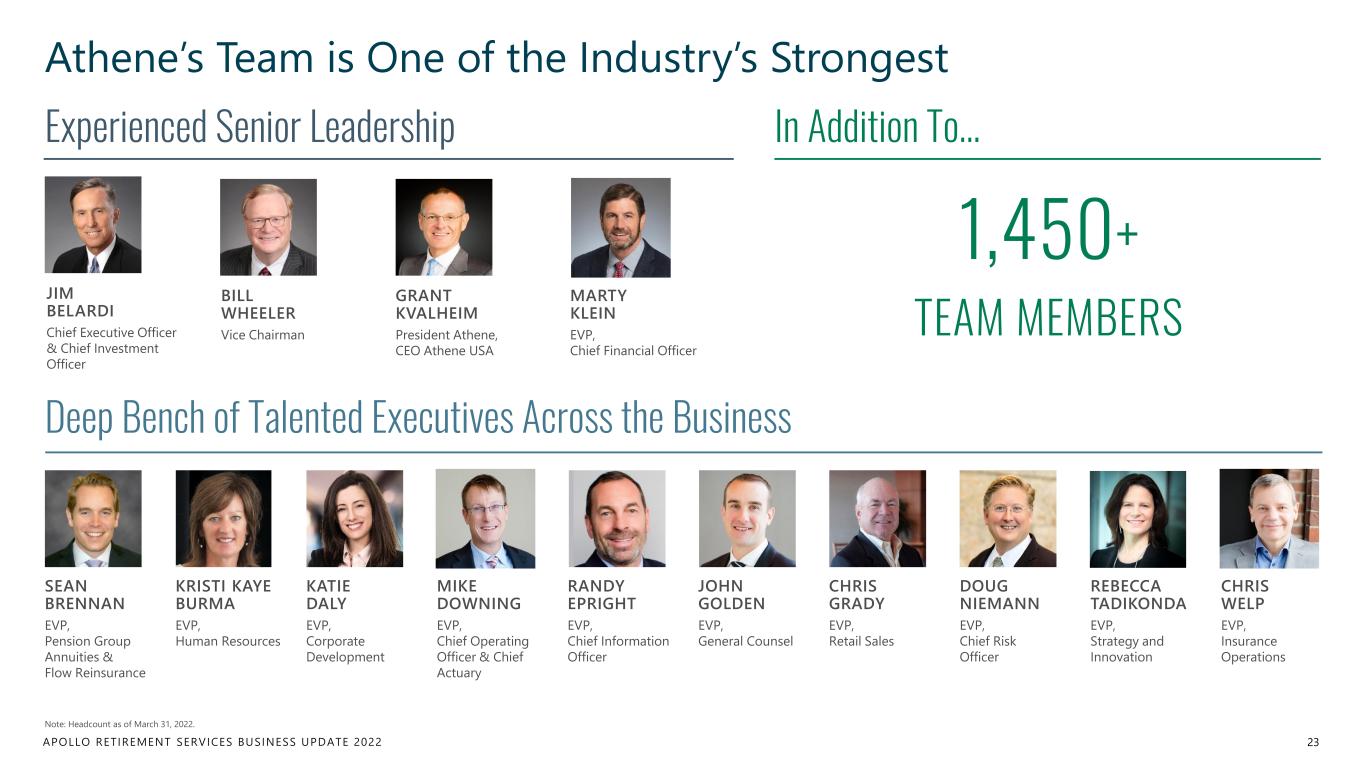
APOLLO RETIREMENT SERVICES BUSINESS UPDATE 2022 Athene’s Team is One of the Industry’s Strongest 23 Note: Headcount as of March 31, 2022. JIM BELARDI Chief Executive Officer & Chief Investment Officer BILL WHEELER Vice Chairman GRANT KVALHEIM President Athene, CEO Athene USA MARTY KLEIN EVP, Chief Financial Officer JOHN GOLDEN EVP, General Counsel KATIE DALY EVP, Corporate Development SEAN BRENNAN EVP, Pension Group Annuities & Flow Reinsurance CHRIS GRADY EVP, Retail Sales CHRIS WELP EVP, Insurance Operations DOUG NIEMANN EVP, Chief Risk Officer MIKE DOWNING EVP, Chief Operating Officer & Chief Actuary RANDY EPRIGHT EVP, Chief Information Officer KRISTI KAYE BURMA EVP, Human Resources REBECCA TADIKONDA EVP, Strategy and Innovation 1,450+ TEAM MEMBERS Experienced Senior Leadership In Addition To… Deep Bench of Talented Executives Across the Business
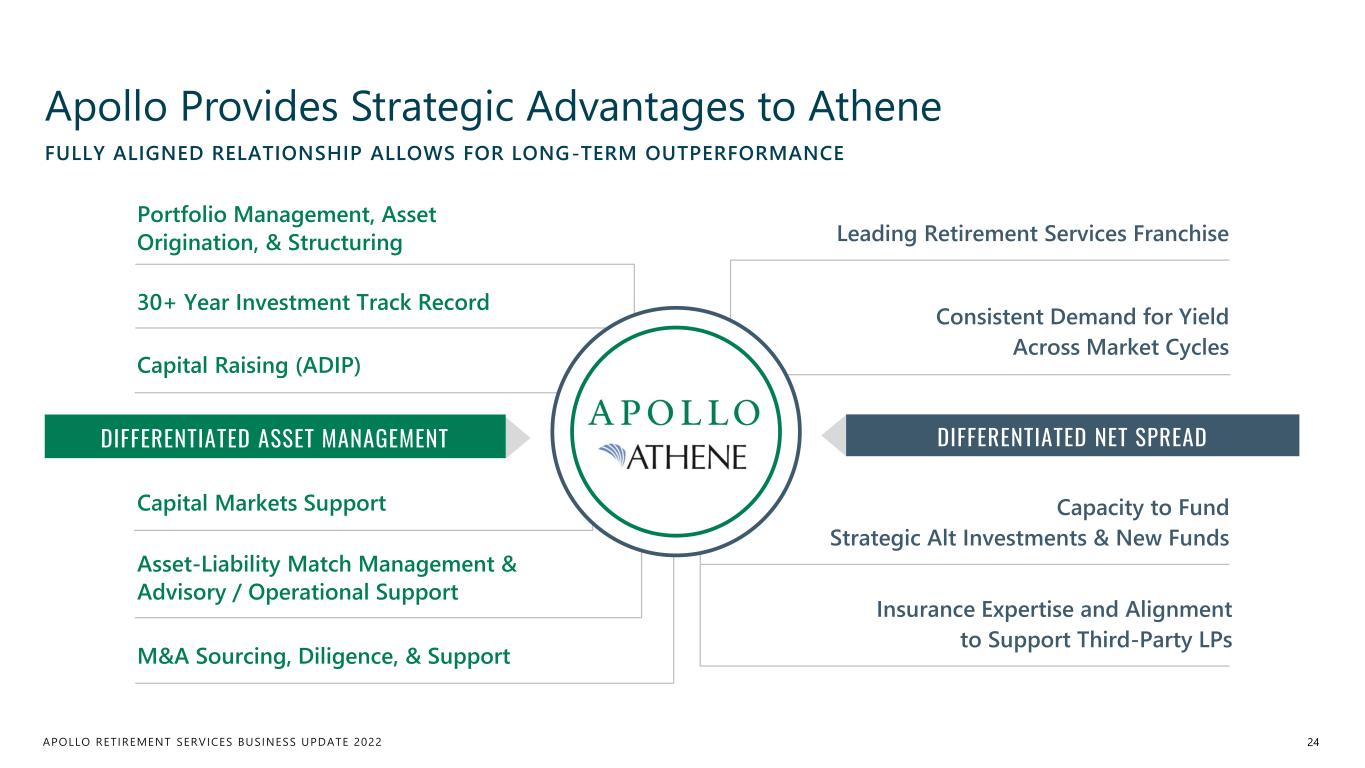
APOLLO RETIREMENT SERVICES BUSINESS UPDATE 2022 Consistent Demand for Yield Across Market Cycles Apollo Provides Strategic Advantages to Athene 24 FULLY ALIGNED RELATIONSHIP ALLOWS FOR LONG-TERM OUTPERFORMANCE Portfolio Management, Asset Origination, & Structuring Capital Markets Support Insurance Expertise and Alignment to Support Third-Party LPs Leading Retirement Services Franchise Capital Raising (ADIP) Capacity to Fund Strategic Alt Investments & New Funds 30+ Year Investment Track Record DIFFERENTIATED ASSET MANAGEMENT DIFFERENTIATED NET SPREAD Asset-Liability Match Management & Advisory / Operational Support M&A Sourcing, Diligence, & Support
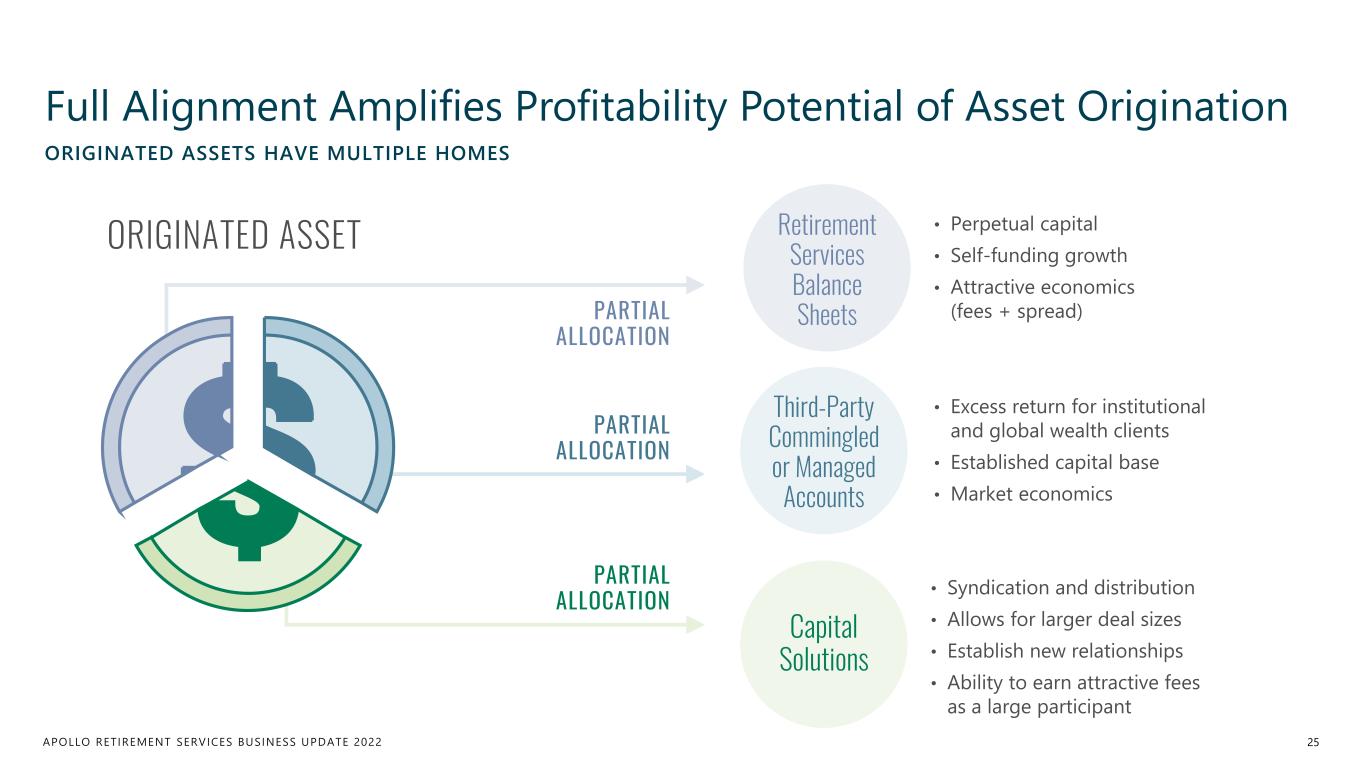
APOLLO RETIREMENT SERVICES BUSINESS UPDATE 2022 Full Alignment Amplifies Profitability Potential of Asset Origination 25 ORIGINATED ASSETS HAVE MULTIPLE HOMES • Excess return for institutional and global wealth clients • Established capital base • Market economics Third-Party Commingled or Managed Accounts • Perpetual capital • Self-funding growth • Attractive economics (fees + spread) Retirement Services Balance Sheets • Syndication and distribution • Allows for larger deal sizes • Establish new relationships • Ability to earn attractive fees as a large participant Capital Solutions ORIGINATED ASSET PARTIAL ALLOCATION PARTIAL ALLOCATION PARTIAL ALLOCATION
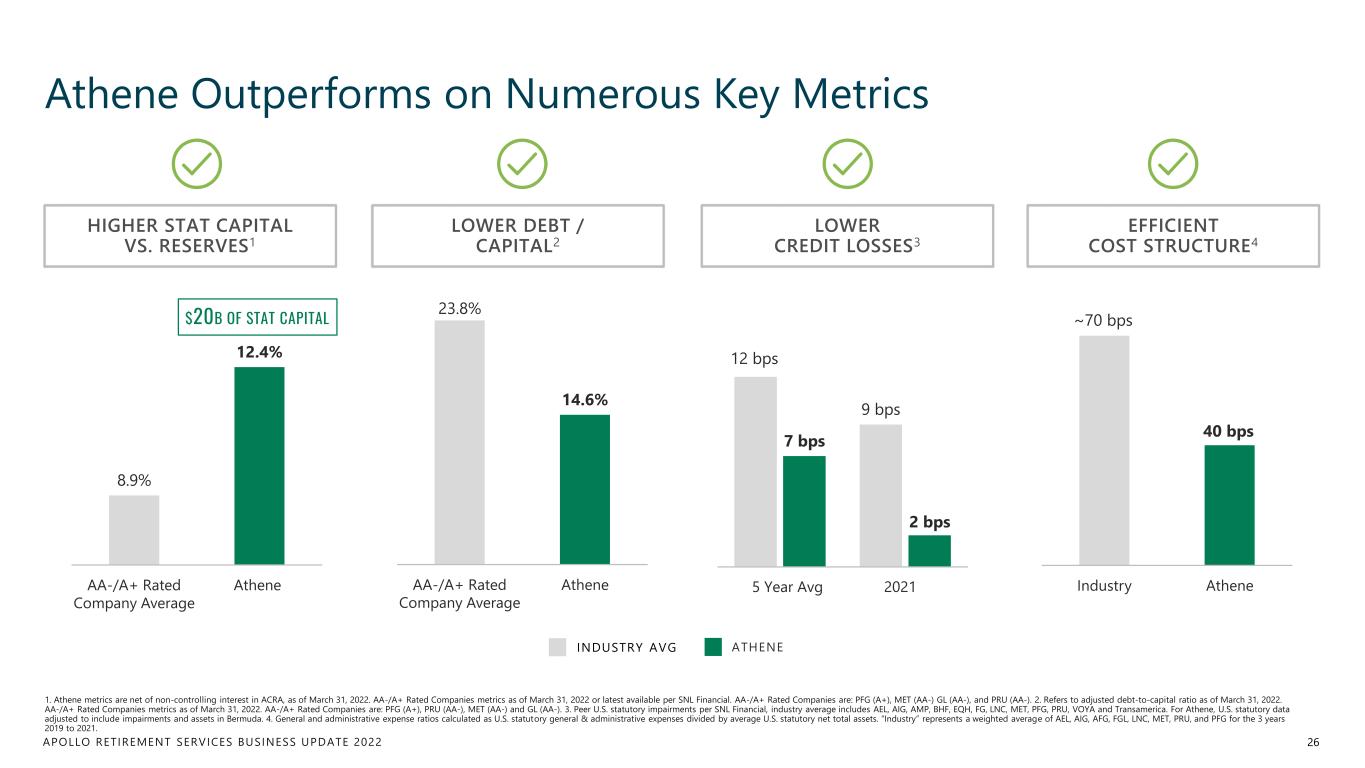
APOLLO RETIREMENT SERVICES BUSINESS UPDATE 2022 Athene Outperforms on Numerous Key Metrics 26 1. Athene metrics are net of non-controlling interest in ACRA, as of March 31, 2022. AA-/A+ Rated Companies metrics as of March 31, 2022 or latest available per SNL Financial. AA-/A+ Rated Companies are: PFG (A+), MET (AA-) GL (AA-), and PRU (AA-). 2. Refers to adjusted debt-to-capital ratio as of March 31, 2022. AA-/A+ Rated Companies metrics as of March 31, 2022. AA-/A+ Rated Companies are: PFG (A+), PRU (AA-), MET (AA-) and GL (AA-). 3. Peer U.S. statutory impairments per SNL Financial, industry average includes AEL, AIG, AMP, BHF, EQH, FG, LNC, MET, PFG, PRU, VOYA and Transamerica. For Athene, U.S. statutory data adjusted to include impairments and assets in Bermuda. 4. General and administrative expense ratios calculated as U.S. statutory general & administrative expenses divided by average U.S. statutory net total assets. “Industry” represents a weighted average of AEL, AIG, AFG, FGL, LNC, MET, PRU, and PFG for the 3 years 2019 to 2021. 12 bps 9 bps 7 bps 2 bps 5 Year Average 2021 8.9% 12.4% AA-/A+ Rated Company Average Athene 23.8% 14.6% AA-/A+ Rated Company Average Athene ~70 bps 40 bps Industry Athene20215 Year Av ATHENEINDUSTRY AVG HIGHER STAT CAPITAL VS. RESERVES1 LOWER DEBT / CAPITAL2 LOWER CREDIT LOSSES3 EFFICIENT COST STRUCTURE4 $20B OF STAT CAPITAL
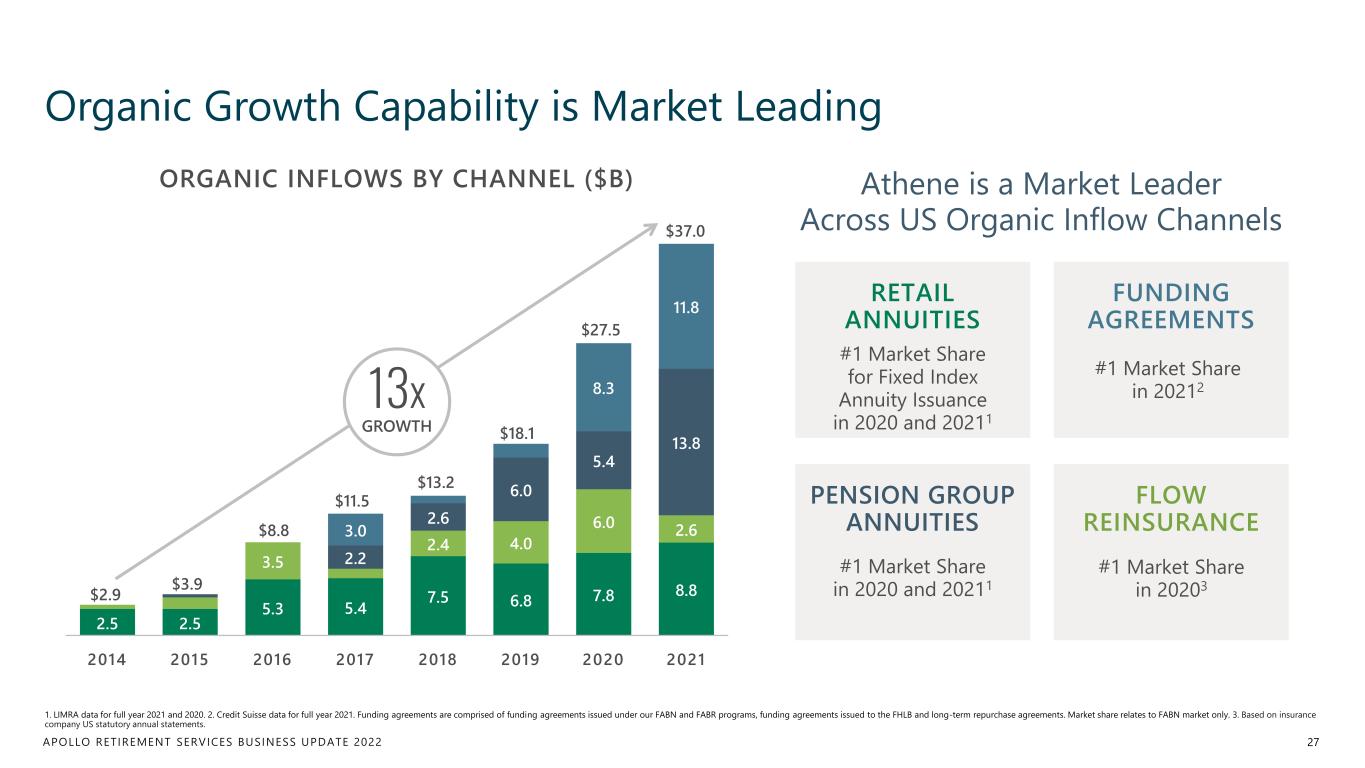
APOLLO RETIREMENT SERVICES BUSINESS UPDATE 2022 2.5 2.5 5.3 5.4 7.5 6.8 7.8 8.8 3.5 2.4 4.0 6.0 2.6 2.2 2.6 6.0 5.4 13.8 3.0 8.3 11.8 2014 2015 2016 2017 2018 2019 2020 2021 Organic Growth Capability is Market Leading 27 1. LIMRA data for full year 2021 and 2020. 2. Credit Suisse data for full year 2021. Funding agreements are comprised of funding agreements issued under our FABN and FABR programs, funding agreements issued to the FHLB and long-term repurchase agreements. Market share relates to FABN market only. 3. Based on insurance company US statutory annual statements. Athene is a Market Leader Across US Organic Inflow Channels 13x GROWTH $2.9 $3.9 $8.8 $11.5 $13.2 $18.1 $27.5 $37.0 ORGANIC INFLOWS BY CHANNEL ($B) PENSION GROUP ANNUITIES #1 Market Share in 2020 and 20211 FUNDING AGREEMENTS #1 Market Share in 20212 RETAIL ANNUITIES #1 Market Share for Fixed Index Annuity Issuance in 2020 and 20211 FLOW REINSURANCE #1 Market Share in 20203
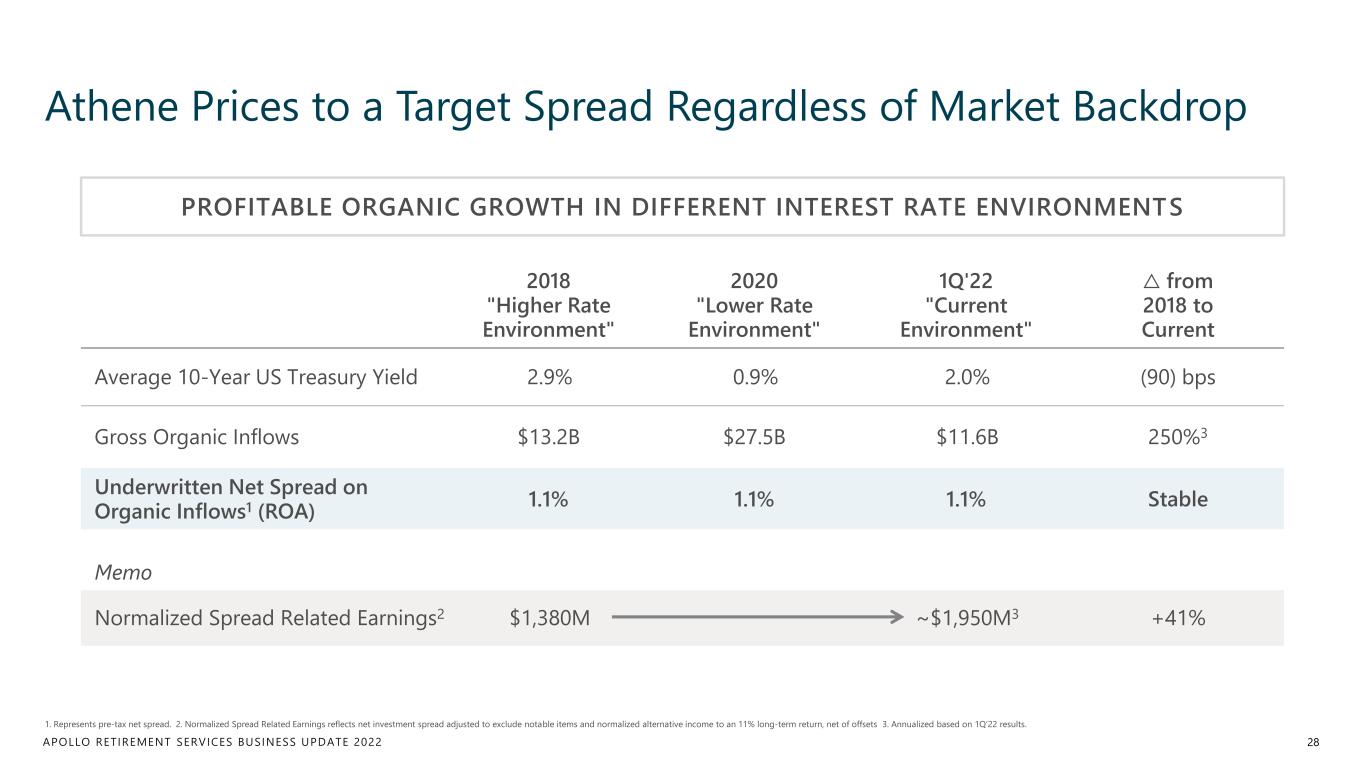
APOLLO RETIREMENT SERVICES BUSINESS UPDATE 2022 Athene Prices to a Target Spread Regardless of Market Backdrop 28 1. Represents pre-tax net spread. 2. Normalized Spread Related Earnings reflects net investment spread adjusted to exclude notable items and normalized alternative income to an 11% long-term return, net of offsets 3. Annualized based on 1Q’22 results. 2018 "Higher Rate Environment" 2020 "Lower Rate Environment" 1Q'22 "Current Environment" △ from 2018 to Current Average 10-Year US Treasury Yield 2.9% 0.9% 2.0% (90) bps Gross Organic Inflows $13.2B $27.5B $11.6B 250%3 Underwritten Net Spread on Organic Inflows1 (ROA) 1.1% 1.1% 1.1% Stable Memo Normalized Spread Related Earnings2 $1,380M ~$1,950M3 +41% PROFITABLE ORGANIC GROWTH IN DIFFERENT INTEREST RATE ENVIRONMENTS
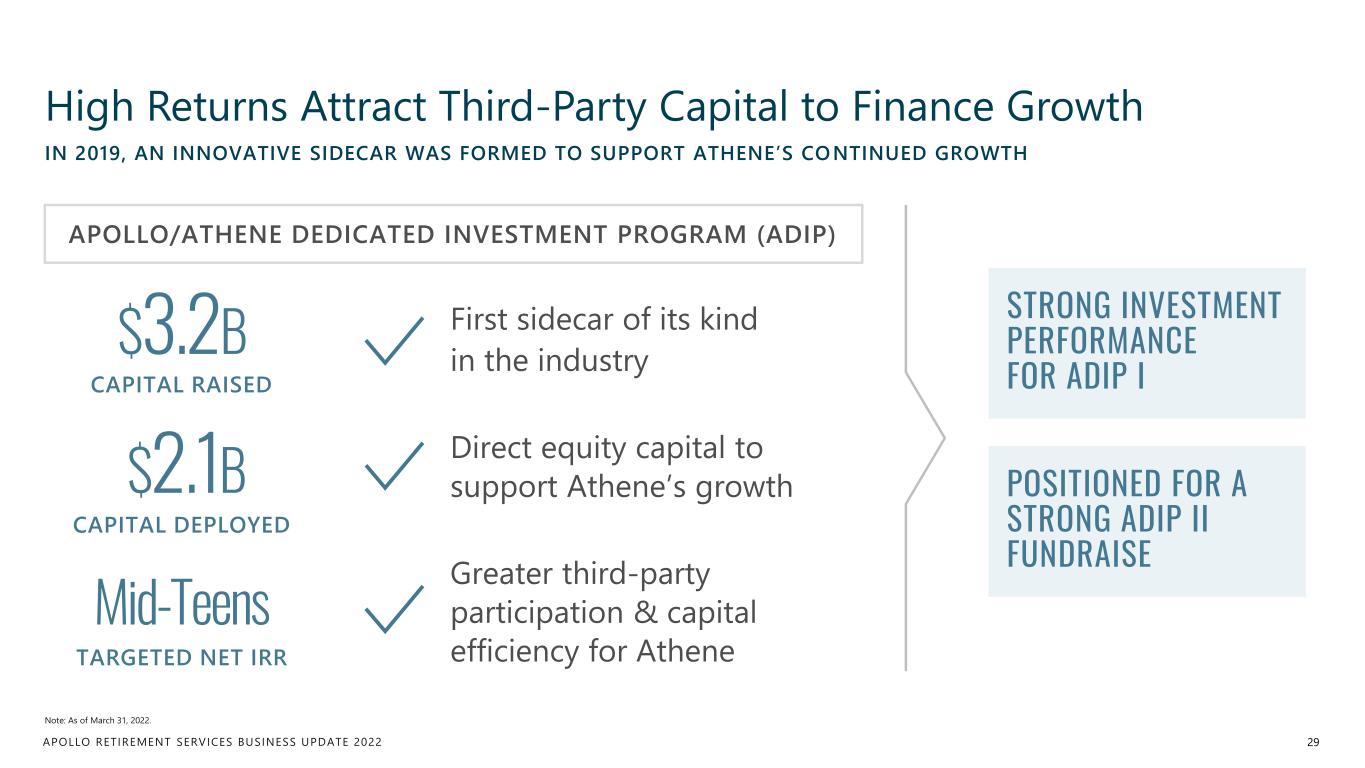
APOLLO RETIREMENT SERVICES BUSINESS UPDATE 2022 High Returns Attract Third-Party Capital to Finance Growth 29 Note: As of March 31, 2022. IN 2019, AN INNOVATIVE SIDECAR WAS FORMED TO SUPPORT ATHENE’S CONTINUED GROWTH APOLLO/ATHENE DEDICATED INVESTMENT PROGRAM (ADIP) CAPITAL RAISED $3.2B CAPITAL DEPLOYED $2.1B TARGETED NET IRR Mid-Teens First sidecar of its kind in the industry Direct equity capital to support Athene’s growth Greater third-party participation & capital efficiency for Athene STRONG INVESTMENT PERFORMANCE FOR ADIP I POSITIONED FOR A STRONG ADIP II FUNDRAISE
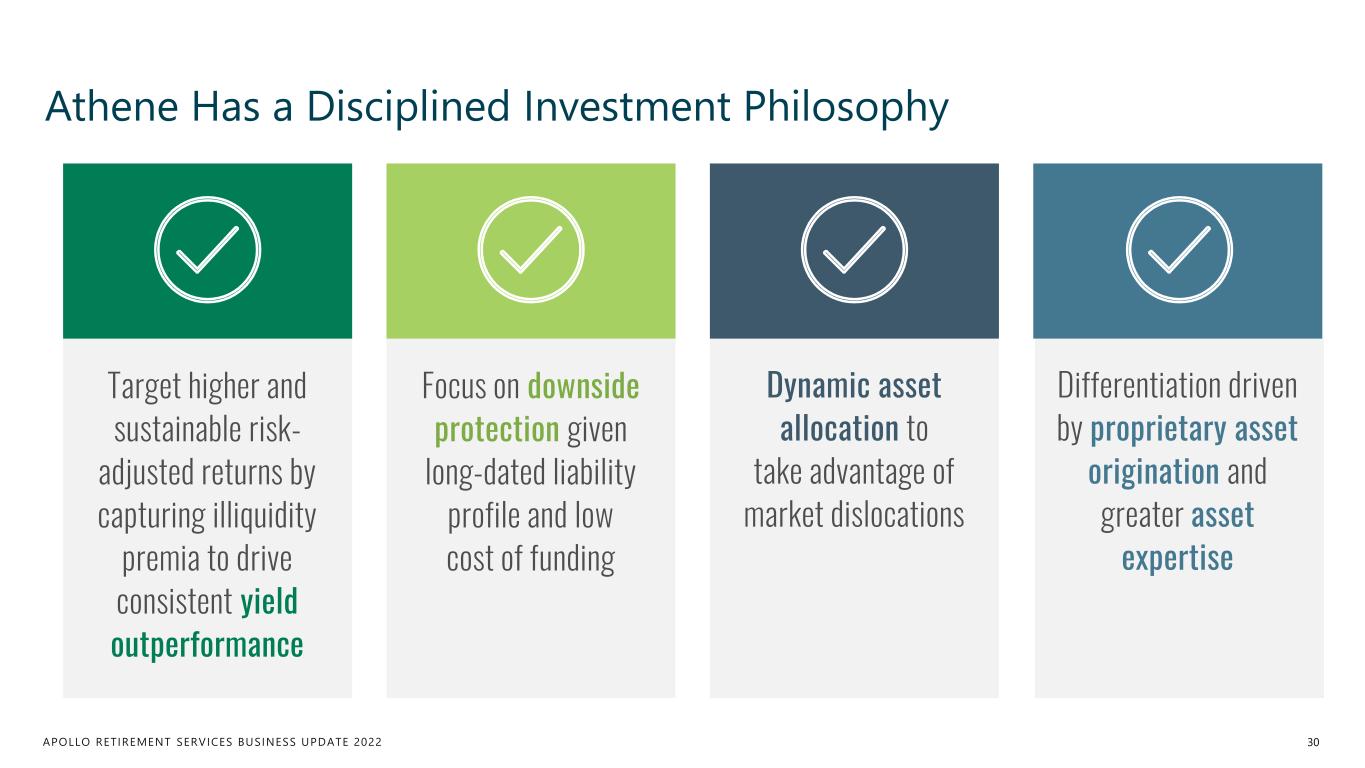
APOLLO RETIREMENT SERVICES BUSINESS UPDATE 2022 Athene Has a Disciplined Investment Philosophy 30 Target higher and sustainable risk- adjusted returns by capturing illiquidity premia to drive consistent yield outperformance Focus on downside protection given long-dated liability profile and low cost of funding Dynamic asset allocation to take advantage of market dislocations Differentiation driven by proprietary asset origination and greater asset expertise
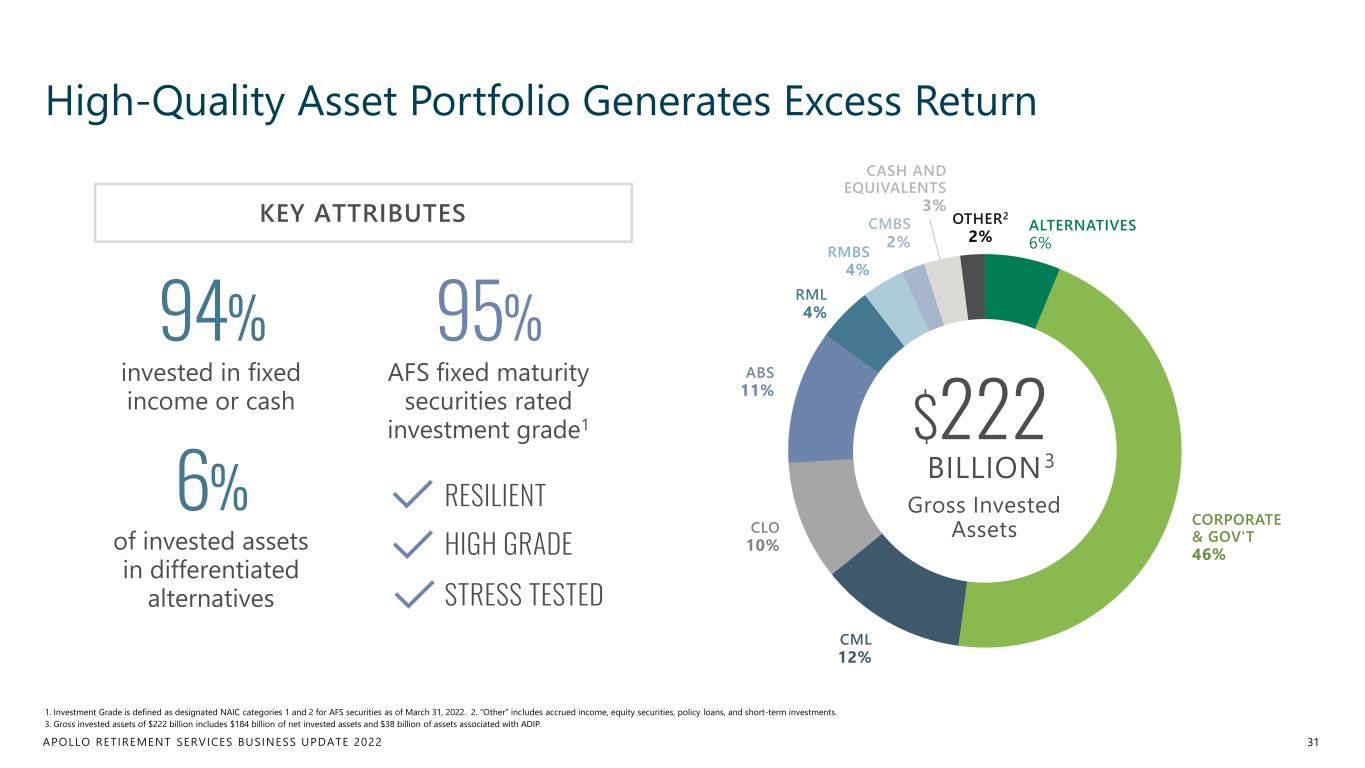
APOLLO RETIREMENT SERVICES BUSINESS UPDATE 2022 ALTERNATIVES 6% CORPORATE & GOV'T 46% CML 12% CLO 10% ABS 11% RML 4% RMBS 4% CMBS 2% CASH AND EQUIVALENTS 3% OTHER2 2% $222 BILLION High-Quality Asset Portfolio Generates Excess Return 31 1. Investment Grade is defined as designated NAIC categories 1 and 2 for AFS securities as of March 31, 2022. 2. “Other” includes accrued income, equity securities, policy loans, and short-term investments. 3. Gross invested assets of $222 billion includes $184 billion of net invested assets and $38 billion of assets associated with ADIP. AFS fixed maturity securities rated investment grade1 RESILIENT HIGH GRADE STRESS TESTED KEY ATTRIBUTES 95% invested in fixed income or cash 94% of invested assets in differentiated alternatives 6% 3 Gross Invested Assets
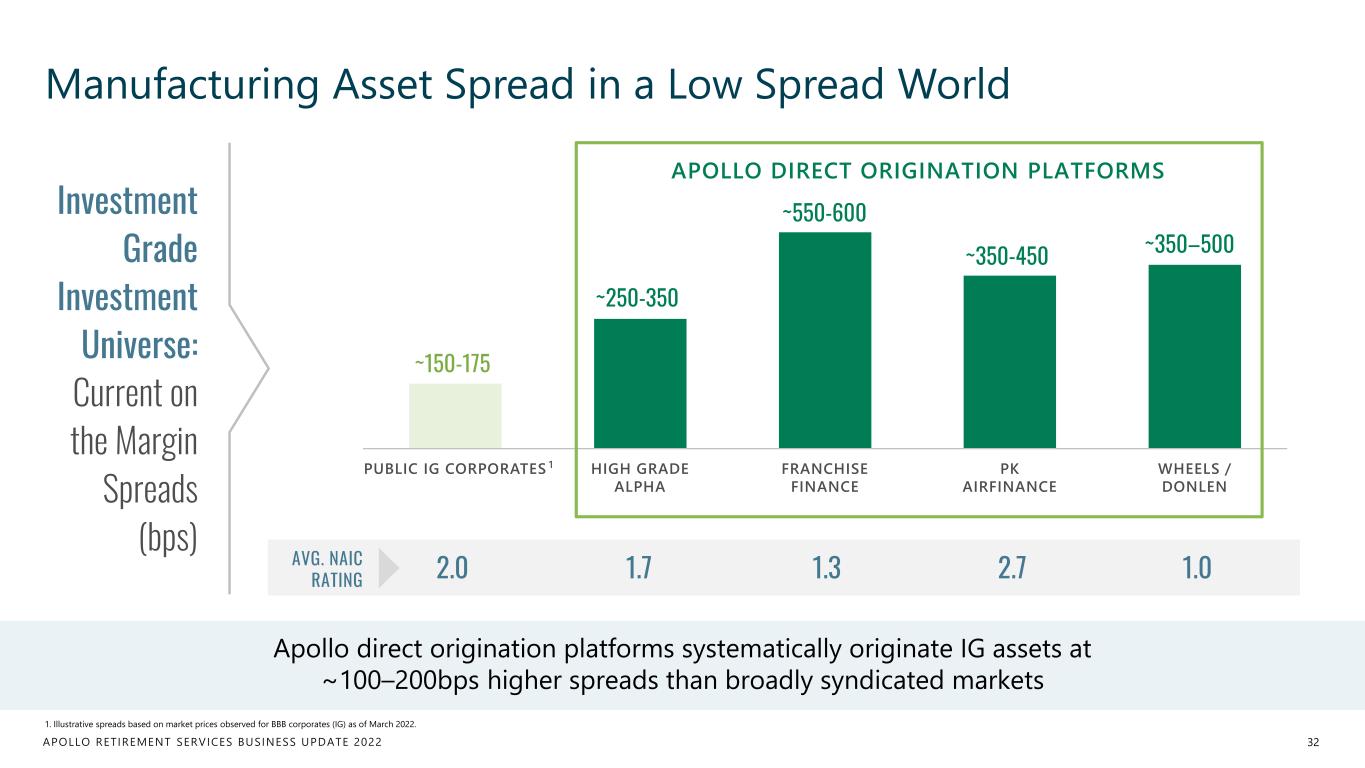
APOLLO RETIREMENT SERVICES BUSINESS UPDATE 2022 Manufacturing Asset Spread in a Low Spread World 32 1. Illustrative spreads based on market prices observed for BBB corporates (IG) as of March 2022. PUBLIC IG CORPORATES HIGH GRADE ALPHA FRANCHISE FINANCE PK AIRFINANCE WHEELS / DONLEN ~550-600 ~350-450 ~350–500 ~250-350 ~150-175 Apollo direct origination platforms systematically originate IG assets at ~100–200bps higher spreads than broadly syndicated markets Investment Grade Investment Universe: Current on the Margin Spreads (bps) APOLLO DIRECT ORIGINATION PLATFORMS 1 AVG. NAIC RATING 2.0 1.7 1.3 2.7 1.0
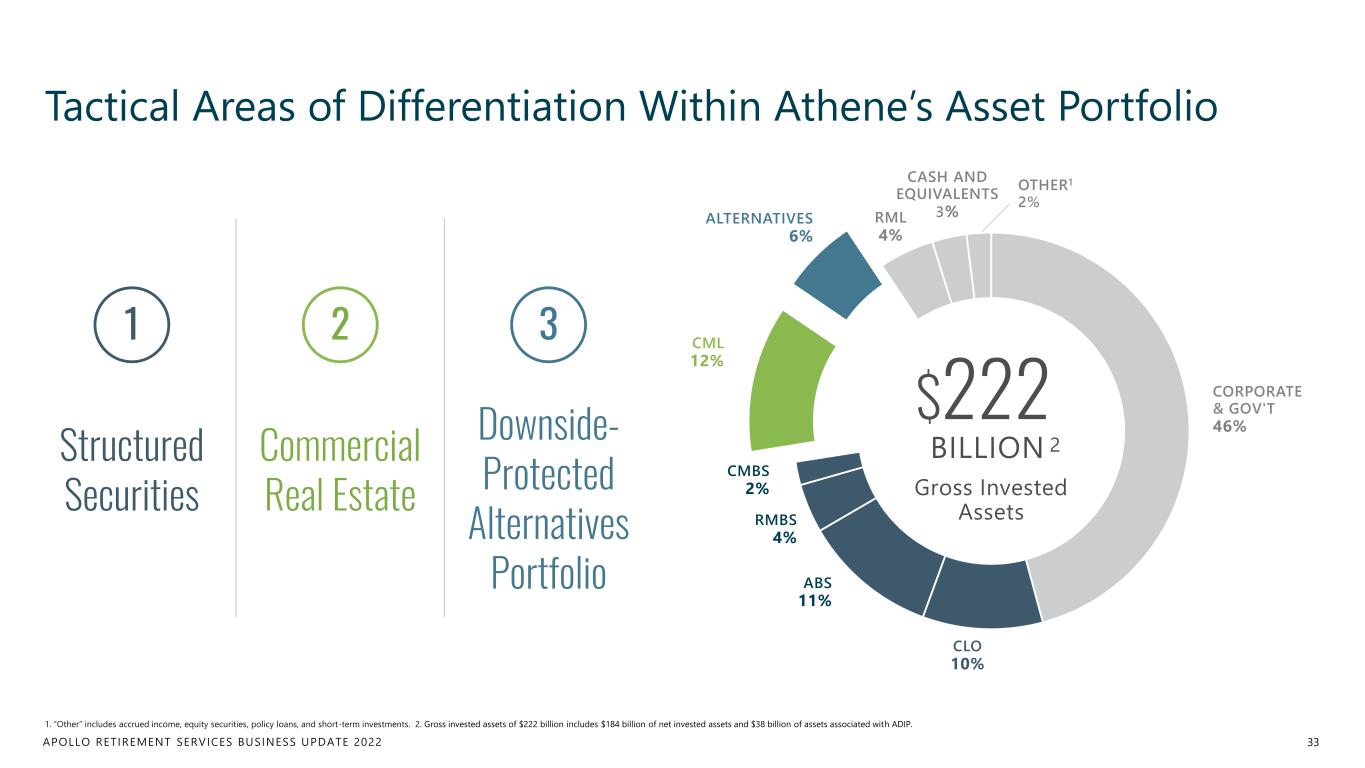
APOLLO RETIREMENT SERVICES BUSINESS UPDATE 2022 Tactical Areas of Differentiation Within Athene’s Asset Portfolio 33 Structured Securities 1 Commercial Real Estate 2 Downside- Protected Alternatives Portfolio 3 CORPORATE & GOV'T 46% CLO 10% ABS 11% RMBS 4% CMBS 2% CML 12% ALTERNATIVES 6% RML 4% CASH AND EQUIVALENTS 3% OTHER1 2% $222 BILLION 2 Gross Invested Assets 1. “Other” includes accrued income, equity securities, policy loans, and short-term investments. 2. Gross invested assets of $222 billion includes $184 billion of net invested assets and $38 billion of assets associated with ADIP.
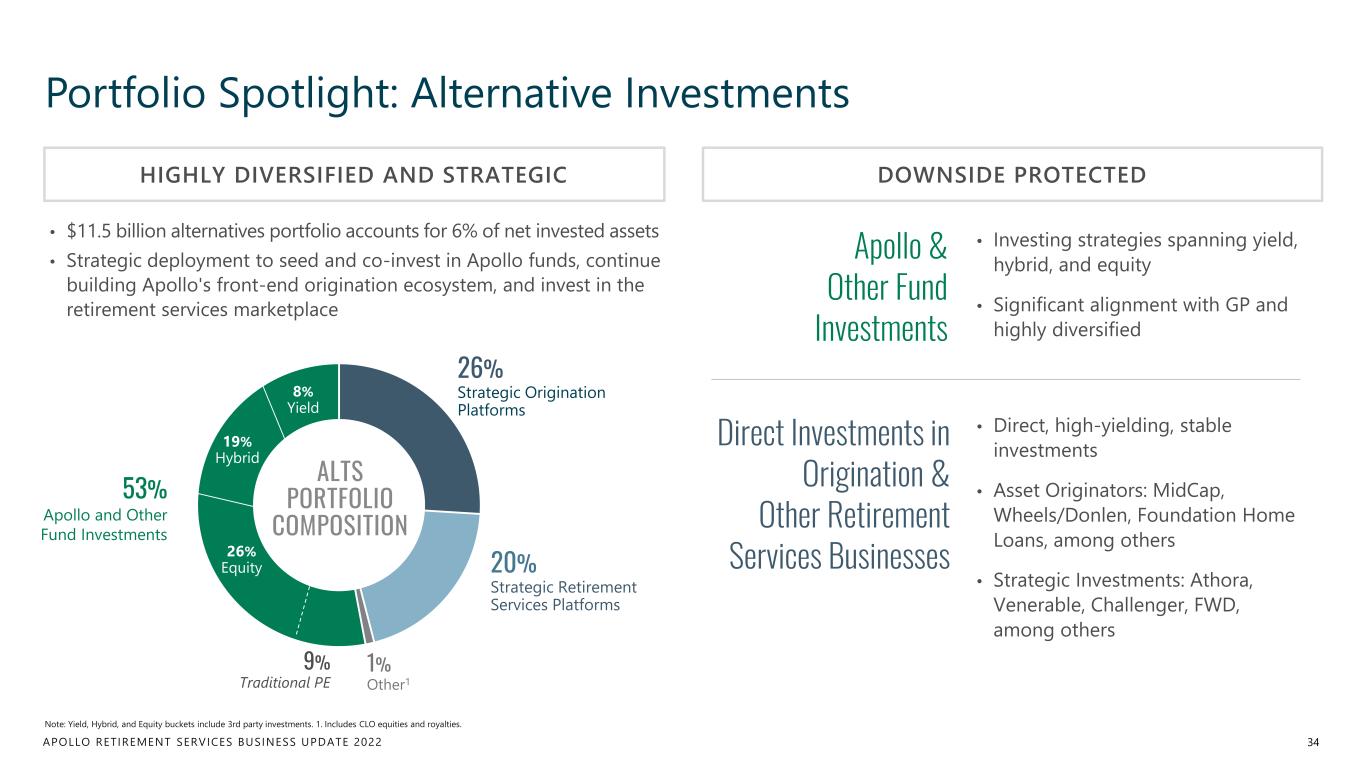
APOLLO RETIREMENT SERVICES BUSINESS UPDATE 2022 8% Yield 19% Hybrid 26% Equity 34 Note: Yield, Hybrid, and Equity buckets include 3rd party investments. 1. Includes CLO equities and royalties. • $11.5 billion alternatives portfolio accounts for 6% of net invested assets • Strategic deployment to seed and co-invest in Apollo funds, continue building Apollo's front-end origination ecosystem, and invest in the retirement services marketplace 53% Apollo and Other Fund Investments 26% Strategic Origination Platforms 20% Strategic Retirement Services Platforms 1% Other1 9% Traditional PE HIGHLY DIVERSIFIED AND STRATEGIC ALTS PORTFOLIO COMPOSITION • Investing strategies spanning yield, hybrid, and equity • Significant alignment with GP and highly diversified Apollo & Other Fund Investments Direct Investments in Origination & Other Retirement Services Businesses • Direct, high-yielding, stable investments • Asset Originators: MidCap, Wheels/Donlen, Foundation Home Loans, among others • Strategic Investments: Athora, Venerable, Challenger, FWD, among others DOWNSIDE PROTECTED Portfolio Spotlight: Alternative Investments
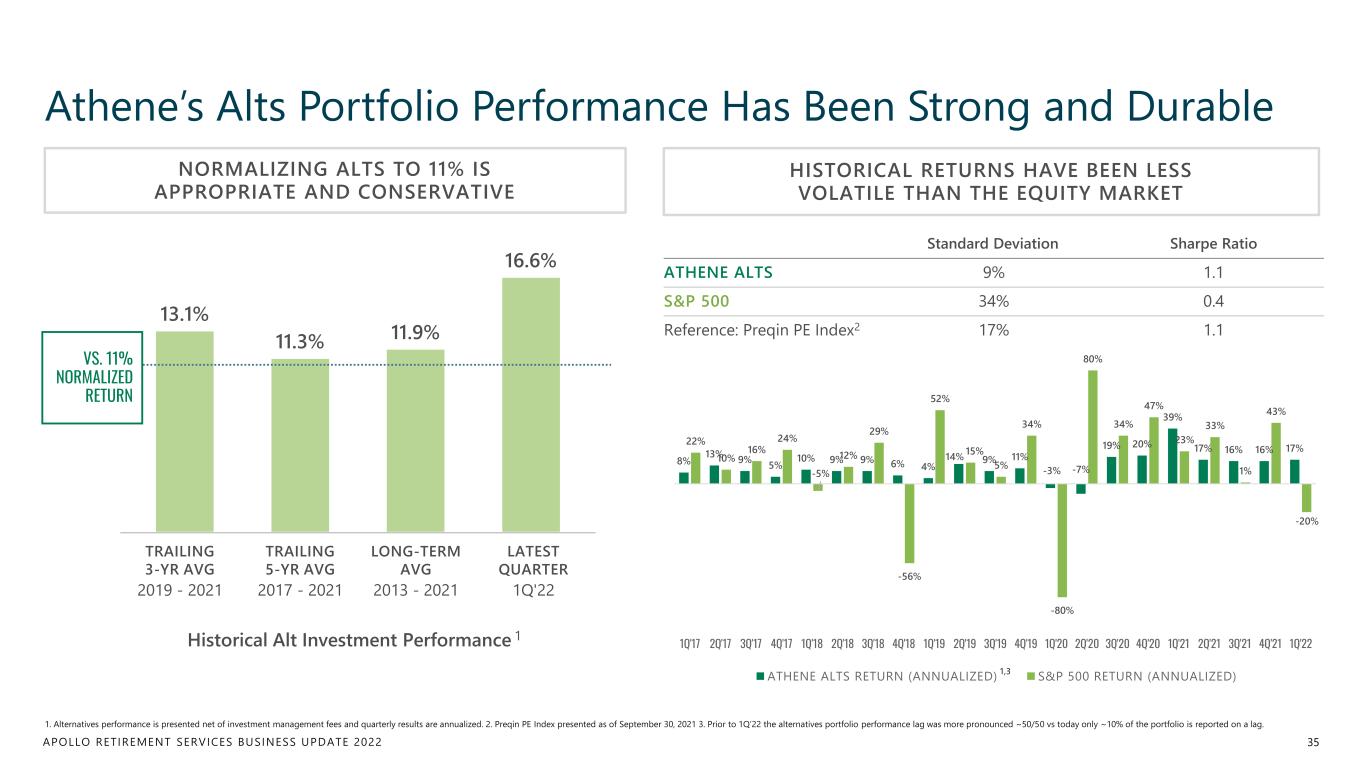
APOLLO RETIREMENT SERVICES BUSINESS UPDATE 2022 8% 13% 9% 5% 10% 9% 9% 6% 4% 14% 9% 11% -3% -7% 19% 20% 39% 17% 16% 16% 17% 22% 10% 16% 24% -5% 12% 29% -56% 52% 15% 5% 34% -80% 80% 34% 47% 23% 33% 1% 43% -20% 1Q'17 2Q'17 3Q'17 4Q'17 1Q'18 2Q'18 3Q'18 4Q'18 1Q'19 2Q'19 3Q'19 4Q'19 1Q'20 2Q'20 3Q'20 4Q'20 1Q'21 2Q'21 3Q'21 4Q'21 1Q'22 ATHENE ALTS RETURN (ANNUALIZED) S&P 500 RETURN (ANNUALIZED) Athene’s Alts Portfolio Performance Has Been Strong and Durable 35 1. Alternatives performance is presented net of investment management fees and quarterly results are annualized. 2. Preqin PE Index presented as of September 30, 2021 3. Prior to 1Q’22 the alternatives portfolio performance lag was more pronounced ~50/50 vs today only ~10% of the portfolio is reported on a lag. TRAILING 3-YR AVG TRAILING 5-YR AVG LONG-TERM AVG LATEST QUARTER 2019 - 2021 2017 - 2021 2013 - 2021 1Q'22 Standard Deviation Sharpe Ratio ATHENE ALTS 9% 1.1 S&P 500 34% 0.4 Reference: Preqin PE Index2 17% 1.1 NORMALIZING ALTS TO 11% IS APPROPRIATE AND CONSERVATIVE HISTORICAL RETURNS HAVE BEEN LESS VOLATILE THAN THE EQUITY MARKET 13.1% 11.3% 11.9% 16.6% VS. 11% NORMALIZED RETURN Historical Alt Investment Performance 1 1,3
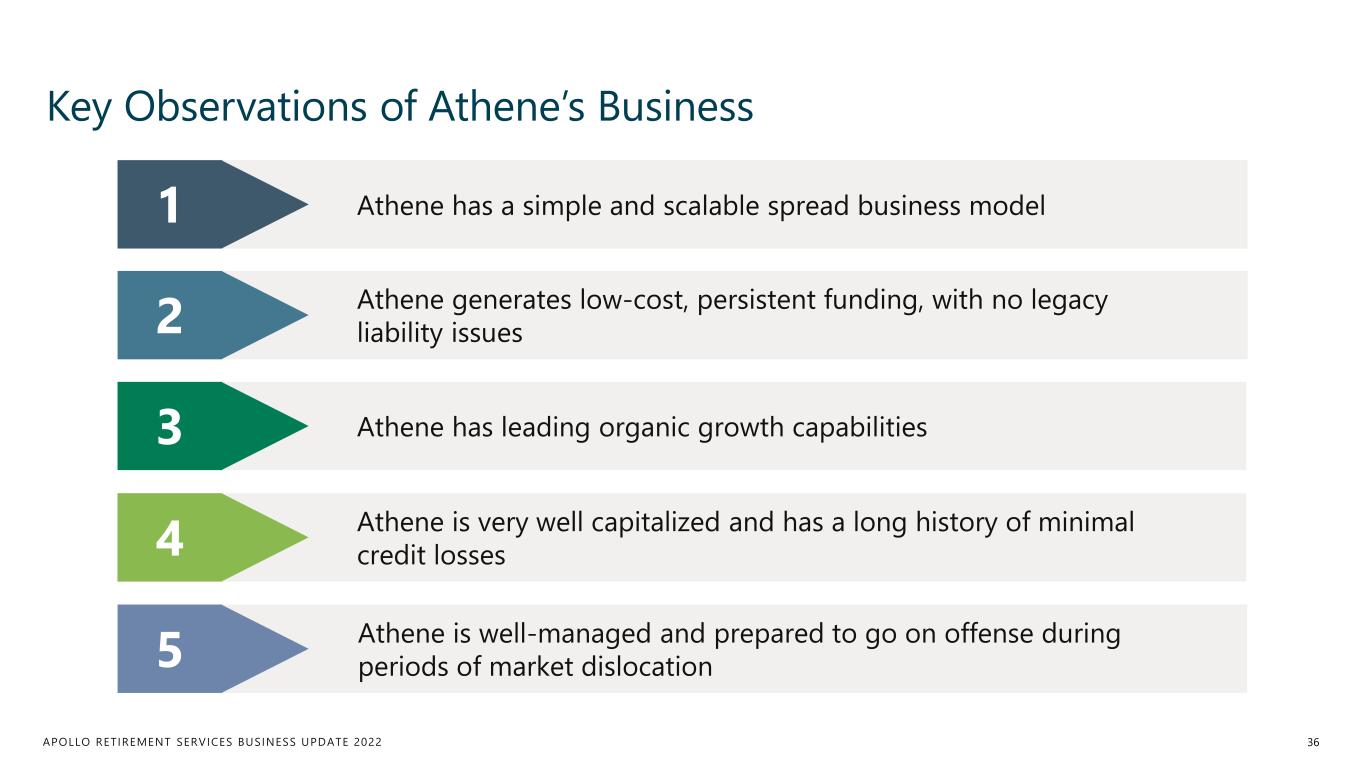
APOLLO RETIREMENT SERVICES BUSINESS UPDATE 2022 Key Observations of Athene’s Business 36 Athene has a simple and scalable spread business model 1 2 Athene generates low-cost, persistent funding, with no legacy liability issues 3 Athene has leading organic growth capabilities 4 Athene is very well capitalized and has a long history of minimal credit losses 5 Athene is well-managed and prepared to go on offense during periods of market dislocation
Growth Engine GRANT KVALHEIM President & USA Chief Executive Officer, Athene
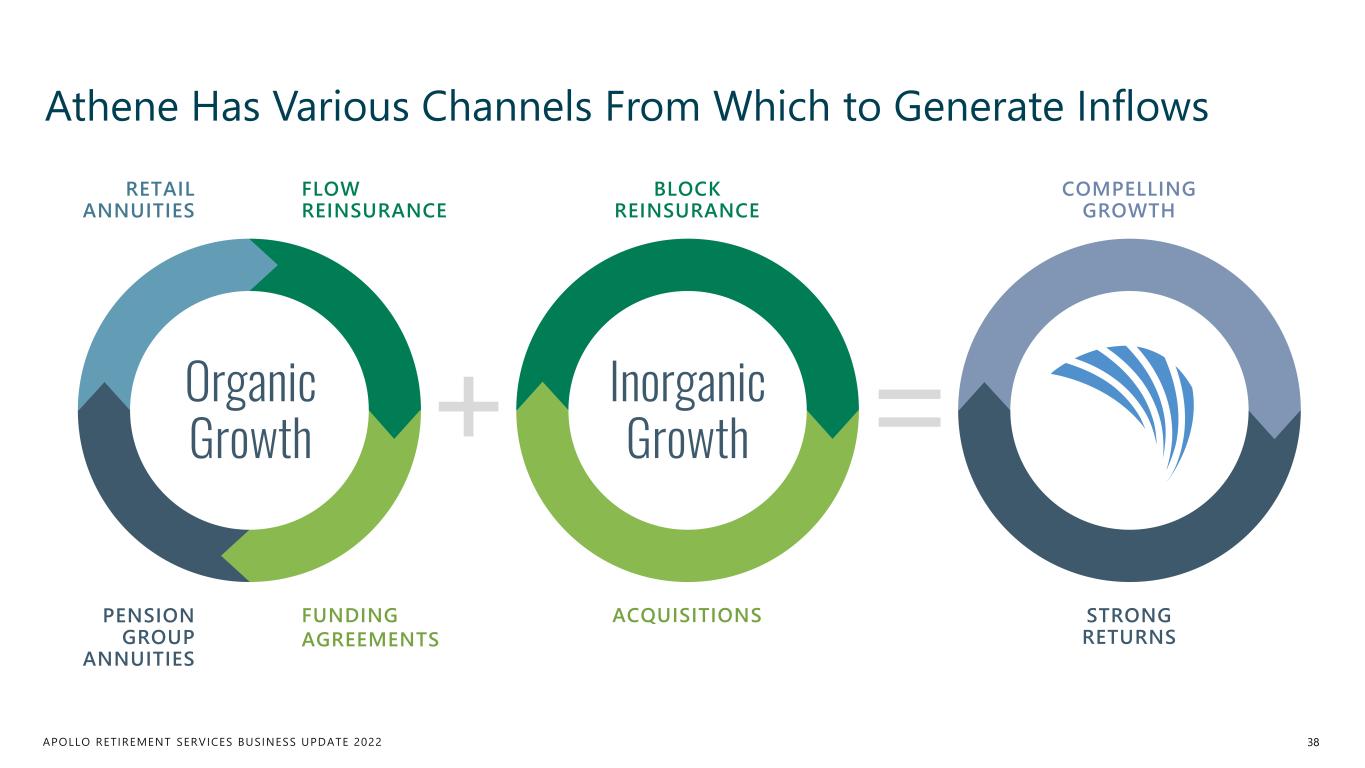
APOLLO RETIREMENT SERVICES BUSINESS UPDATE 2022 FLOW REINSURANCE FUNDING AGREEMENTS Athene Has Various Channels From Which to Generate Inflows 38 Organic Growth RETAIL ANNUITIES PENSION GROUP ANNUITIES Inorganic Growth BLOCK REINSURANCE ACQUISITIONS COMPELLING GROWTH STRONG RETURNS
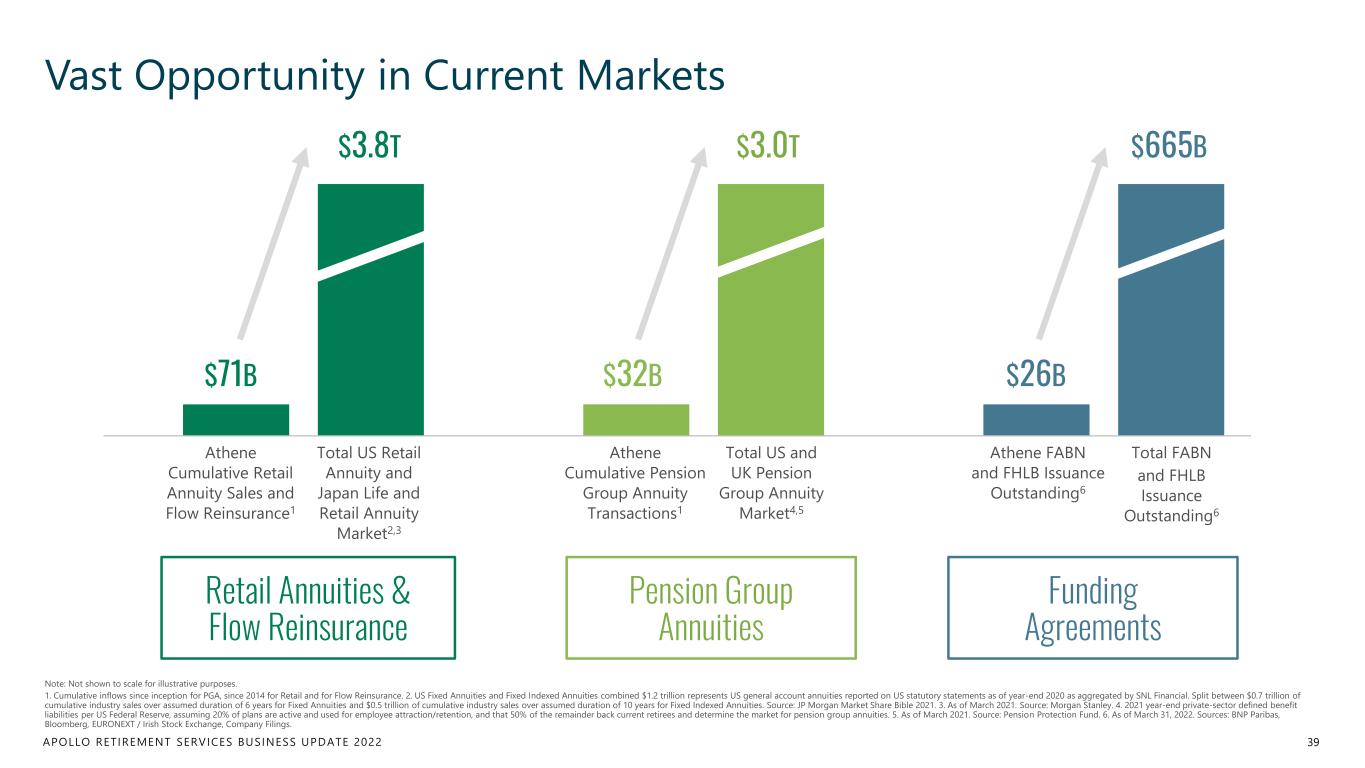
APOLLO RETIREMENT SERVICES BUSINESS UPDATE 2022 Vast Opportunity in Current Markets 39 Note: Not shown to scale for illustrative purposes. 1. Cumulative inflows since inception for PGA, since 2014 for Retail and for Flow Reinsurance. 2. US Fixed Annuities and Fixed Indexed Annuities combined $1.2 trillion represents US general account annuities reported on US statutory statements as of year-end 2020 as aggregated by SNL Financial. Split between $0.7 trillion of cumulative industry sales over assumed duration of 6 years for Fixed Annuities and $0.5 trillion of cumulative industry sales over assumed duration of 10 years for Fixed Indexed Annuities. Source: JP Morgan Market Share Bible 2021. 3. As of March 2021. Source: Morgan Stanley. 4. 2021 year-end private-sector defined benefit liabilities per US Federal Reserve, assuming 20% of plans are active and used for employee attraction/retention, and that 50% of the remainder back current retirees and determine the market for pension group annuities. 5. As of March 2021. Source: Pension Protection Fund. 6. As of March 31, 2022. Sources: BNP Paribas, Bloomberg, EURONEXT / Irish Stock Exchange, Company Filings. $665B $26B $3.0T $32B$71B $3.8T Total FABN and FHLB Issuance Outstanding6 Athene FABN and FHLB Issuance Outstanding6 Athene Cumulative Pension Group Annuity Transactions1 Total US and UK Pension Group Annuity Market4,5 Athene Cumulative Retail Annuity Sales and Flow Reinsurance1 Total US Retail Annuity and Japan Life and Retail Annuity Market2,3 Retail Annuities & Flow Reinsurance Pension Group Annuities Funding Agreements
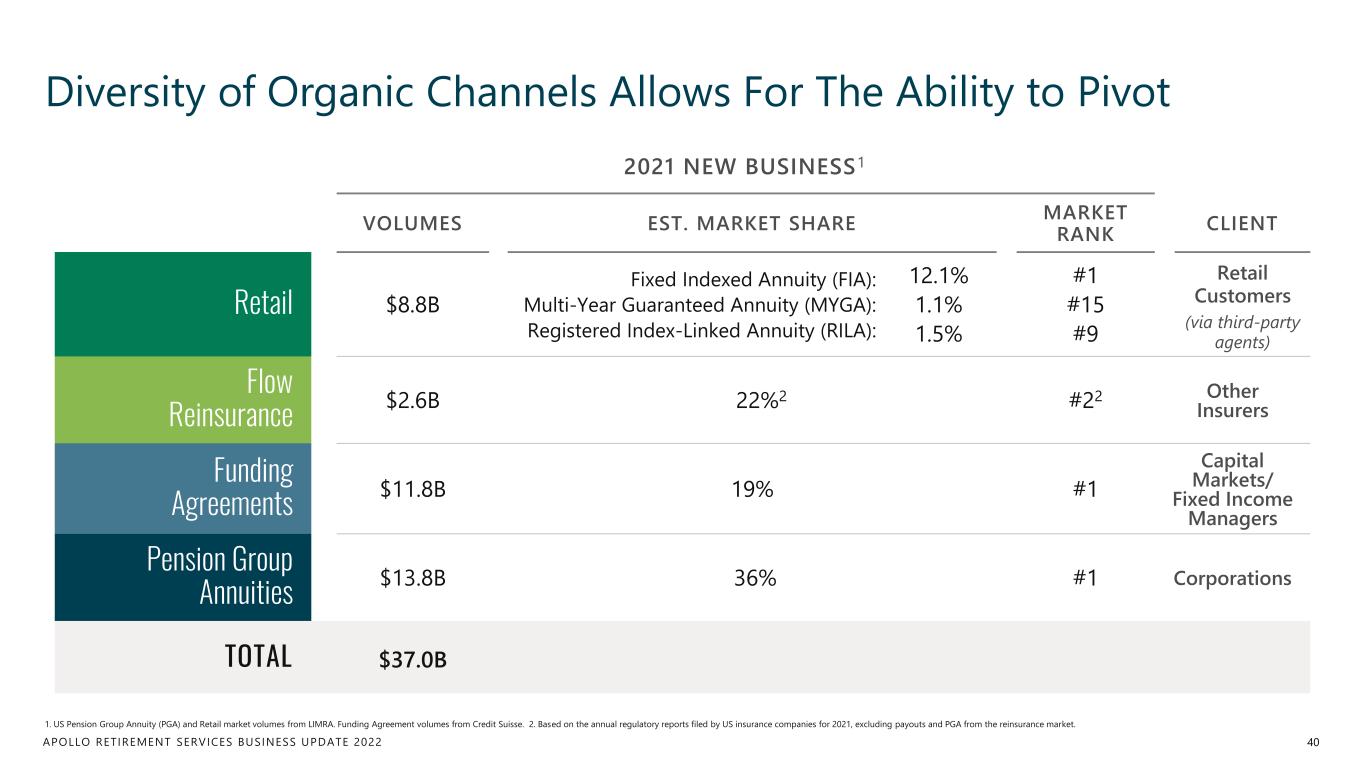
APOLLO RETIREMENT SERVICES BUSINESS UPDATE 2022 Diversity of Organic Channels Allows For The Ability to Pivot 40 1. US Pension Group Annuity (PGA) and Retail market volumes from LIMRA. Funding Agreement volumes from Credit Suisse. 2. Based on the annual regulatory reports filed by US insurance companies for 2021, excluding payouts and PGA from the reinsurance market. VOLUMES EST. MARKET SHARE MARKET RANK CLIENT Retail $8.8B Fixed Indexed Annuity (FIA): Multi-Year Guaranteed Annuity (MYGA): Registered Index-Linked Annuity (RILA): 12.1% 1.1% 1.5% #1 #15 #9 Retail Customers (via third-party agents) Flow Reinsurance $2.6B 22%2 #22 Other Insurers Funding Agreements $11.8B 19% #1 Capital Markets/ Fixed Income Managers Pension Group Annuities $13.8B 36% #1 Corporations TOTAL $37.0B 2021 NEW BUSINESS1
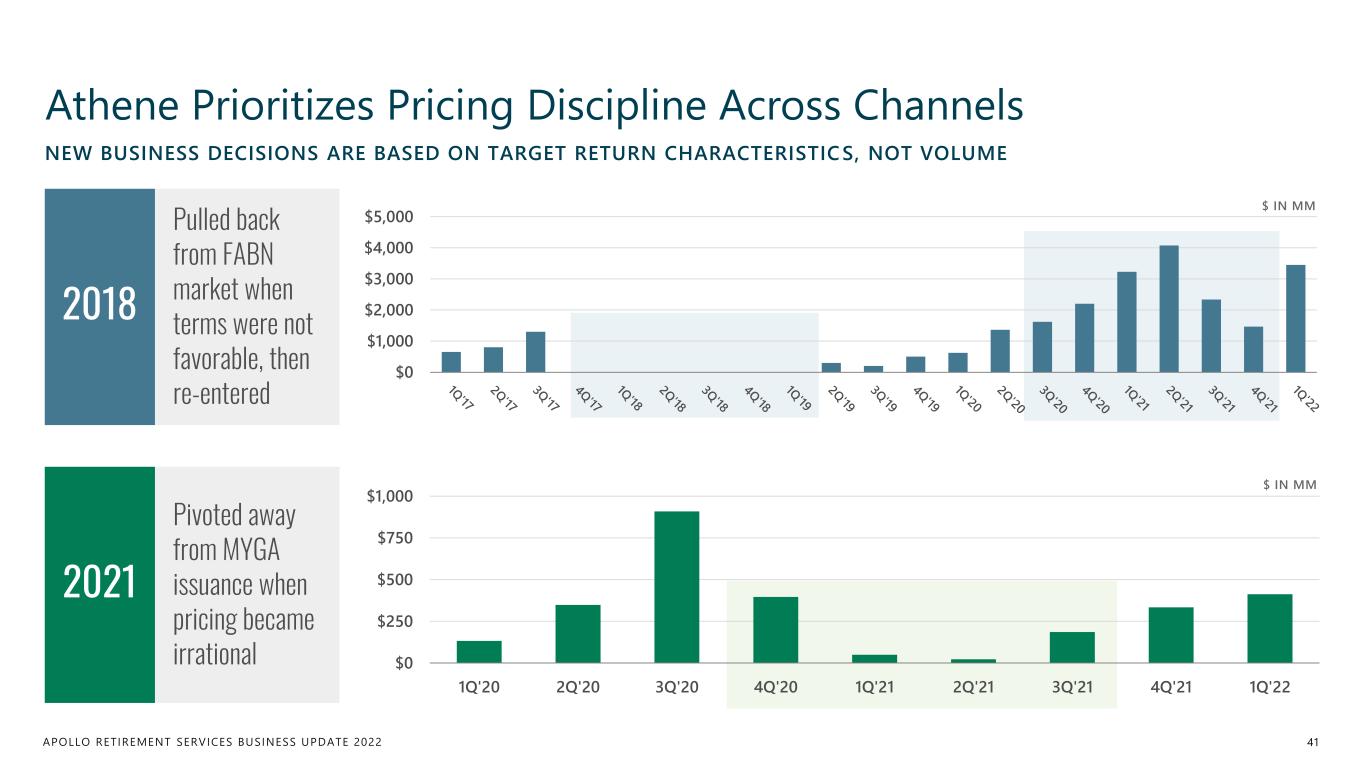
APOLLO RETIREMENT SERVICES BUSINESS UPDATE 2022 $0 $1,000 $2,000 $3,000 $4,000 $5,000 NEW BUSINESS DECISIONS ARE BASED ON TARGET RETURN CHARACTERISTIC S, NOT VOLUME Athene Prioritizes Pricing Discipline Across Channels 41 $0 $250 $500 $750 $1,000 1Q'20 2Q'20 3Q'20 4Q'20 1Q'21 2Q'21 3Q'21 4Q'21 1Q'22 2018 $ IN MM $ IN MM Pulled back from FABN market when terms were not favorable, then re-entered 2021 Pivoted away from MYGA issuance when pricing became irrational
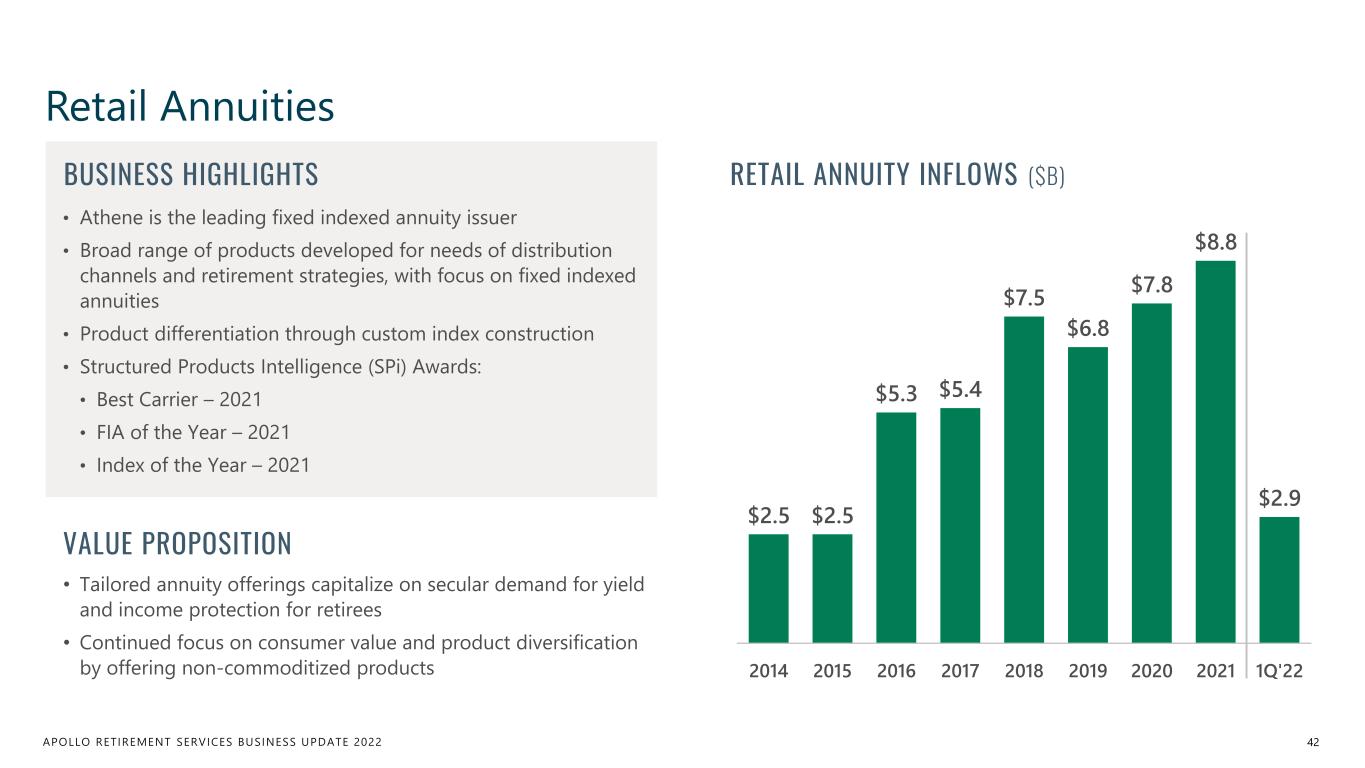
APOLLO RETIREMENT SERVICES BUSINESS UPDATE 2022 Retail Annuities 42 $2.5 $2.5 $5.3 $5.4 $7.5 $6.8 $7.8 $8.8 $2.9 2014 2015 2016 2017 2018 2019 2020 2021 1Q'22 VALUE PROPOSITION • Tailored annuity offerings capitalize on secular demand for yield and income protection for retirees • Continued focus on consumer value and product diversification by offering non-commoditized products BUSINESS HIGHLIGHTS • Athene is the leading fixed indexed annuity issuer • Broad range of products developed for needs of distribution channels and retirement strategies, with focus on fixed indexed annuities • Product differentiation through custom index construction • Structured Products Intelligence (SPi) Awards: • Best Carrier – 2021 • FIA of the Year – 2021 • Index of the Year – 2021 RETAIL ANNUITY INFLOWS ($B)
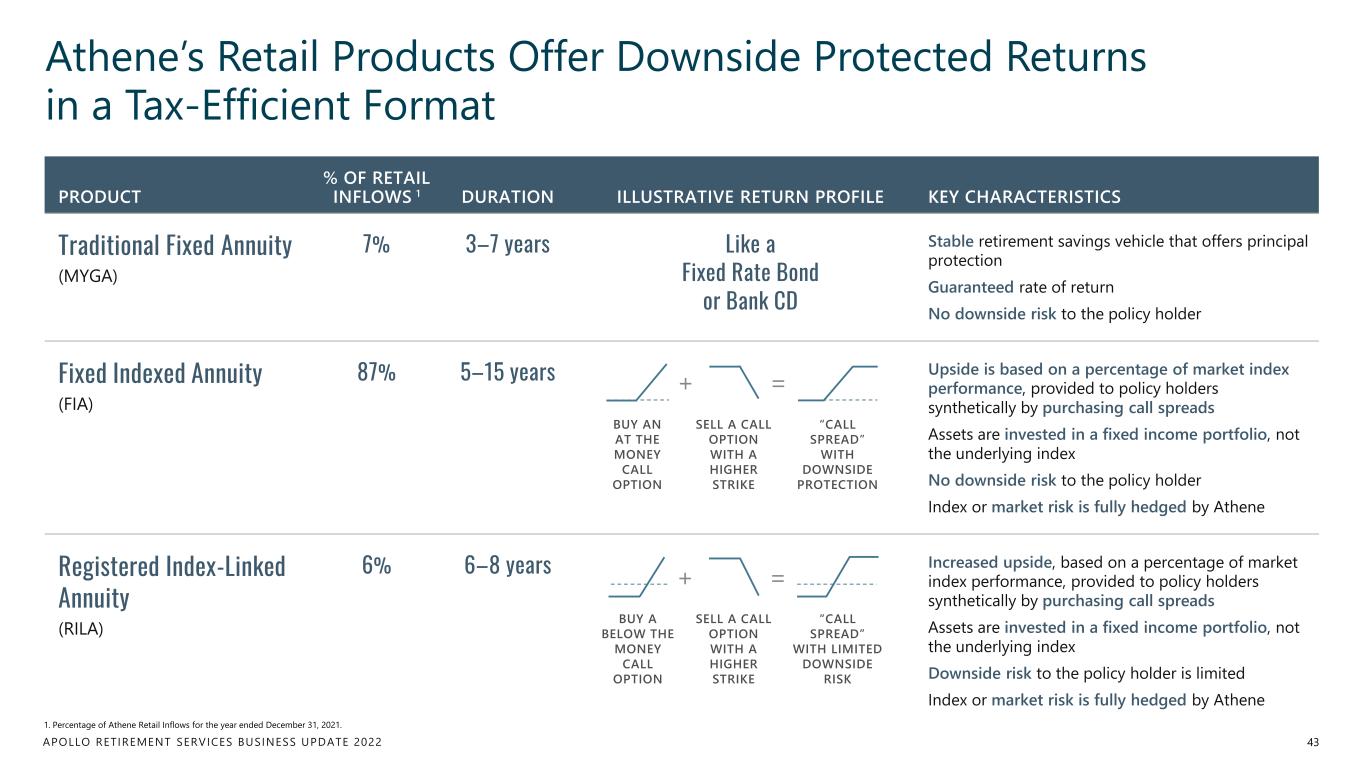
APOLLO RETIREMENT SERVICES BUSINESS UPDATE 2022 PRODUCT % OF RETAIL INFLOWS 1 DURATION ILLUSTRATIVE RETURN PROFILE KEY CHARACTERISTICS Traditional Fixed Annuity (MYGA) 7% 3–7 years Like a Fixed Rate Bond or Bank CD Stable retirement savings vehicle that offers principal protection Guaranteed rate of return No downside risk to the policy holder Fixed Indexed Annuity (FIA) 87% 5–15 years Upside is based on a percentage of market index performance, provided to policy holders synthetically by purchasing call spreads Assets are invested in a fixed income portfolio, not the underlying index No downside risk to the policy holder Index or market risk is fully hedged by Athene Registered Index-Linked Annuity (RILA) 6% 6–8 years Increased upside, based on a percentage of market index performance, provided to policy holders synthetically by purchasing call spreads Assets are invested in a fixed income portfolio, not the underlying index Downside risk to the policy holder is limited Index or market risk is fully hedged by Athene Athene’s Retail Products Offer Downside Protected Returns in a Tax-Efficient Format 43 1. Percentage of Athene Retail Inflows for the year ended December 31, 2021. SELL A CALL OPTION WITH A HIGHER STRIKE BUY AN AT THE MONEY CALL OPTION “CALL SPREAD” WITH DOWNSIDE PROTECTION + = + SELL A CALL OPTION WITH A HIGHER STRIKE = BUY A BELOW THE MONEY CALL OPTION “CALL SPREAD” WITH LIMITED DOWNSIDE RISK
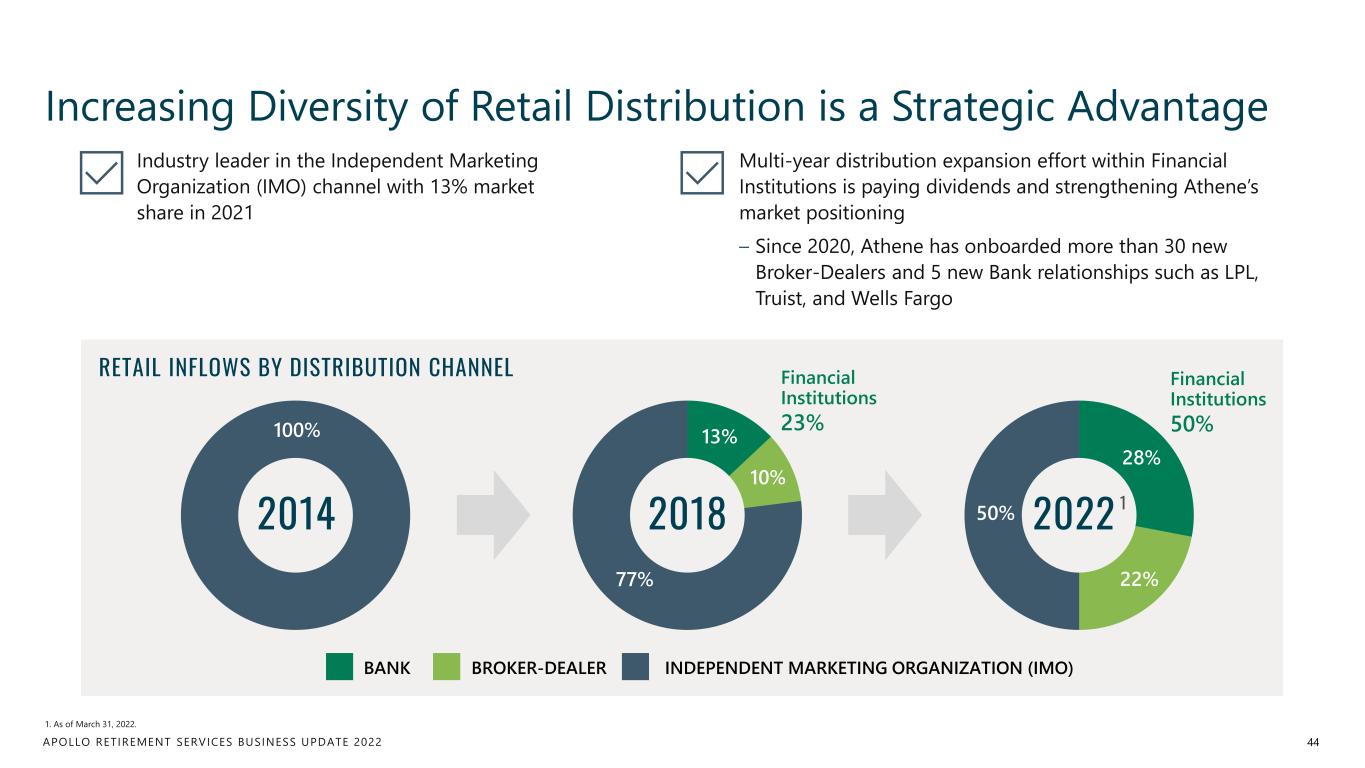
APOLLO RETIREMENT SERVICES BUSINESS UPDATE 2022 Increasing Diversity of Retail Distribution is a Strategic Advantage RETAIL INFLOWS BY DISTRIBUTION CHANNEL Industry leader in the Independent Marketing Organization (IMO) channel with 13% market share in 2021 1. As of March 31, 2022. 44 Multi-year distribution expansion effort within Financial Institutions is paying dividends and strengthening Athene’s market positioning – Since 2020, Athene has onboarded more than 30 new Broker-Dealers and 5 new Bank relationships such as LPL, Truist, and Wells Fargo 2018 2022 1 Financial Institutions 23% Financial Institutions 50% 2014 100% 13% 10% 77% 28% 22% 50% BANK INDEPENDENT MARKETING ORGANIZATION (IMO)BROKER-DEALER

APOLLO RETIREMENT SERVICES BUSINESS UPDATE 2022 BUSINESS HIGHLIGHTS & KEY DRIVERS • Grew to be the market leader in 2020 and 2021 • Through several signature transactions, Athene has become a partner of choice for blue-chip corporate pension plan sponsors • Driven by long-term secular shift by corporations away from managing pension assets internally • Provides simplicity and consistent income to retirees while offering increased efficiency to corporations and plan sponsors Pension Group Annuities 45 $2.2 $2.6 $6.0 $5.4 $13.8 $2.0 2017 2018 2019 2020 2021 1Q'22 WHAT IS A PENSION GROUP ANNUITY? Occurs when a defined benefit pension plan sponsor transfers some or all of the plan’s liabilities to a highly rated insurer That company issues a group (“bulk”) annuity which provides benefit continuity for all the pensioners within the plan 1 2 PENSION GROUP ANNUITY INFLOWS ($B)
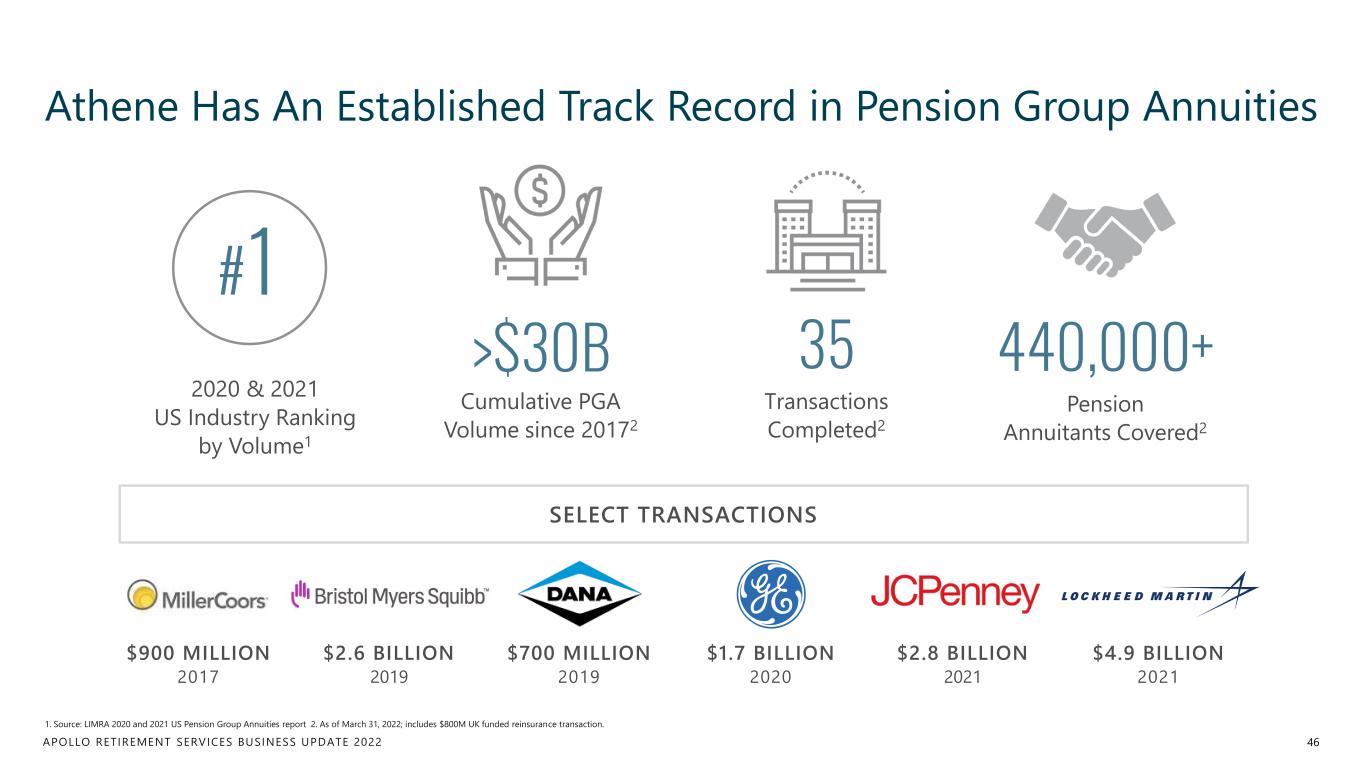
APOLLO RETIREMENT SERVICES BUSINESS UPDATE 2022 Athene Has An Established Track Record in Pension Group Annuities SELECT TRANSACTIONS 1. Source: LIMRA 2020 and 2021 US Pension Group Annuities report 2. As of March 31, 2022; includes $800M UK funded reinsurance transaction. 46 Pension Annuitants Covered2 >$30B 35 440,000+ Cumulative PGA Volume since 20172 Transactions Completed2 2020 & 2021 US Industry Ranking by Volume1 #1 $2.6 BILLION 2019 $2.8 BILLION 2021 $900 MILLION 2017 $4.9 BILLION 2021 $1.7 BILLION 2020 $700 MILLION 2019
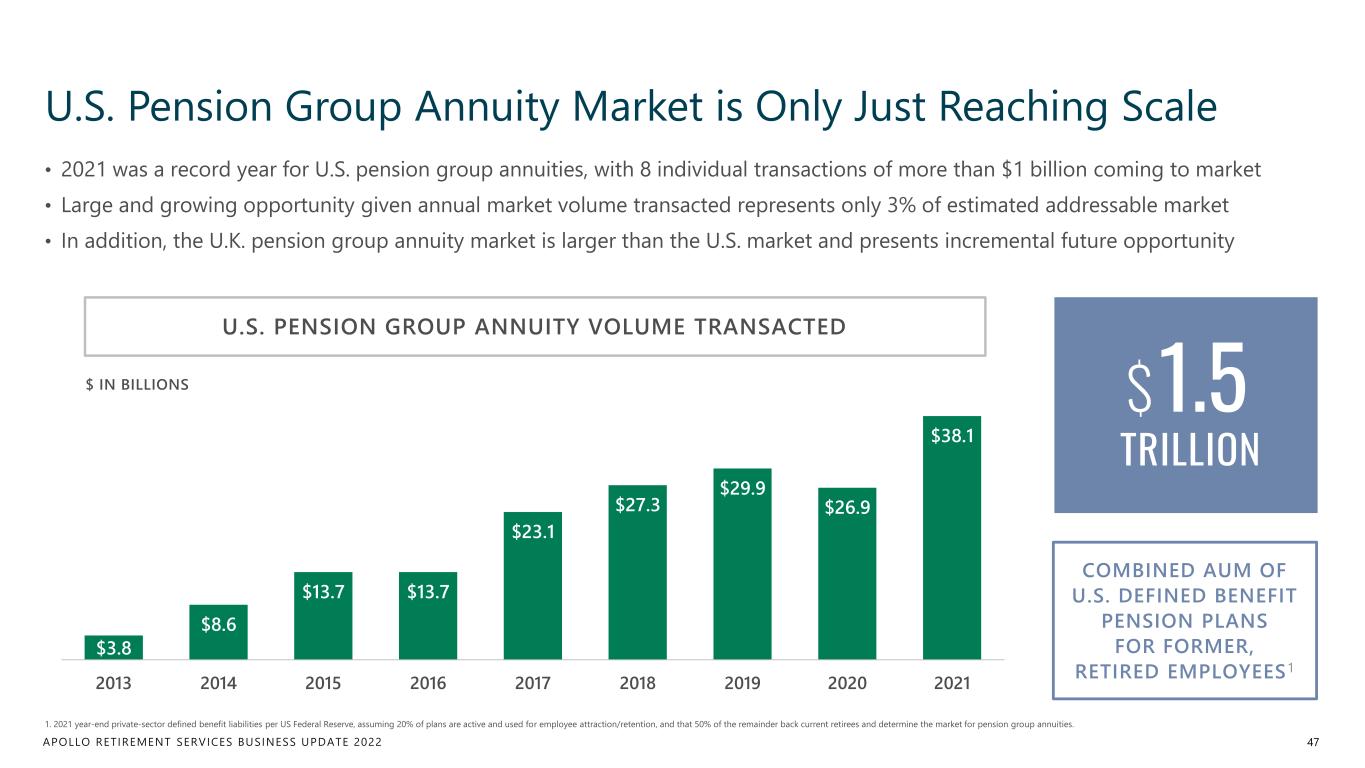
APOLLO RETIREMENT SERVICES BUSINESS UPDATE 2022 U.S. Pension Group Annuity Market is Only Just Reaching Scale 47 1. 2021 year-end private-sector defined benefit liabilities per US Federal Reserve, assuming 20% of plans are active and used for employee attraction/retention, and that 50% of the remainder back current retirees and determine the market for pension group annuities. $3.8 $8.6 $13.7 $13.7 $23.1 $27.3 $29.9 $26.9 $38.1 2013 2014 2015 2016 2017 2018 2019 2020 2021 $ IN BILLIONS U.S. PENSION GROUP ANNUITY VOLUME TRANSACTED COMBINED AUM OF U.S. DEFINED BENEFIT PENSION PLANS FOR FORMER, RETIRED EMPLOYEES1 • 2021 was a record year for U.S. pension group annuities, with 8 individual transactions of more than $1 billion coming to market • Large and growing opportunity given annual market volume transacted represents only 3% of estimated addressable market • In addition, the U.K. pension group annuity market is larger than the U.S. market and presents incremental future opportunity $1.5 TRILLION
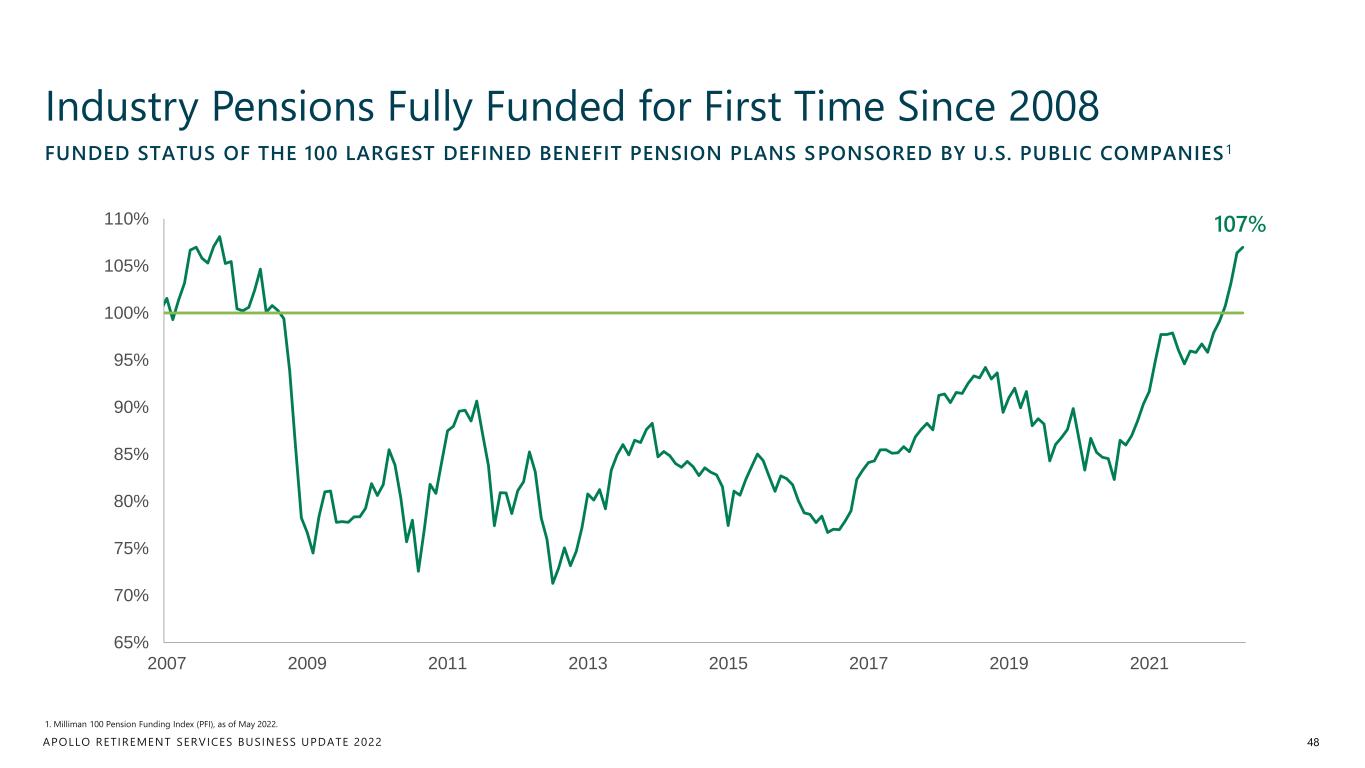
APOLLO RETIREMENT SERVICES BUSINESS UPDATE 2022 Industry Pensions Fully Funded for First Time Since 2008 48 1. Milliman 100 Pension Funding Index (PFI), as of May 2022. FUNDED STATUS OF THE 100 LARGEST DEFINED BENEFIT PENSION PLANS SPONSORED BY U.S. PUBLIC COMPANIES1 107% 65% 70% 75% 80% 85% 90% 95% 100% 105% 110% 2007 2009 2011 2013 2015 2017 2019 2021
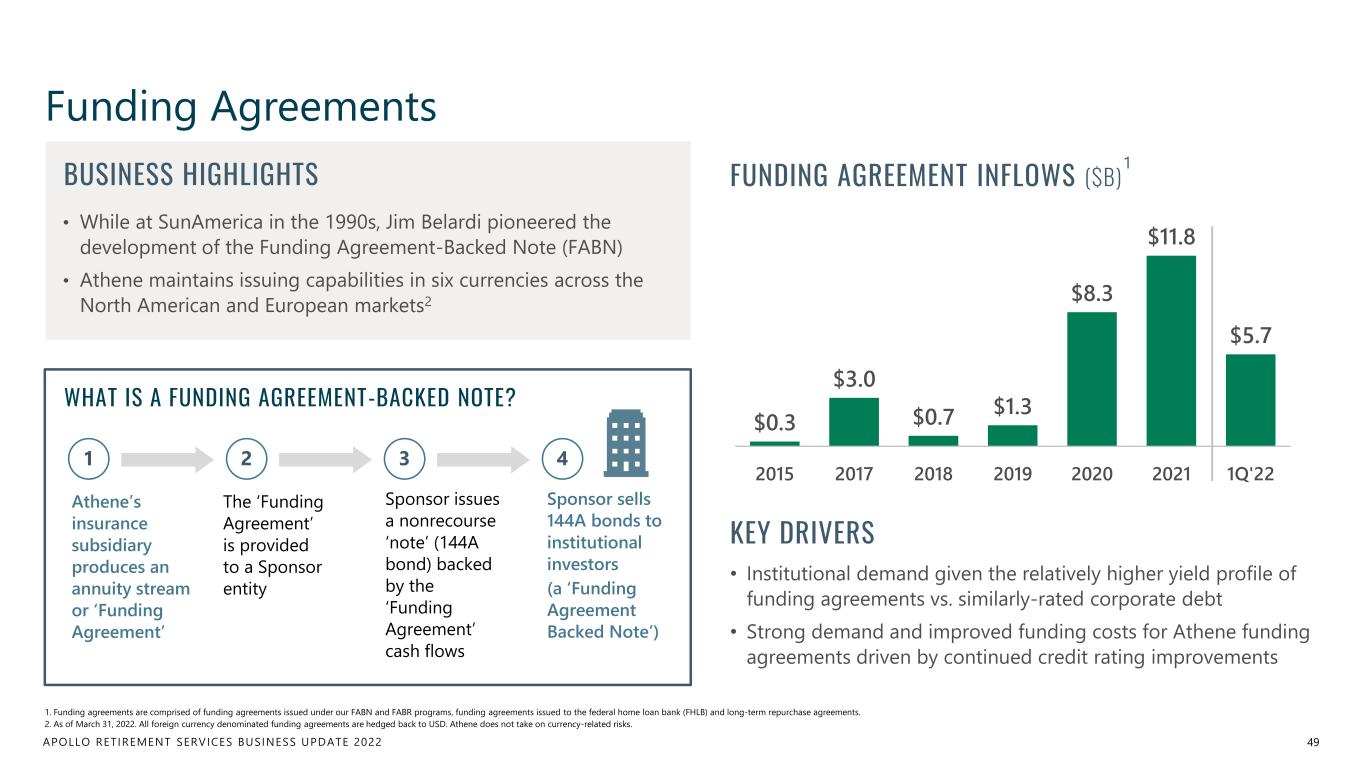
APOLLO RETIREMENT SERVICES BUSINESS UPDATE 2022 BUSINESS HIGHLIGHTS • While at SunAmerica in the 1990s, Jim Belardi pioneered the development of the Funding Agreement-Backed Note (FABN) • Athene maintains issuing capabilities in six currencies across the North American and European markets2 Funding Agreements 49 1. Funding agreements are comprised of funding agreements issued under our FABN and FABR programs, funding agreements issued to the federal home loan bank (FHLB) and long-term repurchase agreements. 2. As of March 31, 2022. All foreign currency denominated funding agreements are hedged back to USD. Athene does not take on currency-related risks. $0.3 $3.0 $0.7 $1.3 $8.3 $11.8 $5.7 2015 2017 2018 2019 2020 2021 1Q'22 FUNDING AGREEMENT INFLOWS ($B) 1 KEY DRIVERS • Institutional demand given the relatively higher yield profile of funding agreements vs. similarly-rated corporate debt • Strong demand and improved funding costs for Athene funding agreements driven by continued credit rating improvements WHAT IS A FUNDING AGREEMENT-BACKED NOTE? The ‘Funding Agreement’ is provided to a Sponsor entity 21 Athene’s insurance subsidiary produces an annuity stream or ‘Funding Agreement’ Sponsor issues a nonrecourse ‘note’ (144A bond) backed by the ‘Funding Agreement’ cash flows 3 Sponsor sells 144A bonds to institutional investors (a ‘Funding Agreement Backed Note’) 4
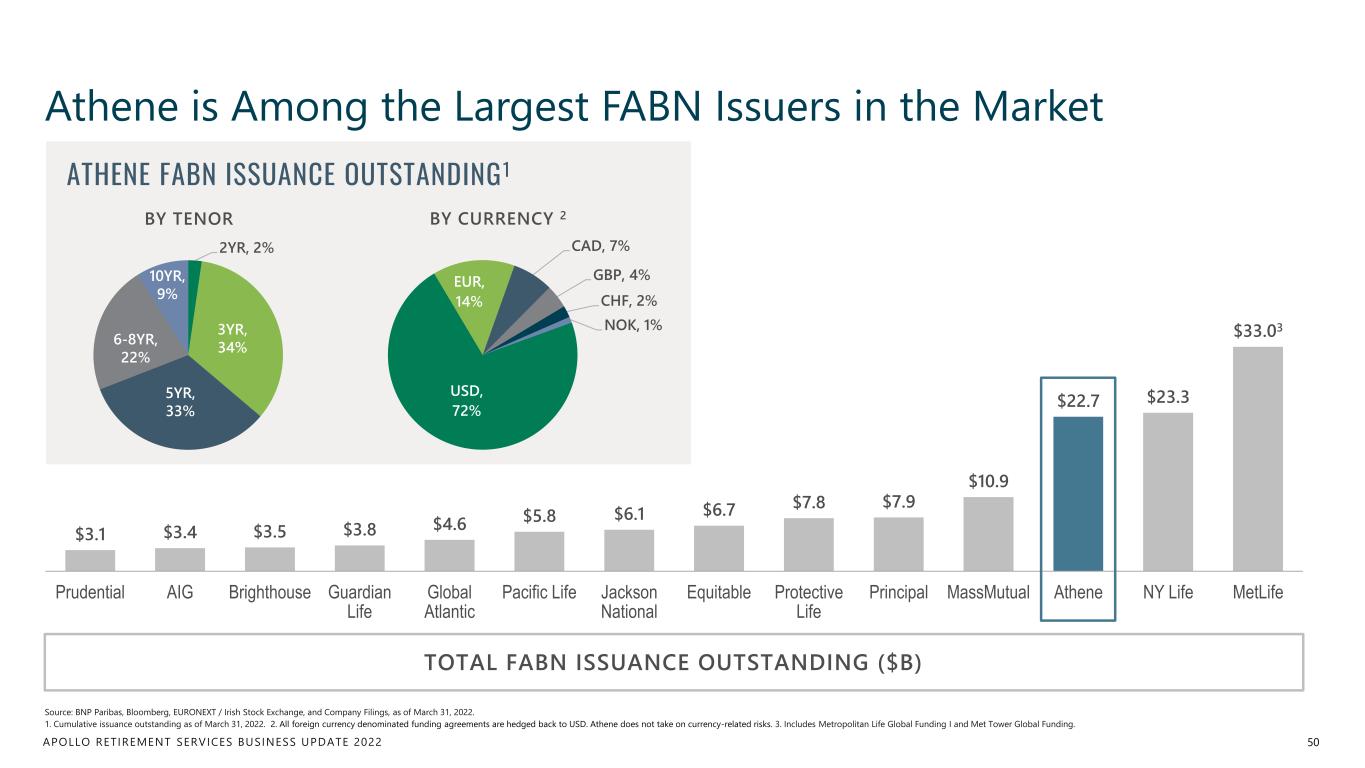
APOLLO RETIREMENT SERVICES BUSINESS UPDATE 2022 $3.1 $3.4 $3.5 $3.8 $4.6 $5.8 $6.1 $6.7 $7.8 $7.9 $10.9 $22.7 $23.3 $33.03 Prudential AIG Brighthouse Guardian Life Global Atlantic Pacific Life Jackson National Equitable Protective Life Principal MassMutual Athene NY Life MetLife TOTAL FABN ISSUANCE OUTSTANDING ($B) Athene is Among the Largest FABN Issuers in the Market 50 Source: BNP Paribas, Bloomberg, EURONEXT / Irish Stock Exchange, and Company Filings, as of March 31, 2022. 1. Cumulative issuance outstanding as of March 31, 2022. 2. All foreign currency denominated funding agreements are hedged back to USD. Athene does not take on currency-related risks. 3. Includes Metropolitan Life Global Funding I and Met Tower Global Funding. 2YR, 2% 3YR, 34% 5YR, 33% 6-8YR, 22% 10YR, 9% USD, 72% EUR, 14% CAD, 7% GBP, 4% CHF, 2% NOK, 1% BY TENOR BY CURRENCY 2 ATHENE FABN ISSUANCE OUTSTANDING1
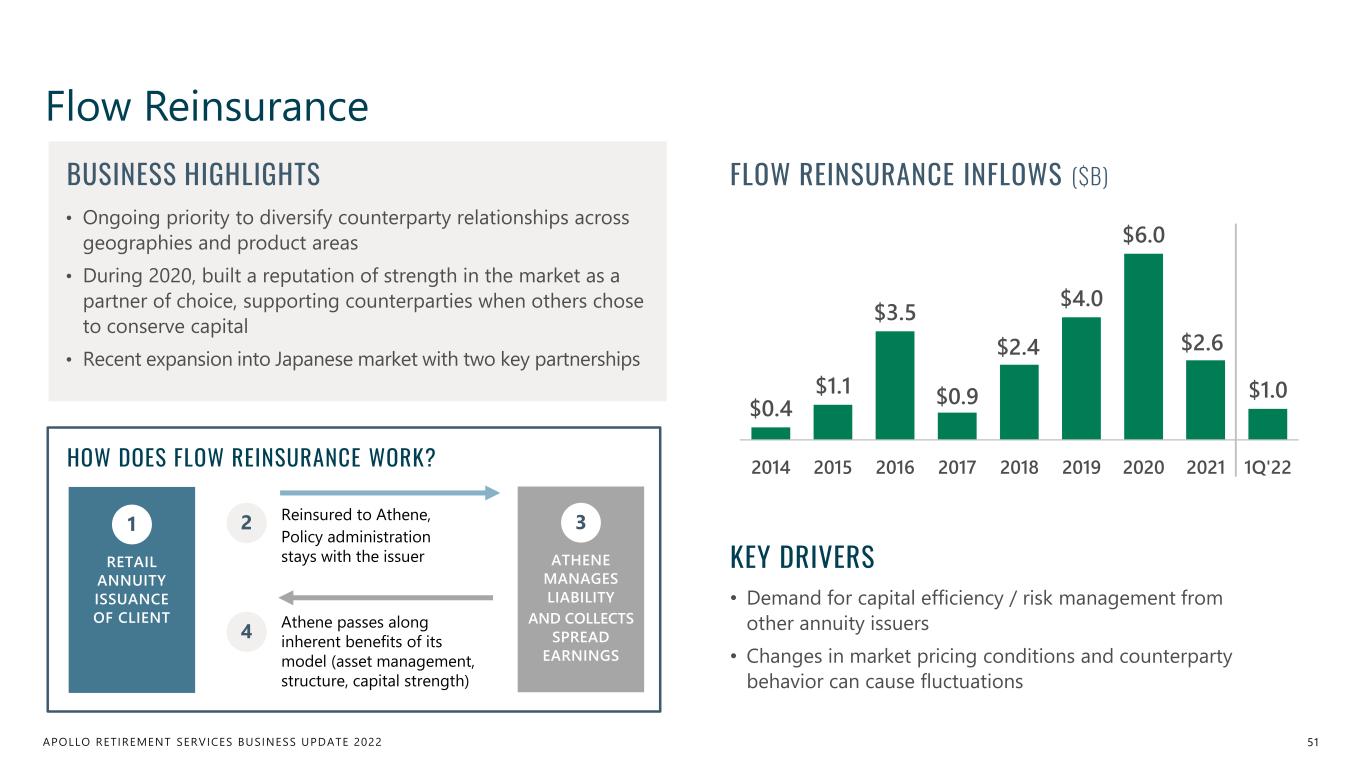
APOLLO RETIREMENT SERVICES BUSINESS UPDATE 2022 Flow Reinsurance 51 $0.4 $1.1 $3.5 $0.9 $2.4 $4.0 $6.0 $2.6 $1.0 2014 2015 2016 2017 2018 2019 2020 2021 1Q'22 BUSINESS HIGHLIGHTS • Ongoing priority to diversify counterparty relationships across geographies and product areas • During 2020, built a reputation of strength in the market as a partner of choice, supporting counterparties when others chose to conserve capital • Recent expansion into Japanese market with two key partnerships FLOW REINSURANCE INFLOWS ($B) KEY DRIVERS • Demand for capital efficiency / risk management from other annuity issuers • Changes in market pricing conditions and counterparty behavior can cause fluctuations Reinsured to Athene, Policy administration stays with the issuer 2 Athene passes along inherent benefits of its model (asset management, structure, capital strength) 4 HOW DOES FLOW REINSURANCE WORK? 1 RETAIL ANNUITY ISSUANCE OF CLIENT 3 ATHENE MANAGES LIABILITY AND COLLECTS SPREAD EARNINGS
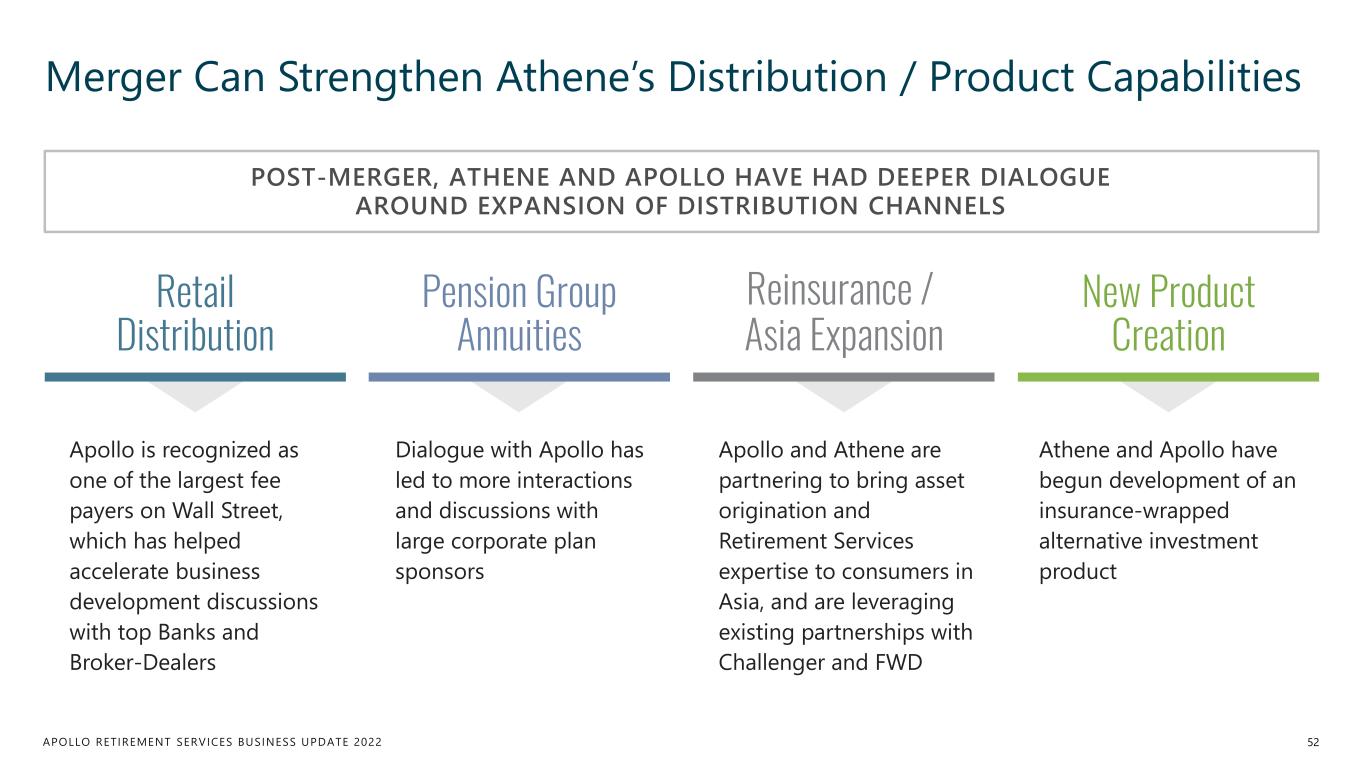
APOLLO RETIREMENT SERVICES BUSINESS UPDATE 2022 Merger Can Strengthen Athene’s Distribution / Product Capabilities 52 Apollo is recognized as one of the largest fee payers on Wall Street, which has helped accelerate business development discussions with top Banks and Broker-Dealers Dialogue with Apollo has led to more interactions and discussions with large corporate plan sponsors Apollo and Athene are partnering to bring asset origination and Retirement Services expertise to consumers in Asia, and are leveraging existing partnerships with Challenger and FWD Athene and Apollo have begun development of an insurance-wrapped alternative investment product Retail Distribution Pension Group Annuities Reinsurance / Asia Expansion New Product Creation POST-MERGER, ATHENE AND APOLLO HAVE HAD DEEPER DIALOGUE AROUND EXPANSION OF DISTRIBUTION CHANNELS
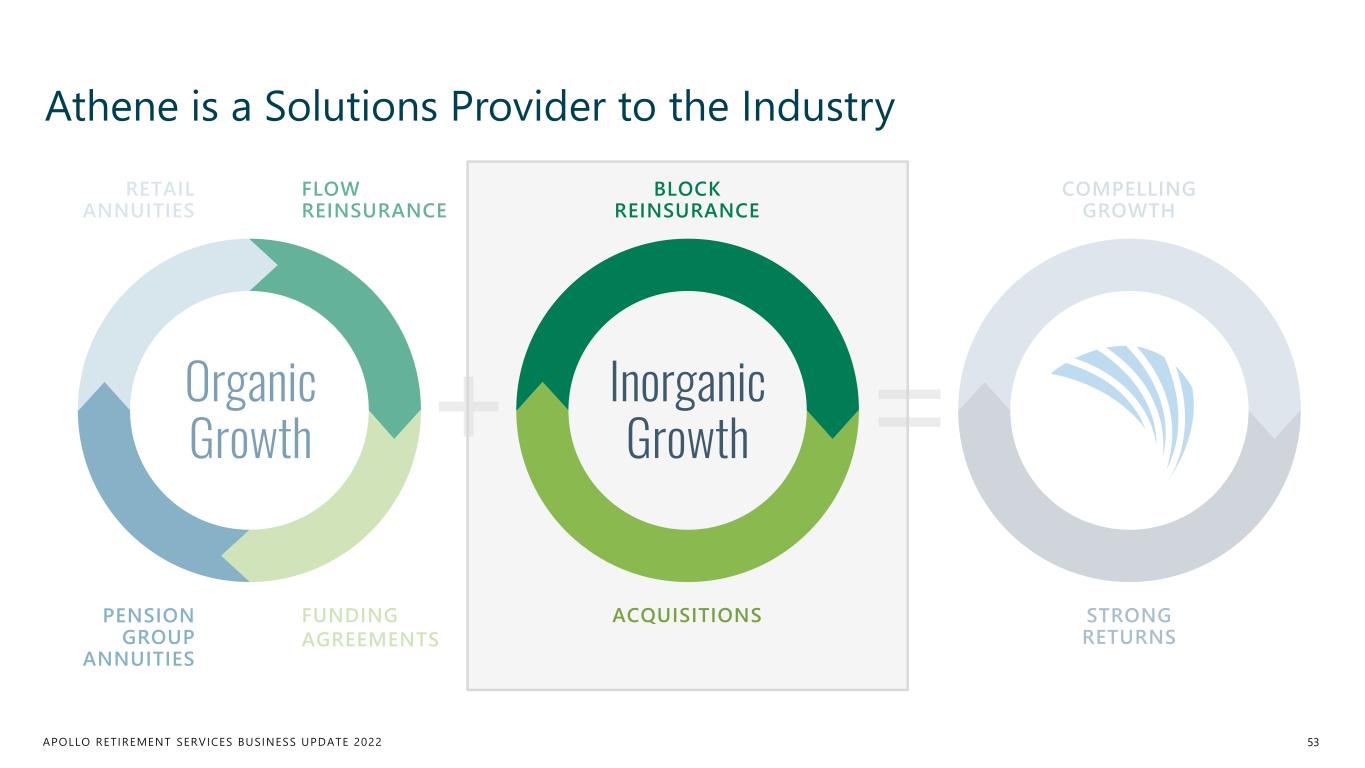
APOLLO RETIREMENT SERVICES BUSINESS UPDATE 2022 FLOW REINSURANCE FUNDING AGREEMENTS Athene is a Solutions Provider to the Industry 53 Organic Growth RETAIL ANNUITIES PENSION GROUP ANNUITIES Inorganic Growth BLOCK REINSURANCE ACQUISITIONS COMPELLING GROWTH STRONG RETURNS
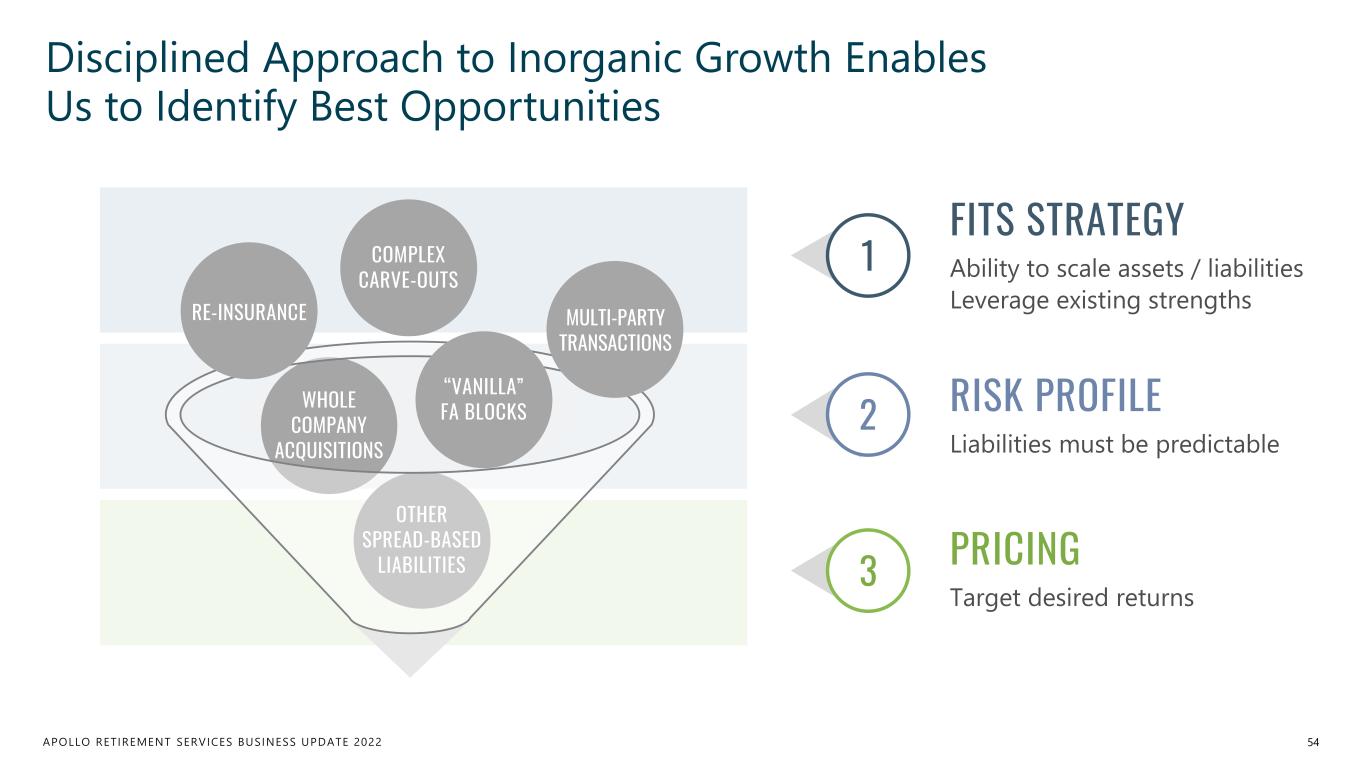
APOLLO RETIREMENT SERVICES BUSINESS UPDATE 2022 Disciplined Approach to Inorganic Growth Enables Us to Identify Best Opportunities 54 WHOLE COMPANY ACQUISITIONS OTHER SPREAD-BASED LIABILITIES RE-INSURANCE MULTI-PARTY TRANSACTIONS COMPLEX CARVE-OUTS “VANILLA” FA BLOCKS 1 FITS STRATEGY Ability to scale assets / liabilities Leverage existing strengths 2 RISK PROFILE Liabilities must be predictable PRICING Target desired returns 3
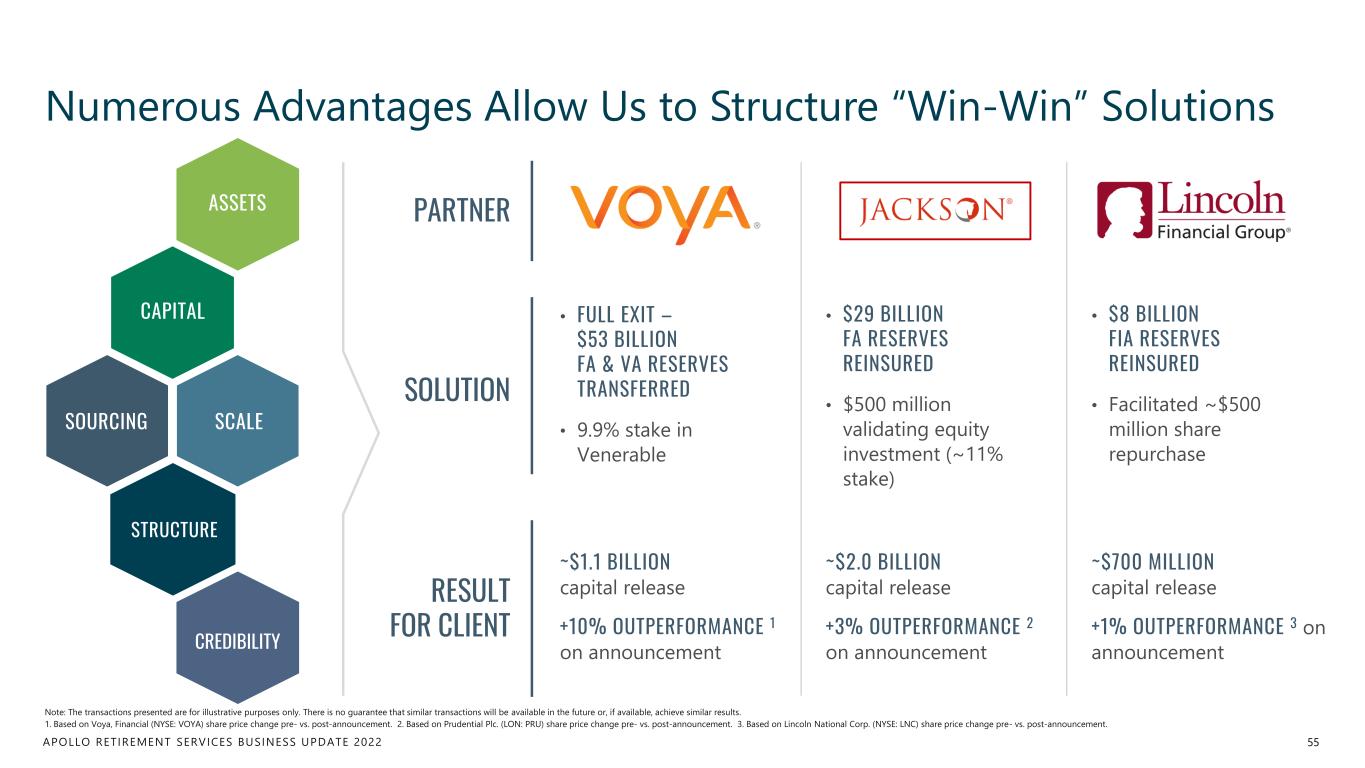
APOLLO RETIREMENT SERVICES BUSINESS UPDATE 2022 Numerous Advantages Allow Us to Structure “Win-Win” Solutions ASSETS CAPITAL SCALE STRUCTURE CREDIBILITY SOURCING 55 PARTNER • FULL EXIT – $53 BILLION FA & VA RESERVES TRANSFERRED • 9.9% stake in Venerable ~$1.1 BILLION capital release +10% OUTPERFORMANCE 1 on announcement SOLUTION RESULT FOR CLIENT • $29 BILLION FA RESERVES REINSURED • $500 million validating equity investment (~11% stake) ~$2.0 BILLION capital release +3% OUTPERFORMANCE 2 on announcement • $8 BILLION FIA RESERVES REINSURED • Facilitated ~$500 million share repurchase ~$700 MILLION capital release +1% OUTPERFORMANCE 3 on announcement Note: The transactions presented are for illustrative purposes only. There is no guarantee that similar transactions will be available in the future or, if available, achieve similar results. 1. Based on Voya, Financial (NYSE: VOYA) share price change pre- vs. post-announcement. 2. Based on Prudential Plc. (LON: PRU) share price change pre- vs. post-announcement. 3. Based on Lincoln National Corp. (NYSE: LNC) share price change pre- vs. post-announcement.
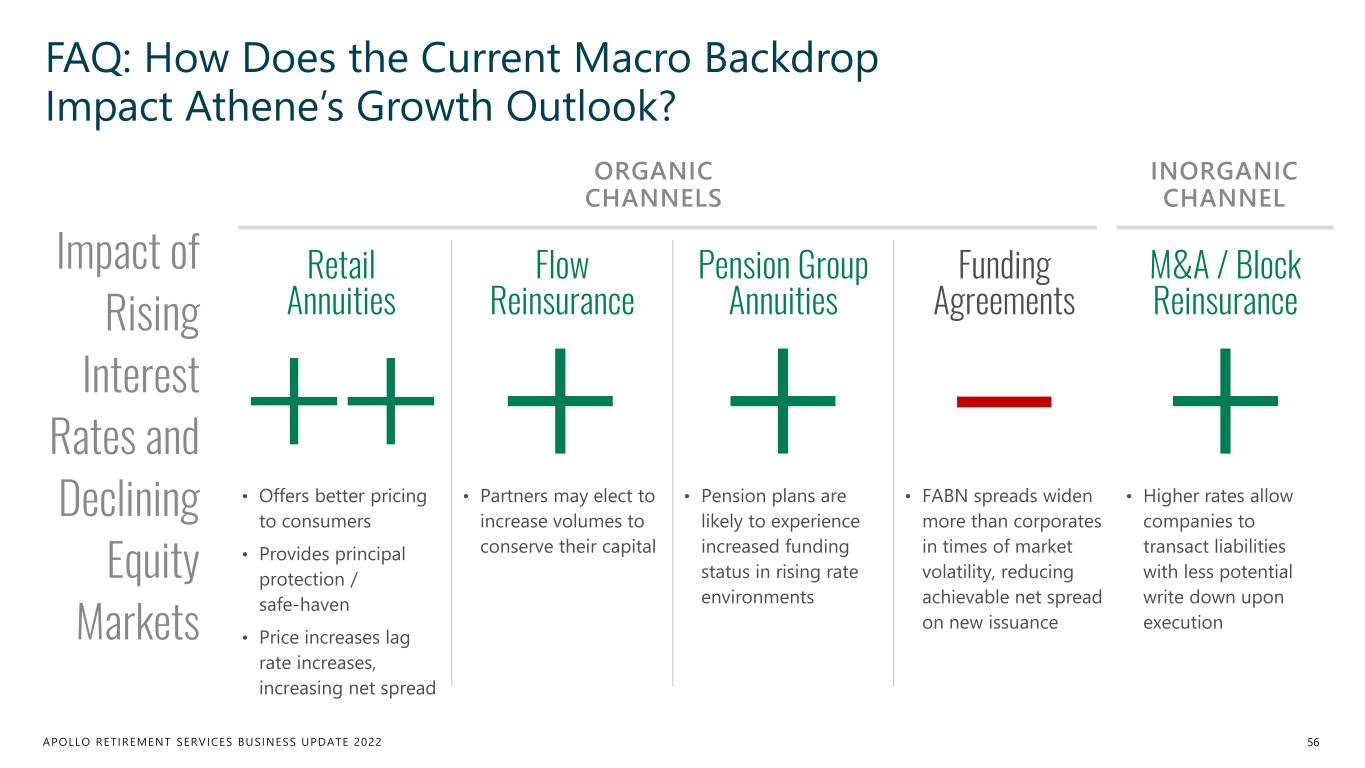
APOLLO RETIREMENT SERVICES BUSINESS UPDATE 2022 FAQ: How Does the Current Macro Backdrop Impact Athene’s Growth Outlook? Retail Annuities • Offers better pricing to consumers • Provides principal protection / safe-haven • Price increases lag rate increases, increasing net spread Flow Reinsurance • Partners may elect to increase volumes to conserve their capital Pension Group Annuities • Pension plans are likely to experience increased funding status in rising rate environments Funding Agreements • FABN spreads widen more than corporates in times of market volatility, reducing achievable net spread on new issuance Impact of Rising Interest Rates and Declining Equity Markets M&A / Block Reinsurance ORGANIC CHANNELS INORGANIC CHANNEL 56 • Higher rates allow companies to transact liabilities with less potential write down upon execution
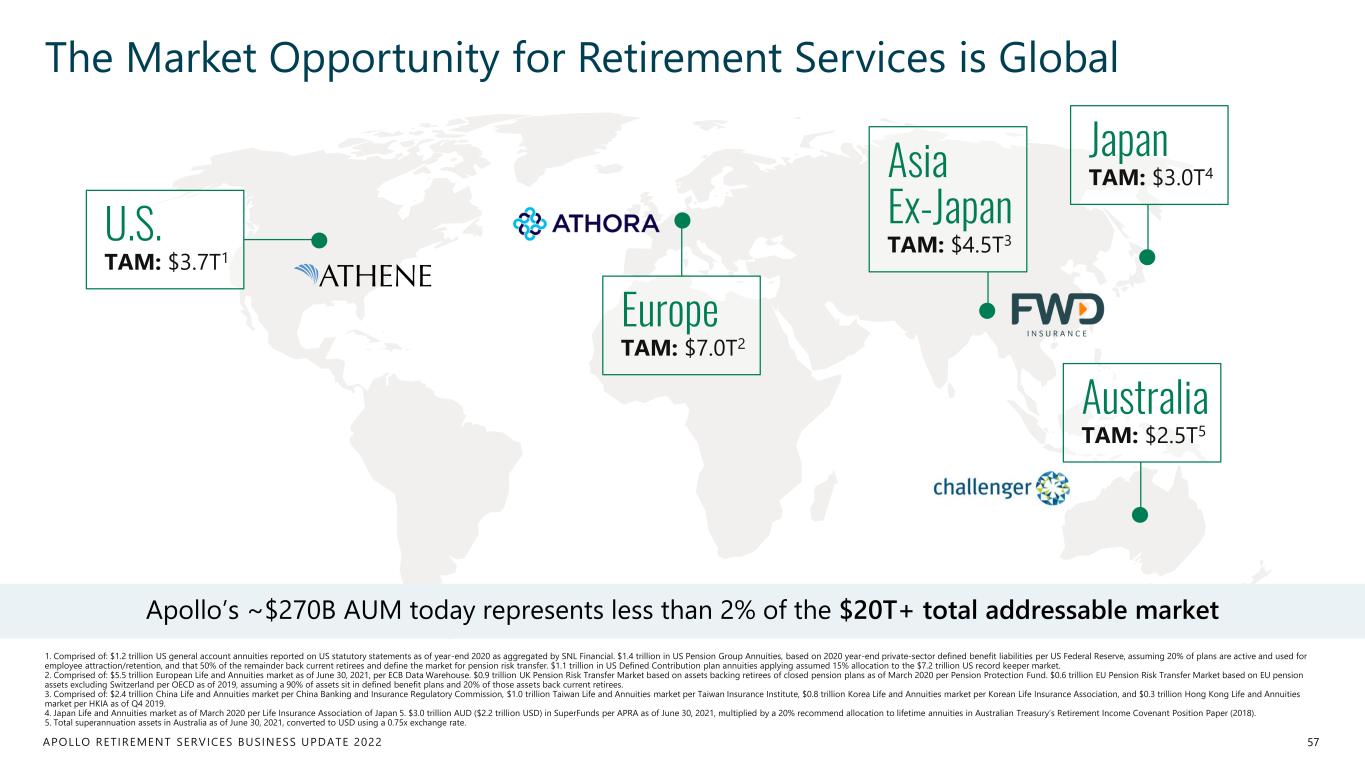
APOLLO RETIREMENT SERVICES BUSINESS UPDATE 2022 The Market Opportunity for Retirement Services is Global 57 1. Comprised of: $1.2 trillion US general account annuities reported on US statutory statements as of year-end 2020 as aggregated by SNL Financial. $1.4 trillion in US Pension Group Annuities, based on 2020 year-end private-sector defined benefit liabilities per US Federal Reserve, assuming 20% of plans are active and used for employee attraction/retention, and that 50% of the remainder back current retirees and define the market for pension risk transfer. $1.1 trillion in US Defined Contribution plan annuities applying assumed 15% allocation to the $7.2 trillion US record keeper market. 2. Comprised of: $5.5 trillion European Life and Annuities market as of June 30, 2021, per ECB Data Warehouse. $0.9 trillion UK Pension Risk Transfer Market based on assets backing retirees of closed pension plans as of March 2020 per Pension Protection Fund. $0.6 trillion EU Pension Risk Transfer Market based on EU pension assets excluding Switzerland per OECD as of 2019, assuming a 90% of assets sit in defined benefit plans and 20% of those assets back current retirees. 3. Comprised of: $2.4 trillion China Life and Annuities market per China Banking and Insurance Regulatory Commission, $1.0 trillion Taiwan Life and Annuities market per Taiwan Insurance Institute, $0.8 trillion Korea Life and Annuities market per Korean Life Insurance Association, and $0.3 trillion Hong Kong Life and Annuities market per HKIA as of Q4 2019. 4. Japan Life and Annuities market as of March 2020 per Life Insurance Association of Japan 5. $3.0 trillion AUD ($2.2 trillion USD) in SuperFunds per APRA as of June 30, 2021, multiplied by a 20% recommend allocation to lifetime annuities in Australian Treasury’s Retirement Income Covenant Position Paper (2018). 5. Total superannuation assets in Australia as of June 30, 2021, converted to USD using a 0.75x exchange rate. U.S. TAM: $3.7T1 Europe TAM: $7.0T2 Japan TAM: $3.0T4Asia Ex-Japan TAM: $4.5T3 Australia TAM: $2.5T5 Apollo’s ~$270B AUM today represents less than 2% of the $20T+ total addressable market

Liability Underwriting & Risk Profile MIKE DOWNING Chief Operating Officer & Chief Actuary, Athene
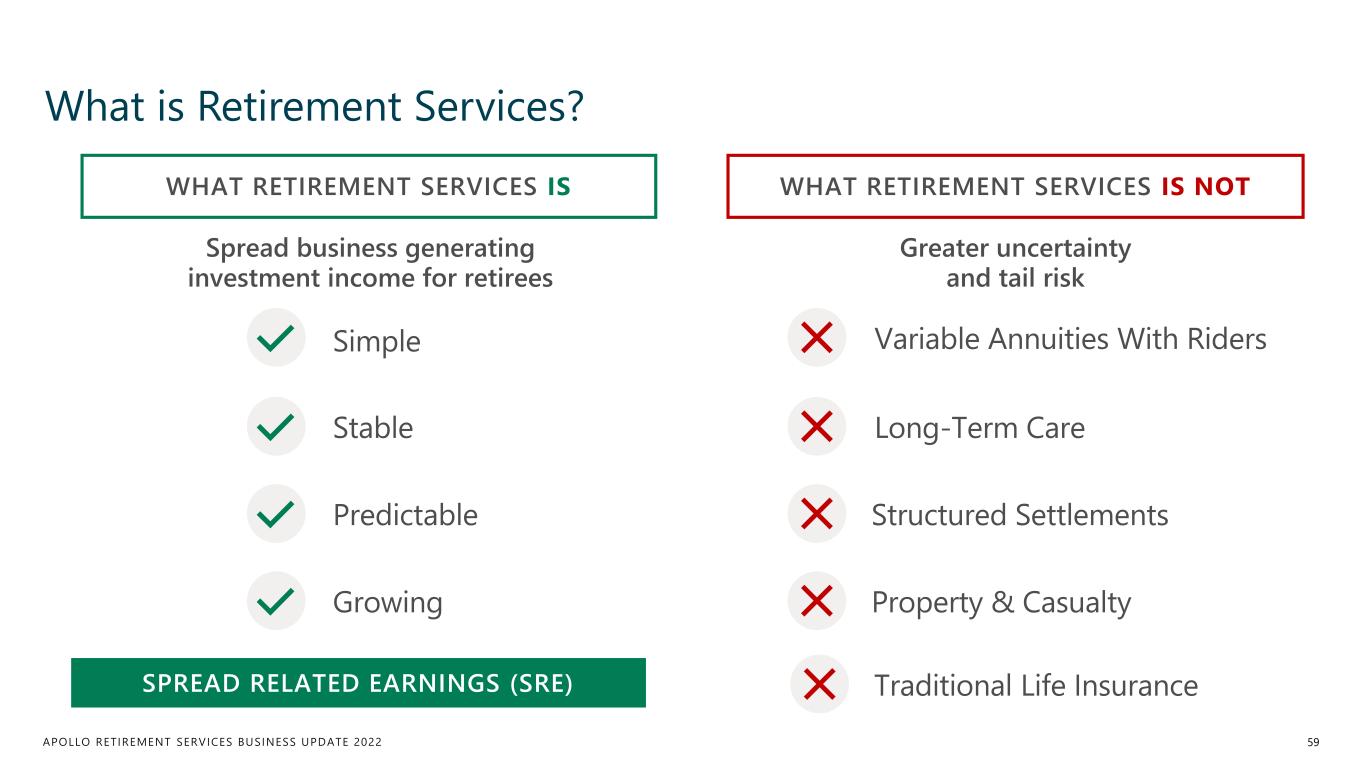
APOLLO RETIREMENT SERVICES BUSINESS UPDATE 2022 What is Retirement Services? 59 Spread business generating investment income for retirees SPREAD RELATED EARNINGS (SRE) Greater uncertainty and tail risk WHAT RETIREMENT SERVICES IS WHAT RETIREMENT SERVICES IS NOT Simple Stable Predictable Growing Variable Annuities With Riders Long-Term Care Structured Settlements Property & Casualty Traditional Life Insurance
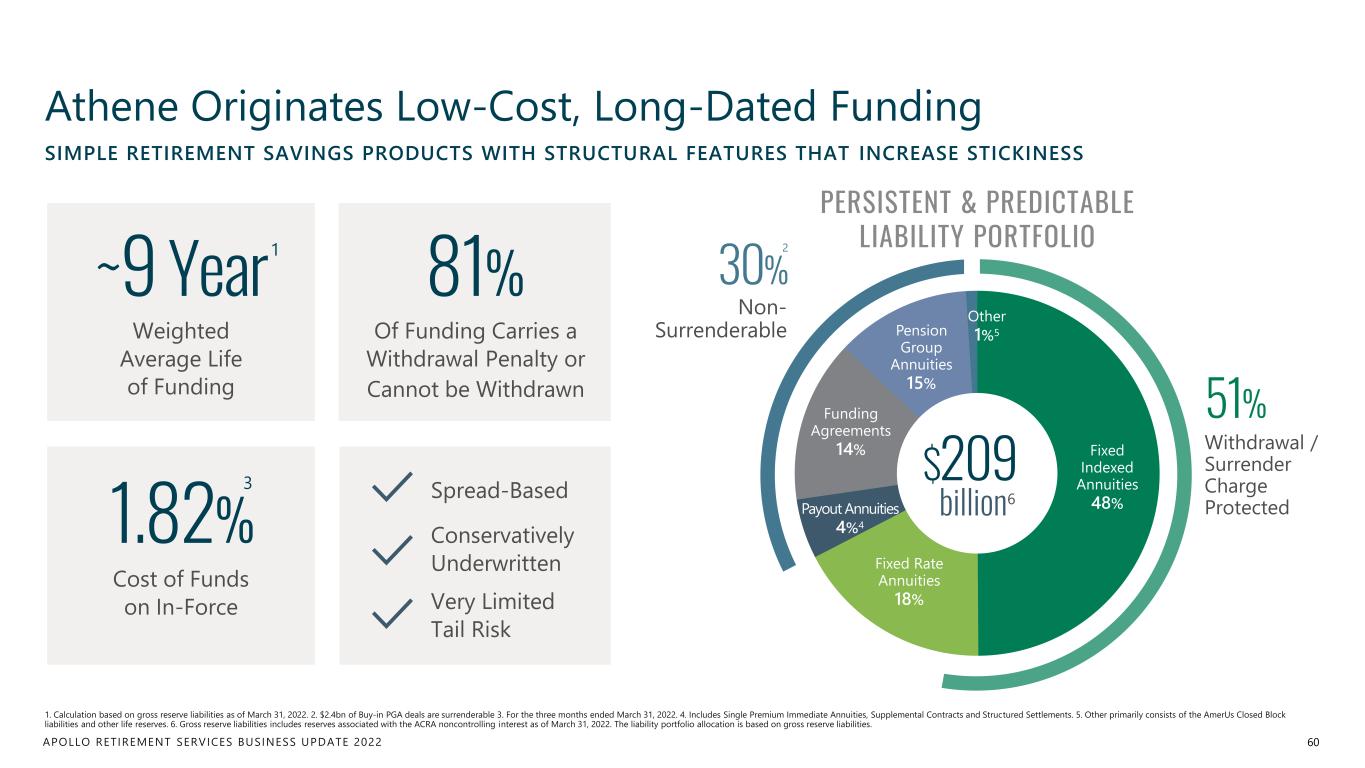
APOLLO RETIREMENT SERVICES BUSINESS UPDATE 2022 Fixed Indexed Annuities 48% Fixed Rate Annuities 18% Payout Annuities 4%4 Funding Agreements 14% Pension Group Annuities 15% Other 1%5 1.82% Athene Originates Low-Cost, Long-Dated Funding 60 1. Calculation based on gross reserve liabilities as of March 31, 2022. 2. $2.4bn of Buy-in PGA deals are surrenderable 3. For the three months ended March 31, 2022. 4. Includes Single Premium Immediate Annuities, Supplemental Contracts and Structured Settlements. 5. Other primarily consists of the AmerUs Closed Block liabilities and other life reserves. 6. Gross reserve liabilities includes reserves associated with the ACRA noncontrolling interest as of March 31, 2022. The liability portfolio allocation is based on gross reserve liabilities. SIMPLE RETIREMENT SAVINGS PRODUCTS WITH STRUCTURAL FEATURES THAT INCREASE STICKINESS Weighted Average Life of Funding Cost of Funds on In-Force 81% 3 Spread-Based Conservatively Underwritten Very Limited Tail Risk ~9 Year Of Funding Carries a Withdrawal Penalty or Cannot be Withdrawn PERSISTENT & PREDICTABLE LIABILITY PORTFOLIO 51% Withdrawal / Surrender Charge Protected 30% Non- Surrenderable $209 billion6 21
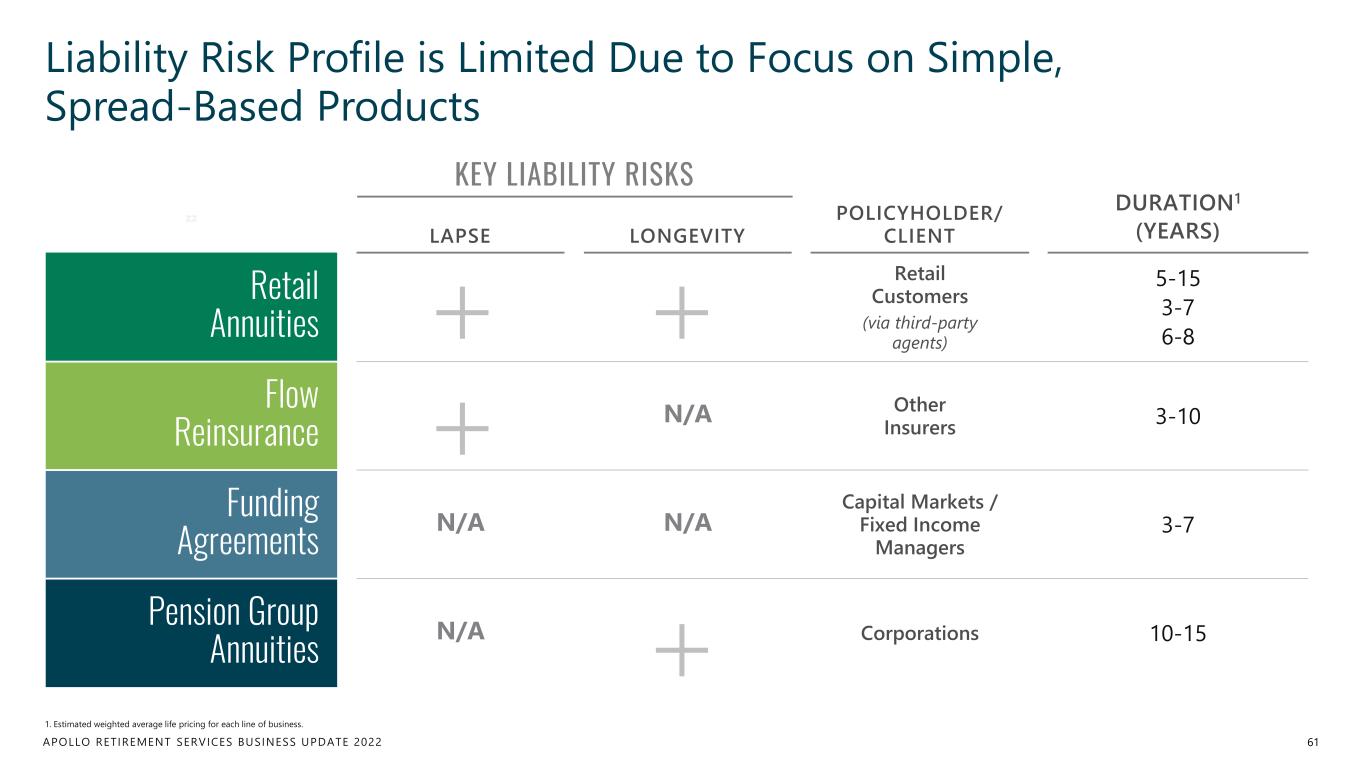
APOLLO RETIREMENT SERVICES BUSINESS UPDATE 2022 zz LAPSE LONGEVITY POLICYHOLDER/ CLIENT DURATION1 (YEARS) Retail Annuities Retail Customers (via third-party agents) 5-15 3-7 6-8 Flow Reinsurance N/A Other Insurers 3-10 Funding Agreements N/A N/A Capital Markets / Fixed Income Managers 3-7 Pension Group Annuities N/A Corporations 10-15 Liability Risk Profile is Limited Due to Focus on Simple, Spread-Based Products 61 KEY LIABILITY RISKS 1. Estimated weighted average life pricing for each line of business.
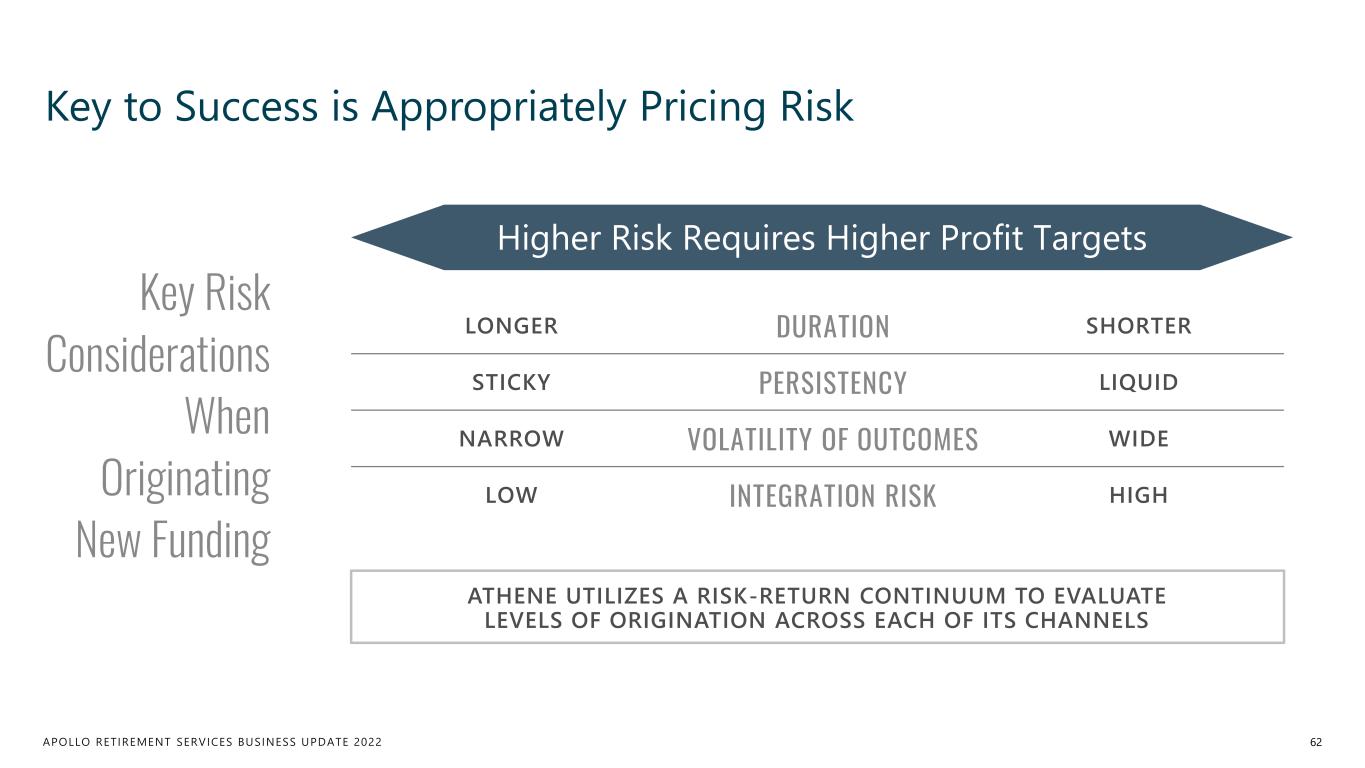
APOLLO RETIREMENT SERVICES BUSINESS UPDATE 2022 Key to Success is Appropriately Pricing Risk Higher Risk Requires Higher Profit Targets LONGER DURATION SHORTER STICKY PERSISTENCY LIQUID NARROW VOLATILITY OF OUTCOMES WIDE LOW INTEGRATION RISK HIGH ATHENE UTILIZES A RISK-RETURN CONTINUUM TO EVALUATE LEVELS OF ORIGINATION ACROSS EACH OF ITS CHANNELS 62 Key Risk Considerations When Originating New Funding
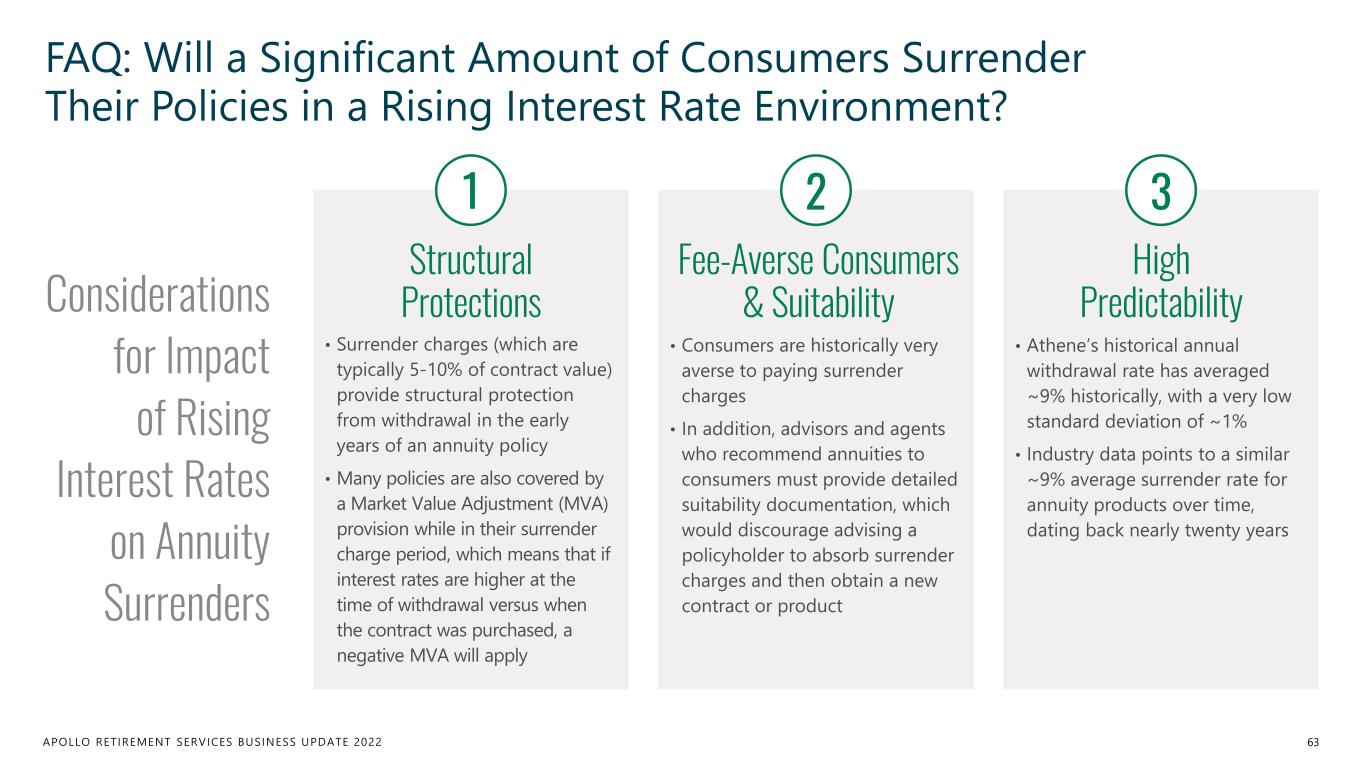
APOLLO RETIREMENT SERVICES BUSINESS UPDATE 2022 FAQ: Will a Significant Amount of Consumers Surrender Their Policies in a Rising Interest Rate Environment? 63 Considerations for Impact of Rising Interest Rates on Annuity Surrenders Structural Protections • Surrender charges (which are typically 5-10% of contract value) provide structural protection from withdrawal in the early years of an annuity policy • Many policies are also covered by a Market Value Adjustment (MVA) provision while in their surrender charge period, which means that if interest rates are higher at the time of withdrawal versus when the contract was purchased, a negative MVA will apply 1 Fee-Averse Consumers & Suitability • Consumers are historically very averse to paying surrender charges • In addition, advisors and agents who recommend annuities to consumers must provide detailed suitability documentation, which would discourage advising a policyholder to absorb surrender charges and then obtain a new contract or product 2 High Predictability • Athene’s historical annual withdrawal rate has averaged ~9% historically, with a very low standard deviation of ~1% • Industry data points to a similar ~9% average surrender rate for annuity products over time, dating back nearly twenty years 3
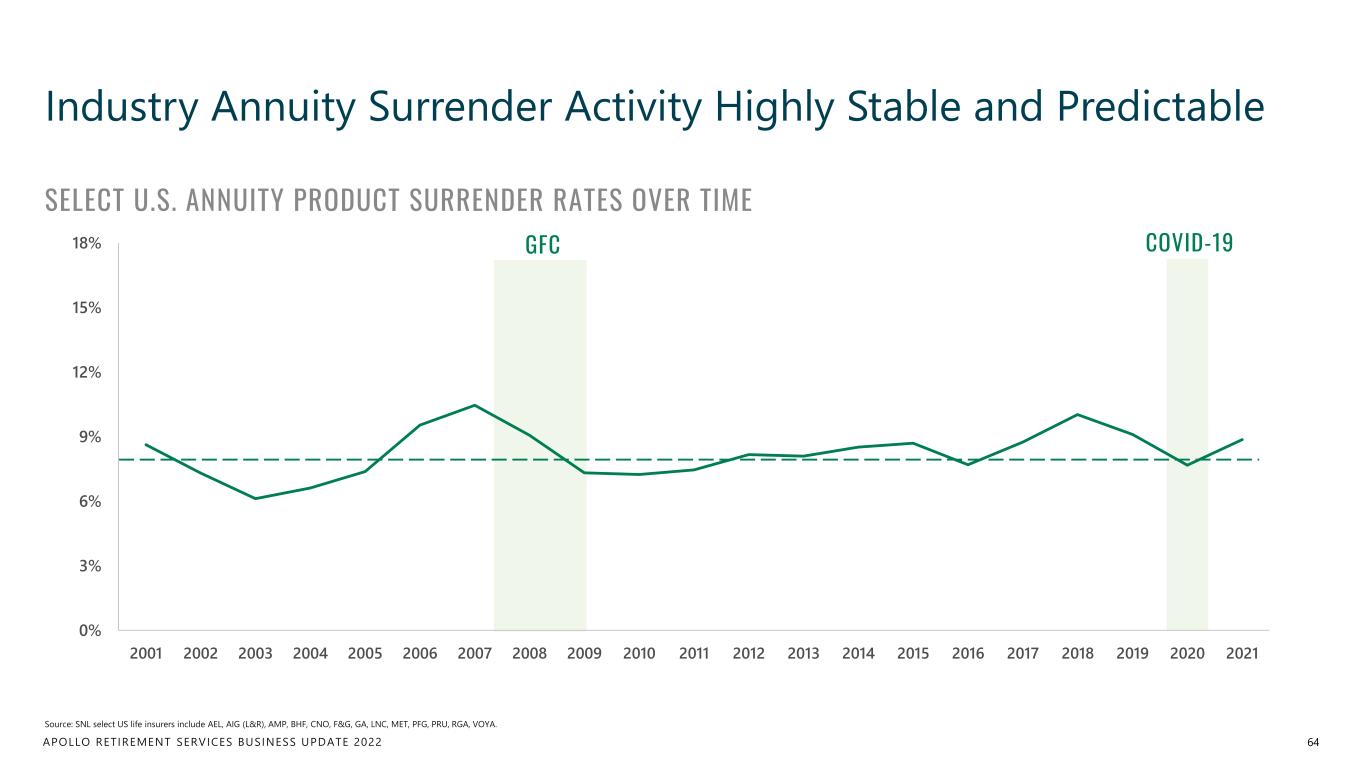
APOLLO RETIREMENT SERVICES BUSINESS UPDATE 2022 0% 3% 6% 9% 12% 15% 18% 2001 2002 2003 2004 2005 2006 2007 2008 2009 2010 2011 2012 2013 2014 2015 2016 2017 2018 2019 2020 2021 GFC COVID-19 Industry Annuity Surrender Activity Highly Stable and Predictable 64 Source: SNL select US life insurers include AEL, AIG (L&R), AMP, BHF, CNO, F&G, GA, LNC, MET, PFG, PRU, RGA, VOYA. SELECT U.S. ANNUITY PRODUCT SURRENDER RATES OVER TIME
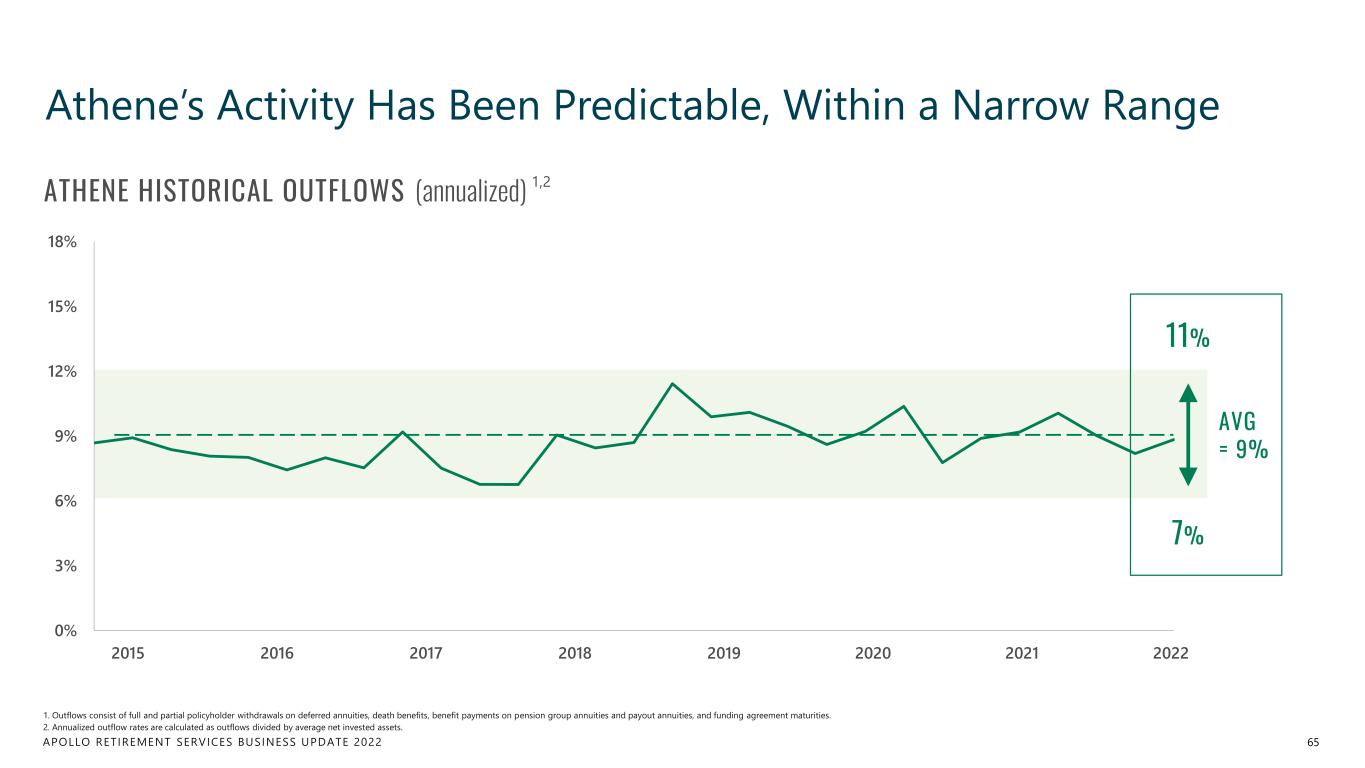
APOLLO RETIREMENT SERVICES BUSINESS UPDATE 2022 0% 3% 6% 9% 12% 15% 18% Athene’s Activity Has Been Predictable, Within a Narrow Range 65 ATHENE HISTORICAL OUTFLOWS (annualized) 1,2 11% 7% 1. Outflows consist of full and partial policyholder withdrawals on deferred annuities, death benefits, benefit payments on pension group annuities and payout annuities, and funding agreement maturities. 2. Annualized outflow rates are calculated as outflows divided by average net invested assets. 2016 2017 2018 2019 2020 2021 20222015 AVG = 9%
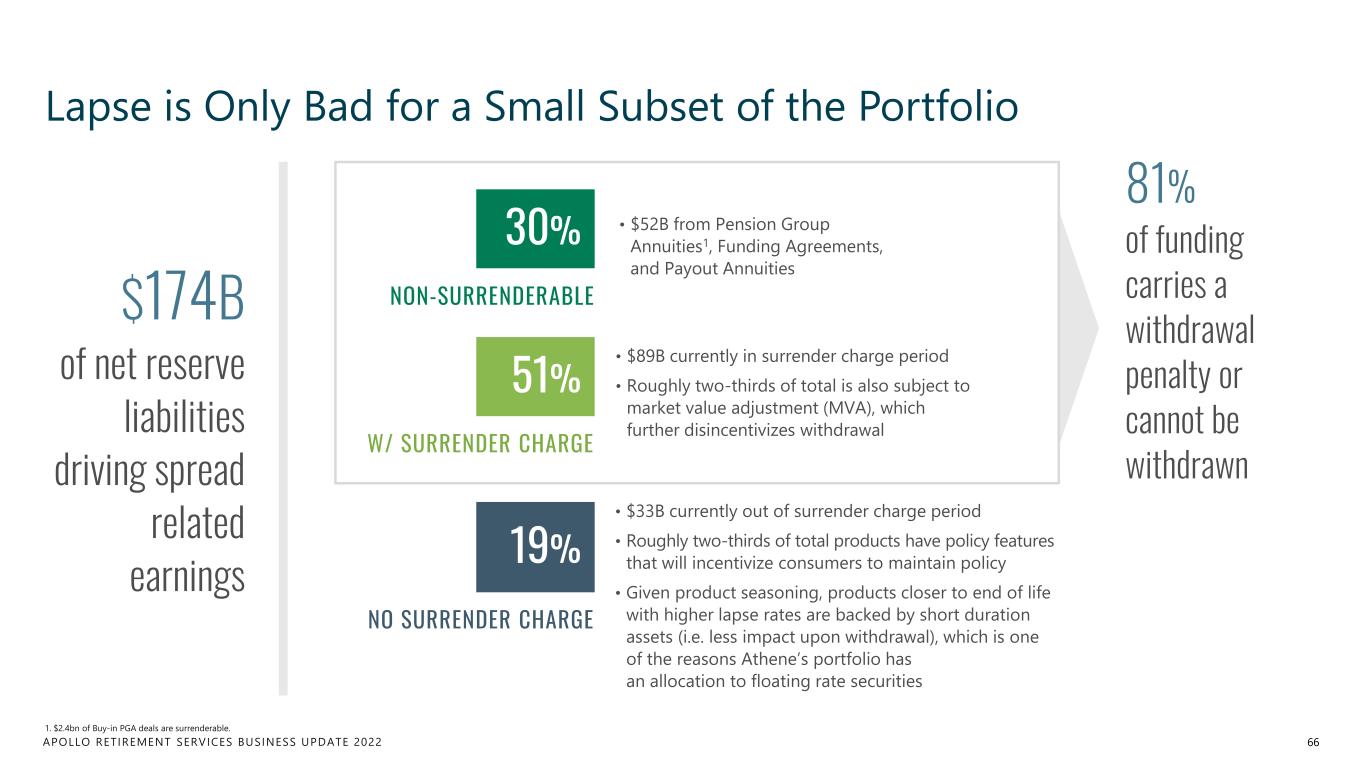
APOLLO RETIREMENT SERVICES BUSINESS UPDATE 2022 • $52B from Pension Group Annuities1, Funding Agreements, and Payout Annuities • $89B currently in surrender charge period • Roughly two-thirds of total is also subject to market value adjustment (MVA), which further disincentivizes withdrawal • $33B currently out of surrender charge period • Roughly two-thirds of total products have policy features that will incentivize consumers to maintain policy • Given product seasoning, products closer to end of life with higher lapse rates are backed by short duration assets (i.e. less impact upon withdrawal), which is one of the reasons Athene’s portfolio has an allocation to floating rate securities Lapse is Only Bad for a Small Subset of the Portfolio 66 51% 19% 81% of funding carries a withdrawal penalty or cannot be withdrawn $174B of net reserve liabilities driving spread related earnings W/ SURRENDER CHARGE NO SURRENDER CHARGE 30% NON-SURRENDERABLE 1. $2.4bn of Buy-in PGA deals are surrenderable.
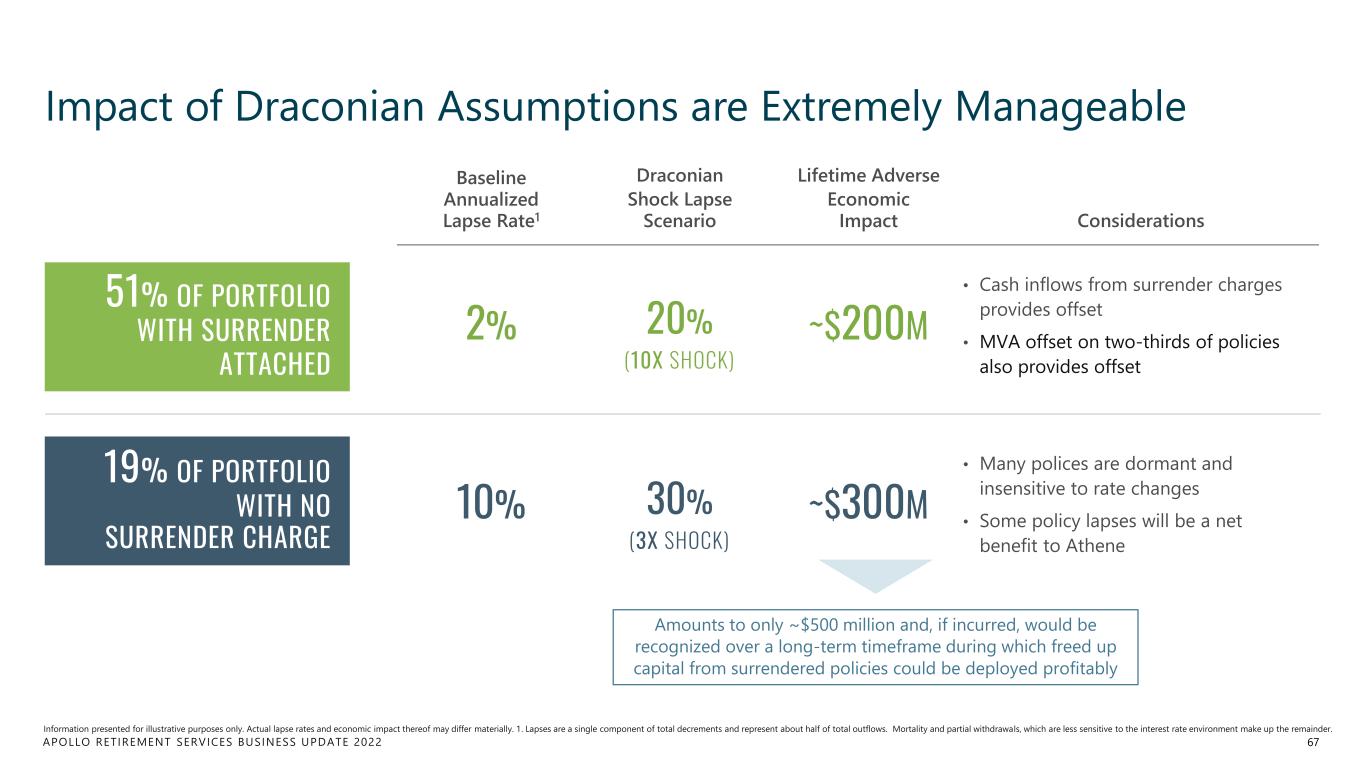
APOLLO RETIREMENT SERVICES BUSINESS UPDATE 2022 Baseline Annualized Lapse Rate1 Draconian Shock Lapse Scenario Lifetime Adverse Economic Impact Considerations 2% ~$200M • Cash inflows from surrender charges provides offset • MVA offset on two-thirds of policies also provides offset 10% ~$300M • Many polices are dormant and insensitive to rate changes • Some policy lapses will be a net benefit to Athene Impact of Draconian Assumptions are Extremely Manageable 67 51% OF PORTFOLIO WITH SURRENDER ATTACHED 19% OF PORTFOLIO WITH NO SURRENDER CHARGE Amounts to only ~$500 million and, if incurred, would be recognized over a long-term timeframe during which freed up capital from surrendered policies could be deployed profitably Information presented for illustrative purposes only. Actual lapse rates and economic impact thereof may differ materially. 1. Lapses are a single component of total decrements and represent about half of total outflows. Mortality and partial withdrawals, which are less sensitive to the interest rate environment make up the remainder. 20% (10X SHOCK) 30% (3X SHOCK)
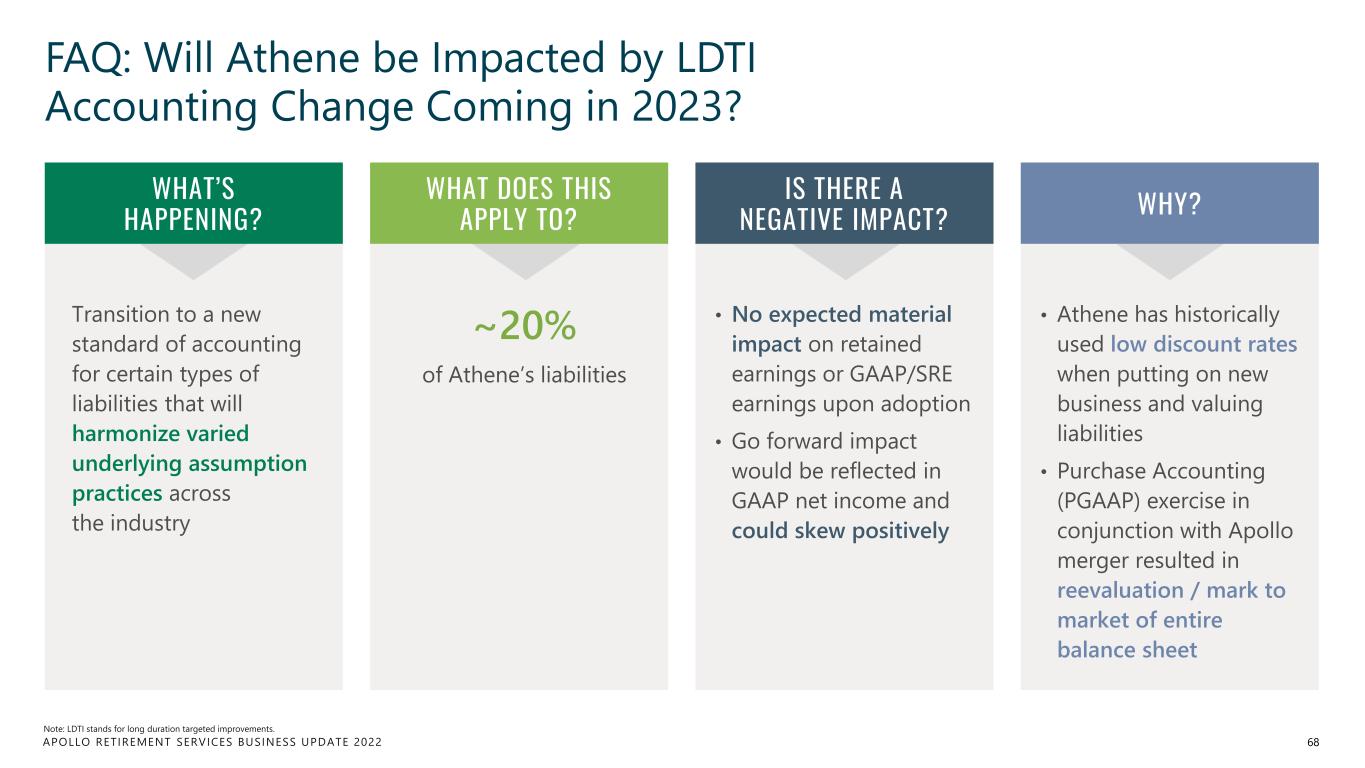
APOLLO RETIREMENT SERVICES BUSINESS UPDATE 2022 FAQ: Will Athene be Impacted by LDTI Accounting Change Coming in 2023? 68 Transition to a new standard of accounting for certain types of liabilities that will harmonize varied underlying assumption practices across the industry ~20% of Athene’s liabilities • No expected material impact on retained earnings or GAAP/SRE earnings upon adoption • Go forward impact would be reflected in GAAP net income and could skew positively • Athene has historically used low discount rates when putting on new business and valuing liabilities • Purchase Accounting (PGAAP) exercise in conjunction with Apollo merger resulted in reevaluation / mark to market of entire balance sheet WHAT’S HAPPENING? WHAT DOES THIS APPLY TO? IS THERE A NEGATIVE IMPACT? WHY? Note: LDTI stands for long duration targeted improvements.

Asset Risk Framework & Stress Results DOUG NIEMANN Chief Risk Officer, Athene
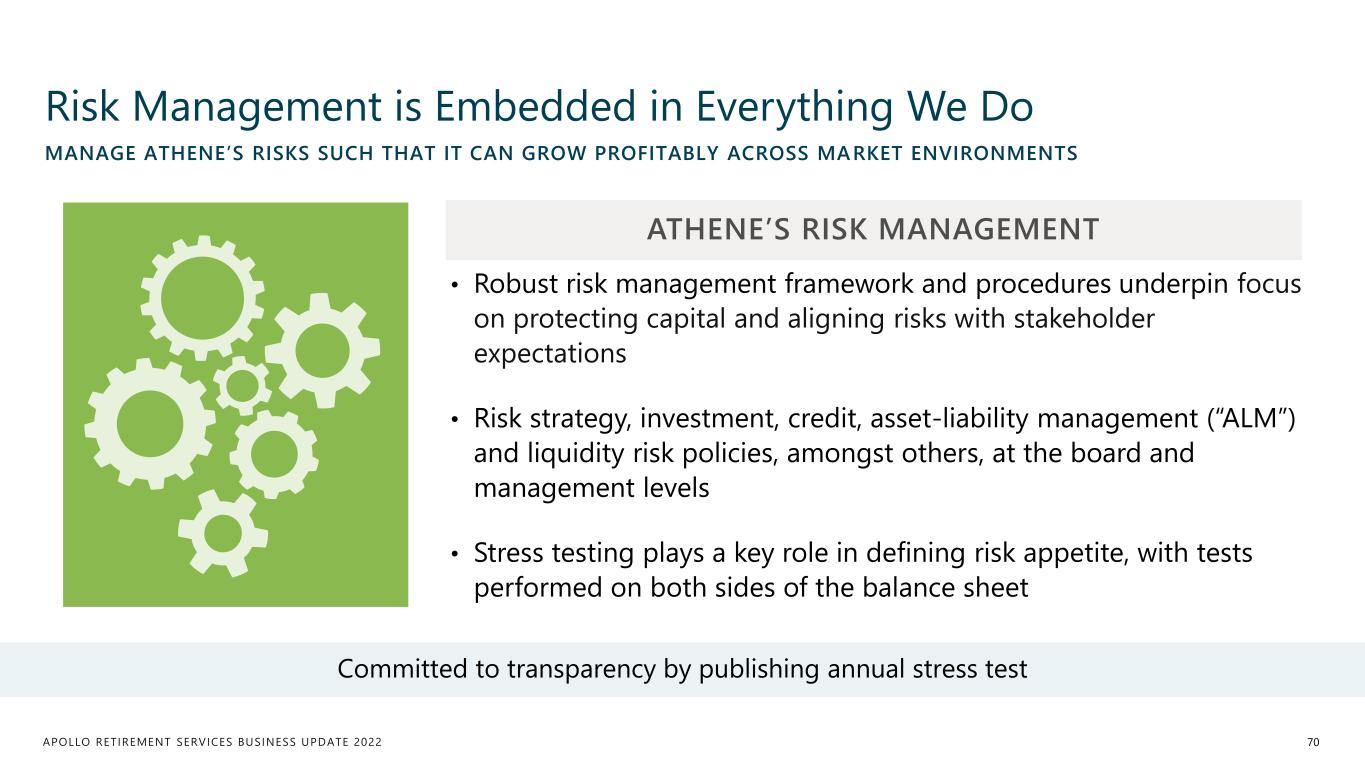
APOLLO RETIREMENT SERVICES BUSINESS UPDATE 2022 • Robust risk management framework and procedures underpin focus on protecting capital and aligning risks with stakeholder expectations • Risk strategy, investment, credit, asset-liability management (“ALM”) and liquidity risk policies, amongst others, at the board and management levels • Stress testing plays a key role in defining risk appetite, with tests performed on both sides of the balance sheet Risk Management is Embedded in Everything We Do 70 MANAGE ATHENE’S RISKS SUCH THAT IT CAN GROW PROFITABLY ACROSS MARKET ENVIRONMENTS ATHENE’S RISK MANAGEMENT Committed to transparency by publishing annual stress test
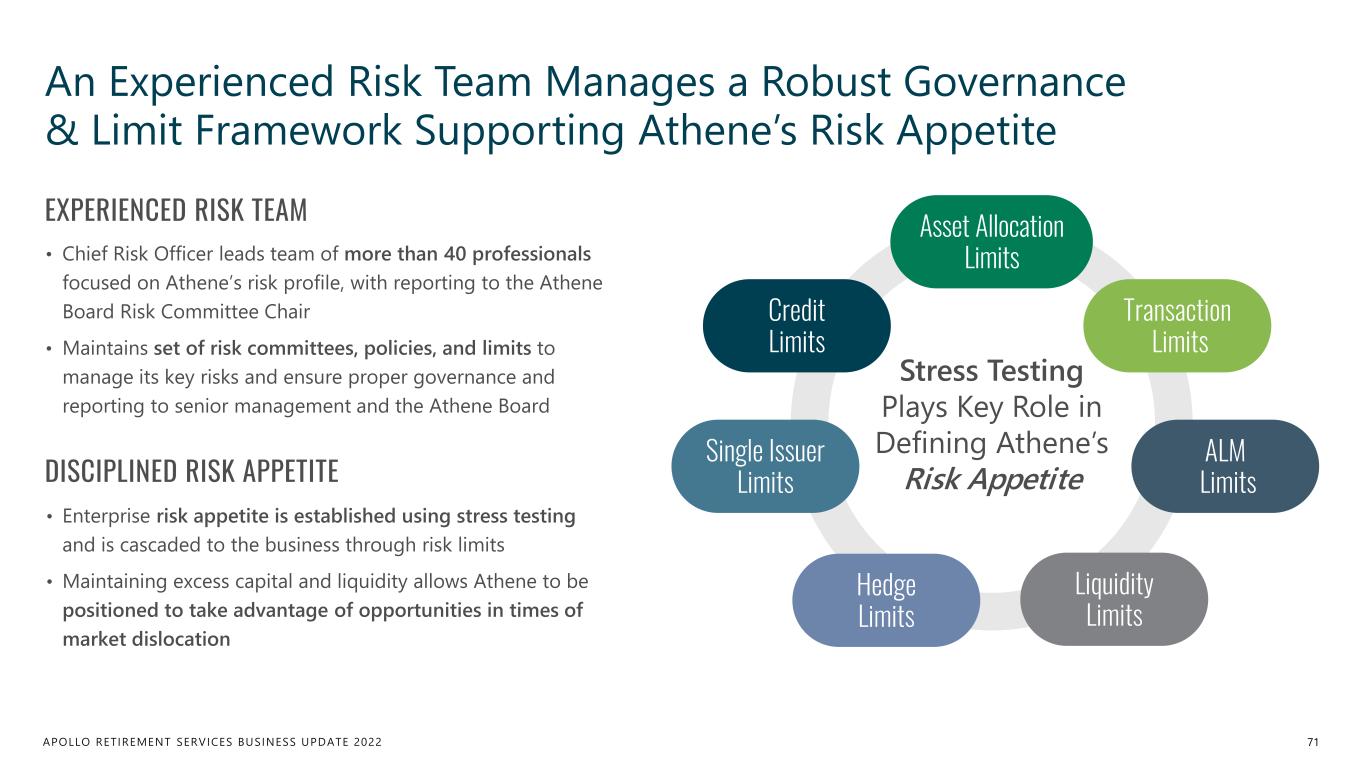
APOLLO RETIREMENT SERVICES BUSINESS UPDATE 2022 An Experienced Risk Team Manages a Robust Governance & Limit Framework Supporting Athene’s Risk Appetite 71 Stress Testing Plays Key Role in Defining Athene’s Risk Appetite ALM Limits Liquidity Limits Hedge Limits Single Issuer Limits Credit Limits Transaction Limits Asset Allocation Limits• Chief Risk Officer leads team of more than 40 professionals focused on Athene’s risk profile, with reporting to the Athene Board Risk Committee Chair • Maintains set of risk committees, policies, and limits to manage its key risks and ensure proper governance and reporting to senior management and the Athene Board EXPERIENCED RISK TEAM DISCIPLINED RISK APPETITE • Enterprise risk appetite is established using stress testing and is cascaded to the business through risk limits • Maintaining excess capital and liquidity allows Athene to be positioned to take advantage of opportunities in times of market dislocation
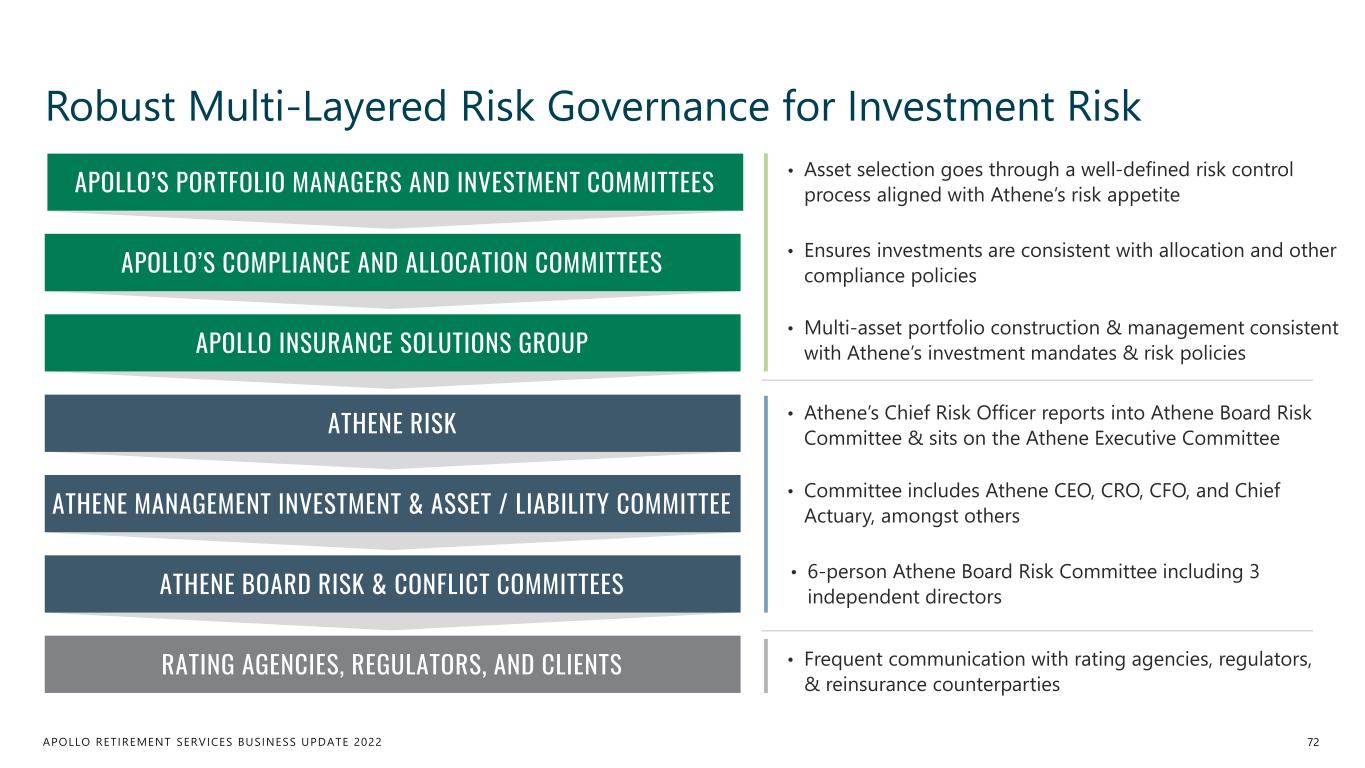
APOLLO RETIREMENT SERVICES BUSINESS UPDATE 2022 Robust Multi-Layered Risk Governance for Investment Risk • Asset selection goes through a well-defined risk control process aligned with Athene’s risk appetite • Ensures investments are consistent with allocation and other compliance policies • Athene’s Chief Risk Officer reports into Athene Board Risk Committee & sits on the Athene Executive Committee • Frequent communication with rating agencies, regulators, & reinsurance counterparties • Multi-asset portfolio construction & management consistent with Athene’s investment mandates & risk policies • Committee includes Athene CEO, CRO, CFO, and Chief Actuary, amongst others 72 APOLLO’S PORTFOLIO MANAGERS AND INVESTMENT COMMITTEES APOLLO INSURANCE SOLUTIONS GROUP APOLLO’S COMPLIANCE AND ALLOCATION COMMITTEES ATHENE RISK ATHENE MANAGEMENT INVESTMENT & ASSET / LIABILITY COMMITTEE ATHENE BOARD RISK & CONFLICT COMMITTEES RATING AGENCIES, REGULATORS, AND CLIENTS • 6-person Athene Board Risk Committee including 3 independent directors
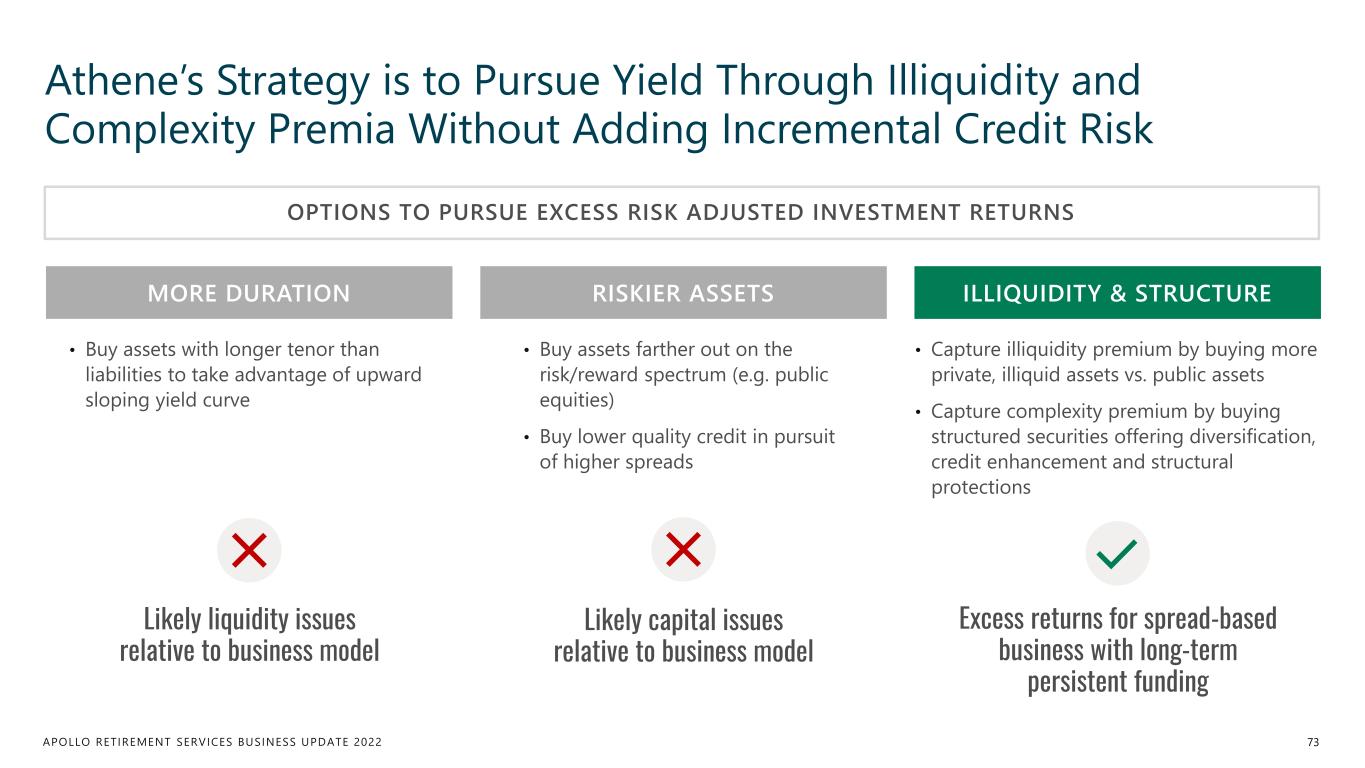
APOLLO RETIREMENT SERVICES BUSINESS UPDATE 2022 Athene’s Strategy is to Pursue Yield Through Illiquidity and Complexity Premia Without Adding Incremental Credit Risk 73 OPTIONS TO PURSUE EXCESS RISK ADJUSTED INVESTMENT RETURNS MORE DURATION RISKIER ASSETS ILLIQUIDITY & STRUCTURE • Buy assets with longer tenor than liabilities to take advantage of upward sloping yield curve • Buy assets farther out on the risk/reward spectrum (e.g. public equities) • Buy lower quality credit in pursuit of higher spreads • Capture illiquidity premium by buying more private, illiquid assets vs. public assets • Capture complexity premium by buying structured securities offering diversification, credit enhancement and structural protections Likely liquidity issues relative to business model Likely capital issues relative to business model Excess returns for spread-based business with long-term persistent funding
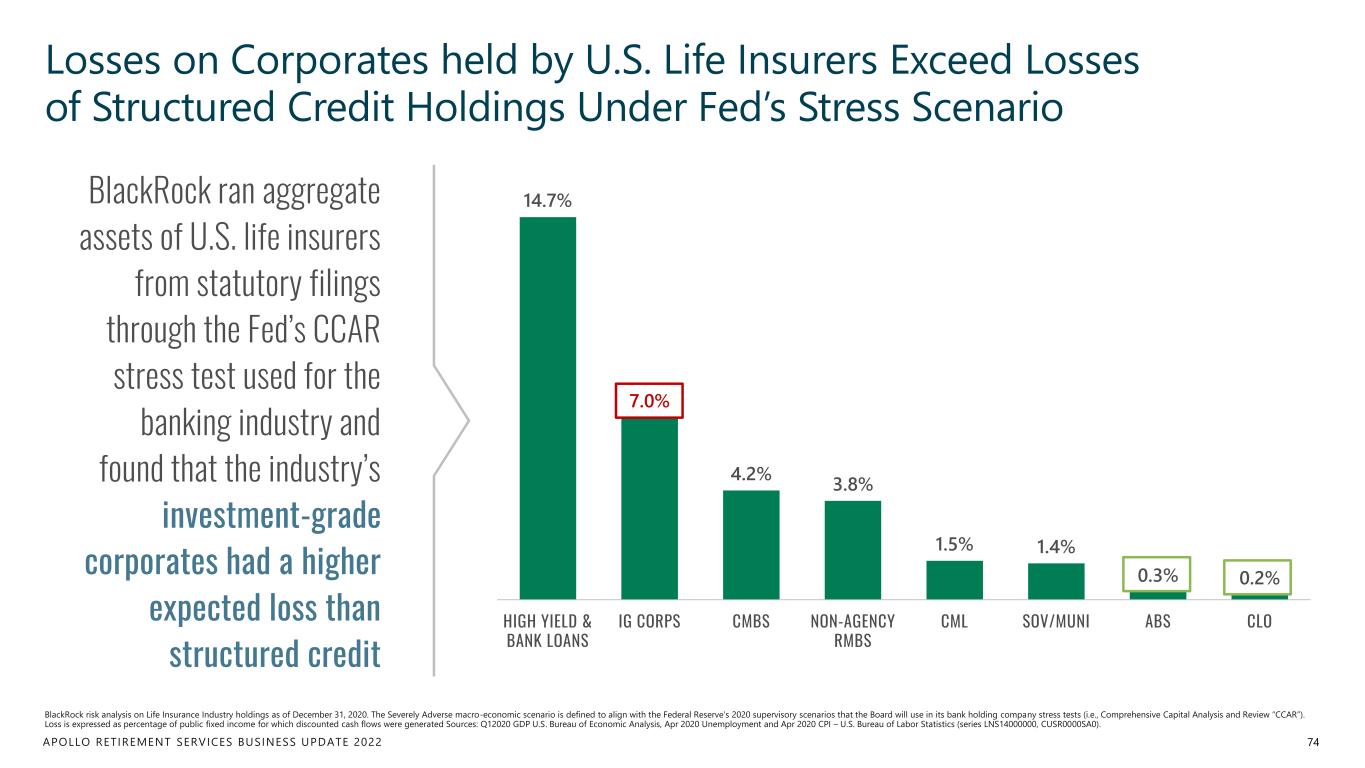
APOLLO RETIREMENT SERVICES BUSINESS UPDATE 2022 14.7% 7.0% 4.2% 3.8% 1.5% 1.4% 0.3% 0.2% HIGH YIELD & BANK LOANS IG CORPS CMBS NON-AGENCY RMBS CML SOV/MUNI ABS CLO Losses on Corporates held by U.S. Life Insurers Exceed Losses of Structured Credit Holdings Under Fed’s Stress Scenario BlackRock ran aggregate assets of U.S. life insurers from statutory filings through the Fed’s CCAR stress test used for the banking industry and found that the industry’s investment-grade corporates had a higher expected loss than structured credit BlackRock risk analysis on Life Insurance Industry holdings as of December 31, 2020. The Severely Adverse macro-economic scenario is defined to align with the Federal Reserve’s 2020 supervisory scenarios that the Board will use in its bank holding company stress tests (i.e., Comprehensive Capital Analysis and Review “CCAR”). Loss is expressed as percentage of public fixed income for which discounted cash flows were generated Sources: Q12020 GDP U.S. Bureau of Economic Analysis, Apr 2020 Unemployment and Apr 2020 CPI – U.S. Bureau of Labor Statistics (series LNS14000000, CUSR0000SA0). 74
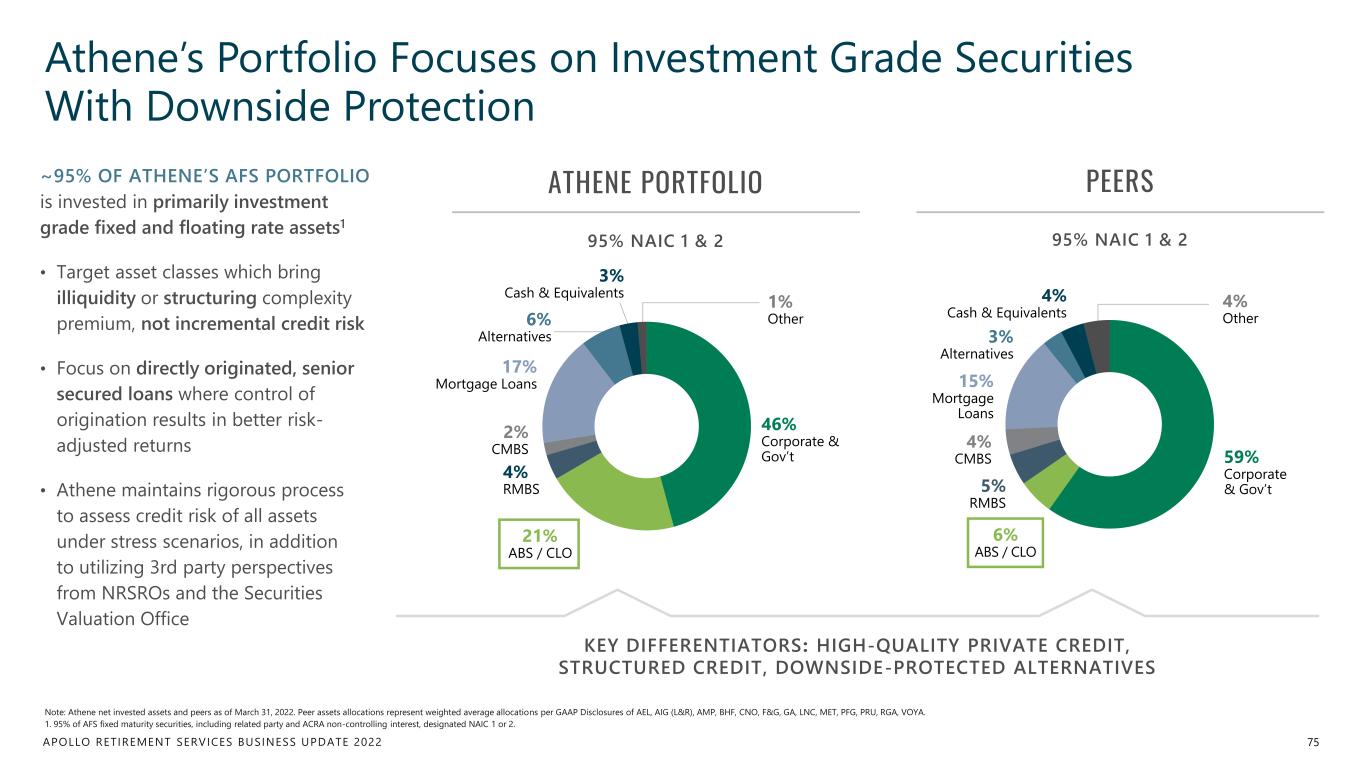
APOLLO RETIREMENT SERVICES BUSINESS UPDATE 2022 1% Other 3% Cash & Equivalents 46% Corporate & Gov’t 4% RMBS 21% ABS / CLO 2% CMBS 6% Alternatives 17% Mortgage Loans 4% Cash & Equivalents 59% Corporate & Gov’t5% RMBS 4% CMBS 15% Mortgage Loans 4% Other 6% ABS / CLO 3% Alternatives ~95% OF ATHENE’S AFS PORTFOLIO is invested in primarily investment grade fixed and floating rate assets1 • Target asset classes which bring illiquidity or structuring complexity premium, not incremental credit risk • Focus on directly originated, senior secured loans where control of origination results in better risk- adjusted returns • Athene maintains rigorous process to assess credit risk of all assets under stress scenarios, in addition to utilizing 3rd party perspectives from NRSROs and the Securities Valuation Office Athene’s Portfolio Focuses on Investment Grade Securities With Downside Protection 95% NAIC 1 & 2 PEERSATHENE PORTFOLIO 95% NAIC 1 & 2 Note: Athene net invested assets and peers as of March 31, 2022. Peer assets allocations represent weighted average allocations per GAAP Disclosures of AEL, AIG (L&R), AMP, BHF, CNO, F&G, GA, LNC, MET, PFG, PRU, RGA, VOYA. 1. 95% of AFS fixed maturity securities, including related party and ACRA non-controlling interest, designated NAIC 1 or 2. 75 KEY DIFFERENTIATORS : HIGH-QUALITY PRIVATE CREDIT, STRUCTURED CREDIT, DOWNSIDE-PROTECTED ALTERNATIVES
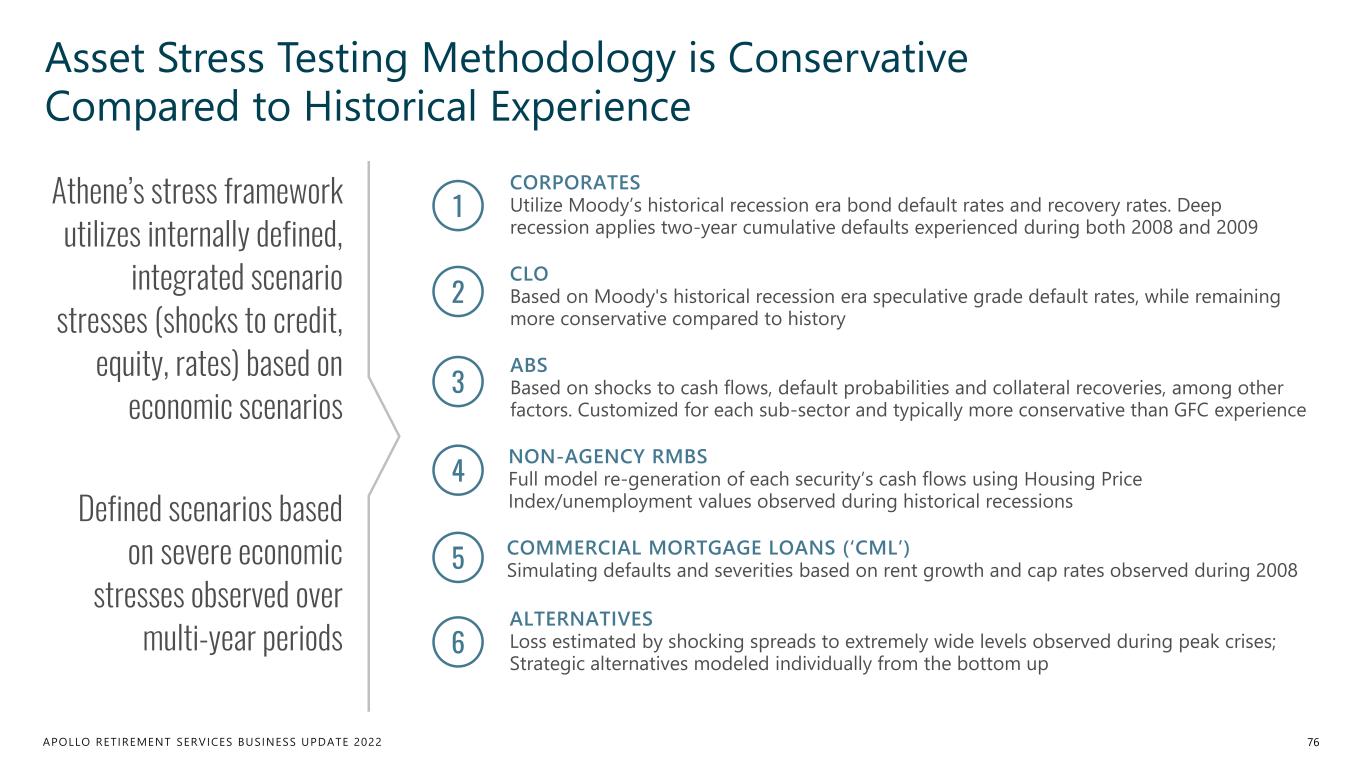
APOLLO RETIREMENT SERVICES BUSINESS UPDATE 2022 Asset Stress Testing Methodology is Conservative Compared to Historical Experience 76 Athene’s stress framework utilizes internally defined, integrated scenario stresses (shocks to credit, equity, rates) based on economic scenarios Defined scenarios based on severe economic stresses observed over multi-year periods CORPORATES Utilize Moody’s historical recession era bond default rates and recovery rates. Deep recession applies two-year cumulative defaults experienced during both 2008 and 2009 CLO Based on Moody's historical recession era speculative grade default rates, while remaining more conservative compared to history NON-AGENCY RMBS Full model re-generation of each security’s cash flows using Housing Price Index/unemployment values observed during historical recessions COMMERCIAL MORTGAGE LOANS (‘CML’) Simulating defaults and severities based on rent growth and cap rates observed during 2008 ALTERNATIVES Loss estimated by shocking spreads to extremely wide levels observed during peak crises; Strategic alternatives modeled individually from the bottom up 1 2 4 5 6 3 ABS Based on shocks to cash flows, default probabilities and collateral recoveries, among other factors. Customized for each sub-sector and typically more conservative than GFC experience
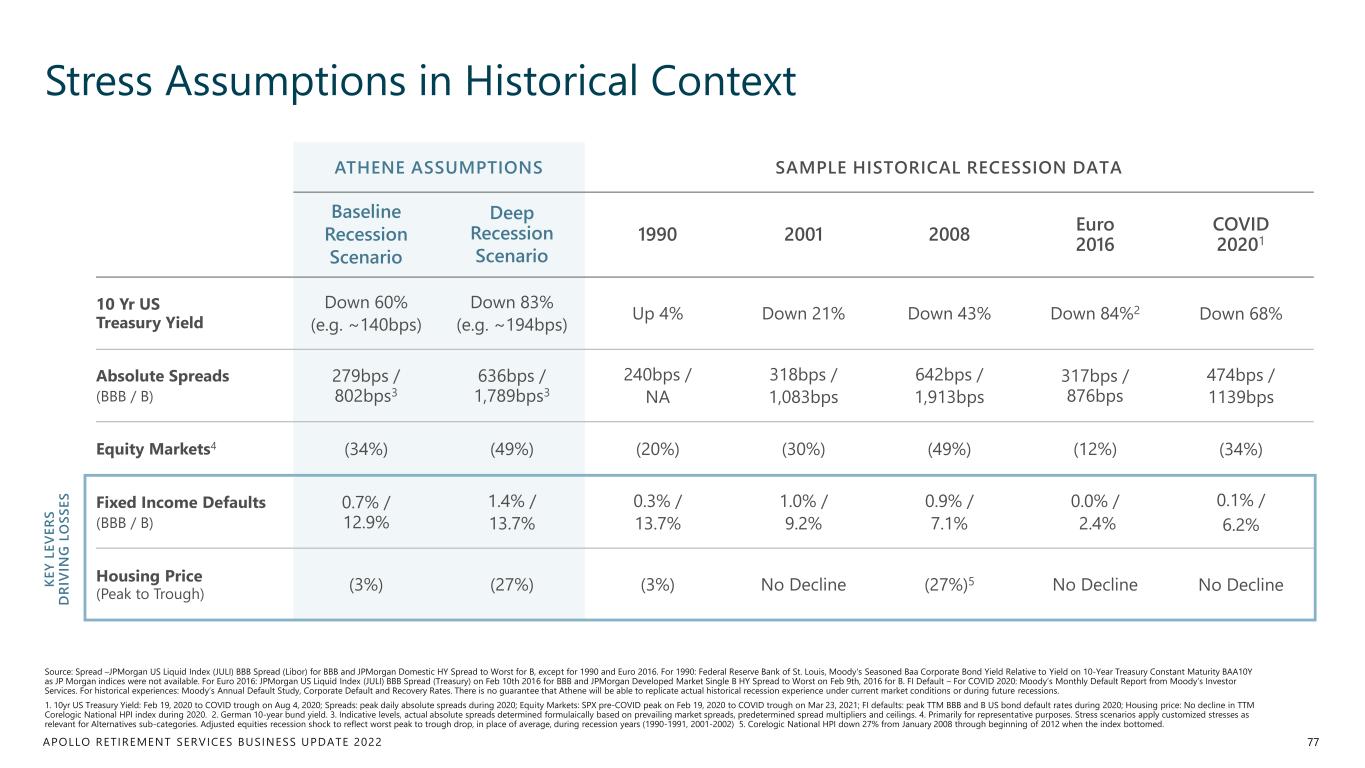
APOLLO RETIREMENT SERVICES BUSINESS UPDATE 2022 ATHENE ASSUMPTIONS SAMPLE HISTORICAL RECESSION DATA Baseline Recession Scenario Deep Recession Scenario 1990 2001 2008 Euro 2016 COVID 20201 10 Yr US Treasury Yield Down 60% (e.g. ~140bps) Down 83% (e.g. ~194bps) Up 4% Down 21% Down 43% Down 84%2 Down 68% Absolute Spreads (BBB / B) 279bps / 802bps3 636bps / 1,789bps3 240bps / NA 318bps / 1,083bps 642bps / 1,913bps 317bps / 876bps 474bps / 1139bps Equity Markets4 (34%) (49%) (20%) (30%) (49%) (12%) (34%) Fixed Income Defaults (BBB / B) 0.7% / 12.9% 1.4% / 13.7% 0.3% / 13.7% 1.0% / 9.2% 0.9% / 7.1% 0.0% / 2.4% 0.1% / 6.2% Housing Price (Peak to Trough) (3%) (27%) (3%) No Decline (27%)5 No Decline No Decline Stress Assumptions in Historical Context Source: Spread –JPMorgan US Liquid Index (JULI) BBB Spread (Libor) for BBB and JPMorgan Domestic HY Spread to Worst for B, except for 1990 and Euro 2016. For 1990: Federal Reserve Bank of St. Louis, Moody's Seasoned Baa Corporate Bond Yield Relative to Yield on 10-Year Treasury Constant Maturity BAA10Y as JP Morgan indices were not available. For Euro 2016: JPMorgan US Liquid Index (JULI) BBB Spread (Treasury) on Feb 10th 2016 for BBB and JPMorgan Developed Market Single B HY Spread to Worst on Feb 9th, 2016 for B. FI Default – For COVID 2020: Moody’s Monthly Default Report from Moody’s Investor Services. For historical experiences: Moody’s Annual Default Study, Corporate Default and Recovery Rates. There is no guarantee that Athene will be able to replicate actual historical recession experience under current market conditions or during future recessions. 1. 10yr US Treasury Yield: Feb 19, 2020 to COVID trough on Aug 4, 2020; Spreads: peak daily absolute spreads during 2020; Equity Markets: SPX pre-COVID peak on Feb 19, 2020 to COVID trough on Mar 23, 2021; FI defaults: peak TTM BBB and B US bond default rates during 2020; Housing price: No decline in TTM Corelogic National HPI index during 2020. 2. German 10-year bund yield. 3. Indicative levels, actual absolute spreads determined formulaically based on prevailing market spreads, predetermined spread multipliers and ceilings. 4. Primarily for representative purposes. Stress scenarios apply customized stresses as relevant for Alternatives sub-categories. Adjusted equities recession shock to reflect worst peak to trough drop, in place of average, during recession years (1990-1991, 2001-2002) 5. Corelogic National HPI down 27% from January 2008 through beginning of 2012 when the index bottomed. 77 K E Y L E V E R S D R IV IN G L O S S E S
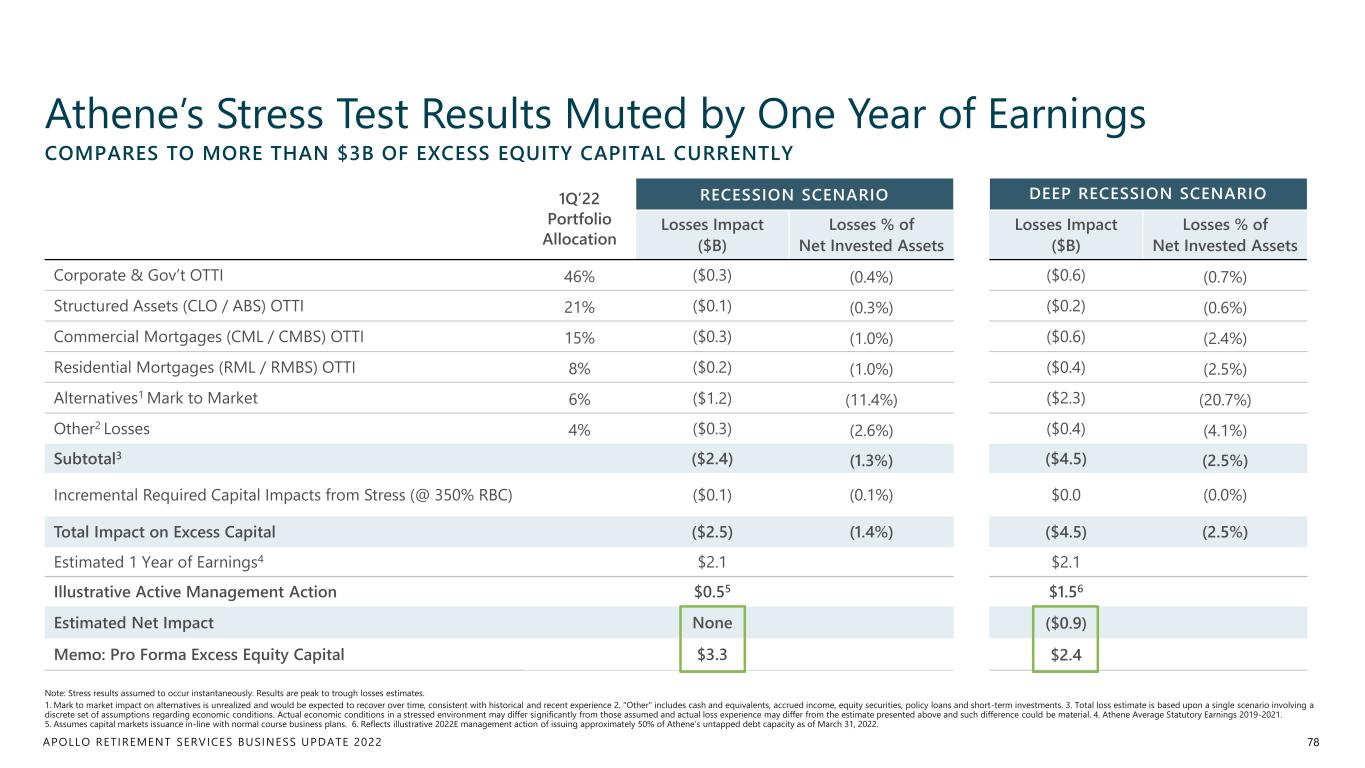
APOLLO RETIREMENT SERVICES BUSINESS UPDATE 2022 Athene’s Stress Test Results Muted by One Year of Earnings 78 1Q’22 Portfolio Allocation RECESSION SCENARIO DEEP RECESSION SCENARIO Losses Impact ($B) Losses % of Net Invested Assets Losses Impact ($B) Losses % of Net Invested Assets Corporate & Gov’t OTTI 46% ($0.3) (0.4%) ($0.6) (0.7%) Structured Assets (CLO / ABS) OTTI 21% ($0.1) (0.3%) ($0.2) (0.6%) Commercial Mortgages (CML / CMBS) OTTI 15% ($0.3) (1.0%) ($0.6) (2.4%) Residential Mortgages (RML / RMBS) OTTI 8% ($0.2) (1.0%) ($0.4) (2.5%) Alternatives1 Mark to Market 6% ($1.2) (11.4%) ($2.3) (20.7%) Other2 Losses 4% ($0.3) (2.6%) ($0.4) (4.1%) Subtotal3 ($2.4) (1.3%) ($4.5) (2.5%) Incremental Required Capital Impacts from Stress (@ 350% RBC) ($0.1) (0.1%) $0.0 (0.0%) Total Impact on Excess Capital ($2.5) (1.4%) ($4.5) (2.5%) Estimated 1 Year of Earnings4 $2.1 $2.1 Illustrative Active Management Action $0.55 $1.56 Estimated Net Impact None ($0.9) Memo: Pro Forma Excess Equity Capital $3.3 $2.4 Note: Stress results assumed to occur instantaneously. Results are peak to trough losses estimates. 1. Mark to market impact on alternatives is unrealized and would be expected to recover over time, consistent with historical and recent experience 2. "Other" includes cash and equivalents, accrued income, equity securities, policy loans and short-term investments. 3. Total loss estimate is based upon a single scenario involving a discrete set of assumptions regarding economic conditions. Actual economic conditions in a stressed environment may differ significantly from those assumed and actual loss experience may differ from the estimate presented above and such difference could be material. 4. Athene Average Statutory Earnings 2019-2021. 5. Assumes capital markets issuance in-line with normal course business plans. 6. Reflects illustrative 2022E management action of issuing approximately 50% of Athene’s untapped debt capacity as of March 31, 2022. COMPARES TO MORE THAN $3B OF EXCESS EQUITY CAPITAL CURRENTLY
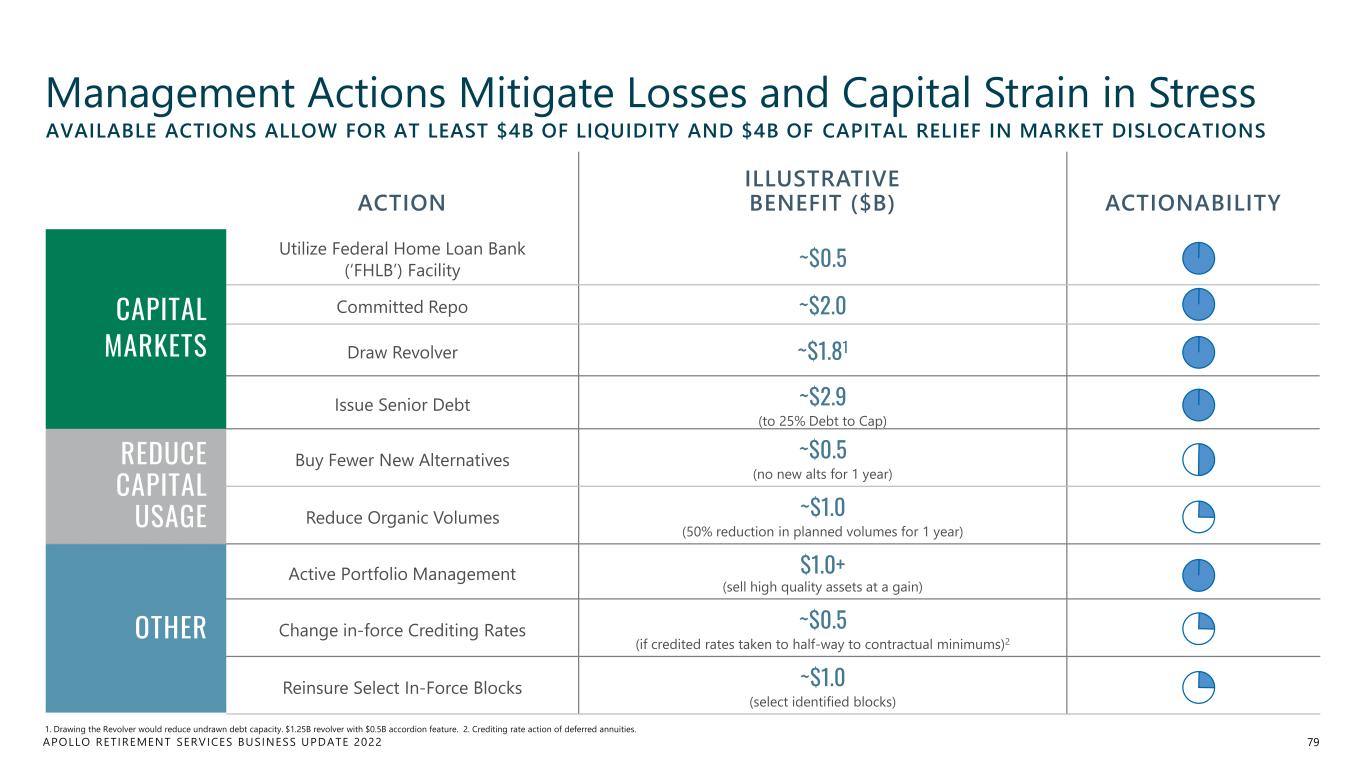
APOLLO RETIREMENT SERVICES BUSINESS UPDATE 2022 Management Actions Mitigate Losses and Capital Strain in Stress ACTION ILLUSTRATIVE BENEFIT ($B) ACTIONABILITY CAPITAL MARKETS Utilize Federal Home Loan Bank (‘FHLB’) Facility ~$0.5 Committed Repo ~$2.0 Draw Revolver ~$1.81 Issue Senior Debt ~$2.9 (to 25% Debt to Cap) REDUCE CAPITAL USAGE Buy Fewer New Alternatives ~$0.5 (no new alts for 1 year) Reduce Organic Volumes ~$1.0 (50% reduction in planned volumes for 1 year) OTHER Active Portfolio Management $1.0+ (sell high quality assets at a gain) Change in-force Crediting Rates ~$0.5 (if credited rates taken to half-way to contractual minimums)2 Reinsure Select In-Force Blocks ~$1.0 (select identified blocks) 79 1. Drawing the Revolver would reduce undrawn debt capacity. $1.25B revolver with $0.5B accordion feature. 2. Crediting rate action of deferred annuities. AVAILABLE ACTIONS ALLOW FOR AT LEAST $4B OF LIQUIDITY AND $4B OF CAPITAL RELIEF IN MARKET DISLOCATIONS
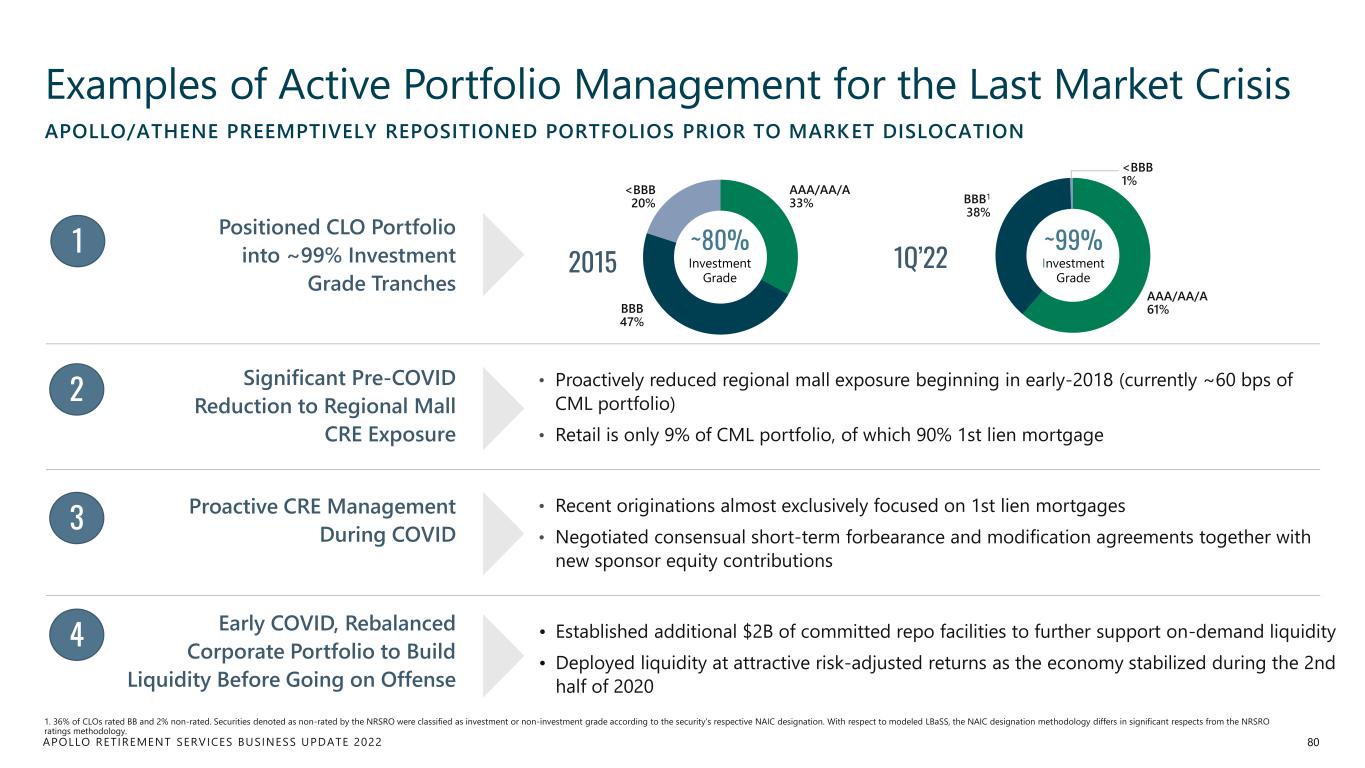
APOLLO RETIREMENT SERVICES BUSINESS UPDATE 2022 AAA/AA/A 33% BBB 47% <BBB 20% AAA/AA/A 61% BBB1 38% <BBB 1% Examples of Active Portfolio Management for the Last Market Crisis 80 2015 1Q’22 ~99% Investment Grade ~80% Investment Grade Positioned CLO Portfolio into ~99% Investment Grade Tranches • Proactively reduced regional mall exposure beginning in early-2018 (currently ~60 bps of CML portfolio) • Retail is only 9% of CML portfolio, of which 90% 1st lien mortgage Significant Pre-COVID Reduction to Regional Mall CRE Exposure • Recent originations almost exclusively focused on 1st lien mortgages • Negotiated consensual short-term forbearance and modification agreements together with new sponsor equity contributions Proactive CRE Management During COVID • Established additional $2B of committed repo facilities to further support on-demand liquidity • Deployed liquidity at attractive risk-adjusted returns as the economy stabilized during the 2nd half of 2020 Early COVID, Rebalanced Corporate Portfolio to Build Liquidity Before Going on Offense 1 2 3 4 APOLLO/ATHENE PREEMPTIVELY REPOSITIONED PORTFOLIOS PRIOR TO MARKET DISLOCATION 1. 36% of CLOs rated BB and 2% non-rated. Securities denoted as non-rated by the NRSRO were classified as investment or non-investment grade according to the security’s respective NAIC designation. With respect to modeled LBaSS, the NAIC designation methodology differs in significant respects from the NRSRO ratings methodology.
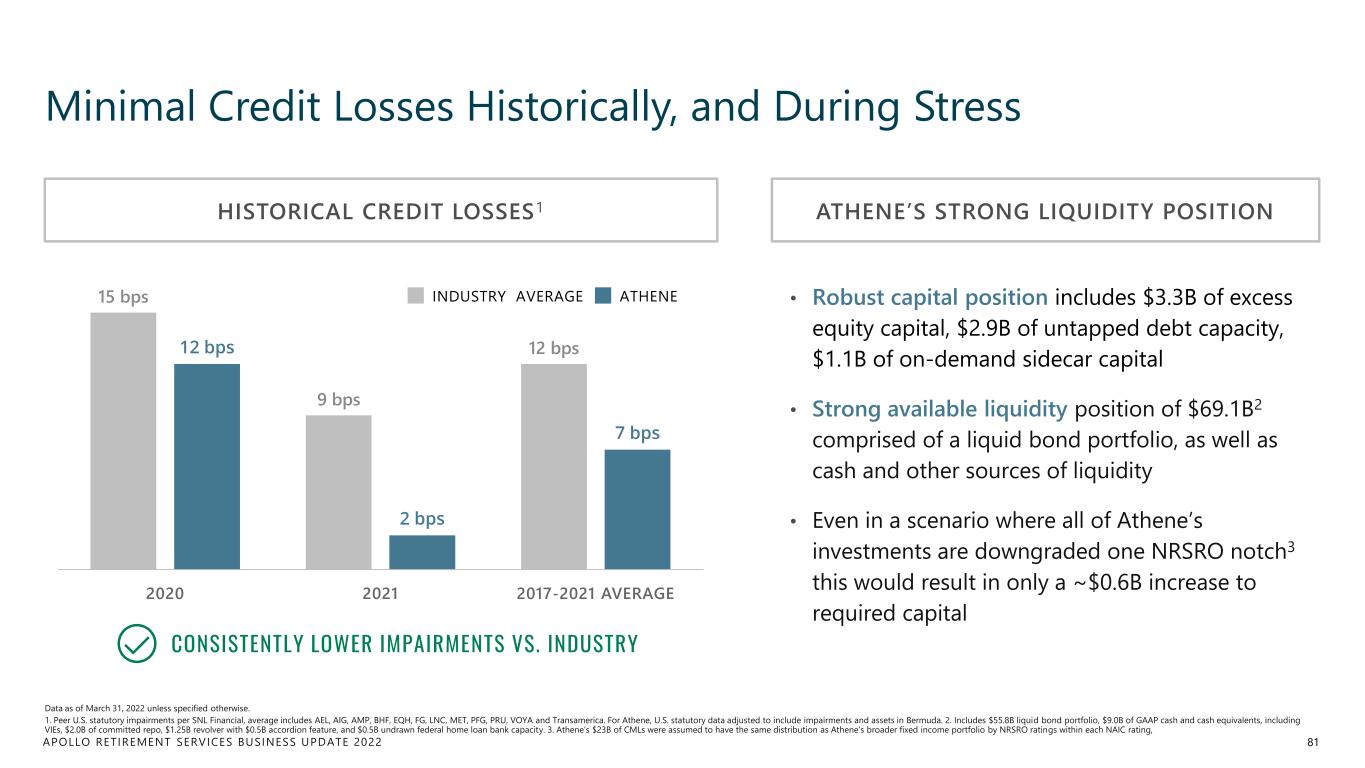
APOLLO RETIREMENT SERVICES BUSINESS UPDATE 2022 Minimal Credit Losses Historically, and During Stress Data as of March 31, 2022 unless specified otherwise. 1. Peer U.S. statutory impairments per SNL Financial, average includes AEL, AIG, AMP, BHF, EQH, FG, LNC, MET, PFG, PRU, VOYA and Transamerica. For Athene, U.S. statutory data adjusted to include impairments and assets in Bermuda. 2. Includes $55.8B liquid bond portfolio, $9.0B of GAAP cash and cash equivalents, including VIEs, $2.0B of committed repo, $1.25B revolver with $0.5B accordion feature, and $0.5B undrawn federal home loan bank capacity. 3. Athene’s $23B of CMLs were assumed to have the same distribution as Athene’s broader fixed income portfolio by NRSRO ratings within each NAIC rating, 81 ATHENEINDUSTRY AVERAGE15 bps 9 bps 12 bps12 bps 2 bps 7 bps 2020 2021 2017-2021 AVERAGE • Robust capital position includes $3.3B of excess equity capital, $2.9B of untapped debt capacity, $1.1B of on-demand sidecar capital • Strong available liquidity position of $69.1B2 comprised of a liquid bond portfolio, as well as cash and other sources of liquidity • Even in a scenario where all of Athene’s investments are downgraded one NRSRO notch3 this would result in only a ~$0.6B increase to required capital CONSISTENTLY LOWER IMPAIRMENTS VS. INDUSTRY HISTORICAL CREDIT LOSSES1 ATHENE’S STRONG LIQUIDITY POSITION

Asset Class Spotlight: Structured Credit BRET LEAS Partner, Structured Credit, Apollo
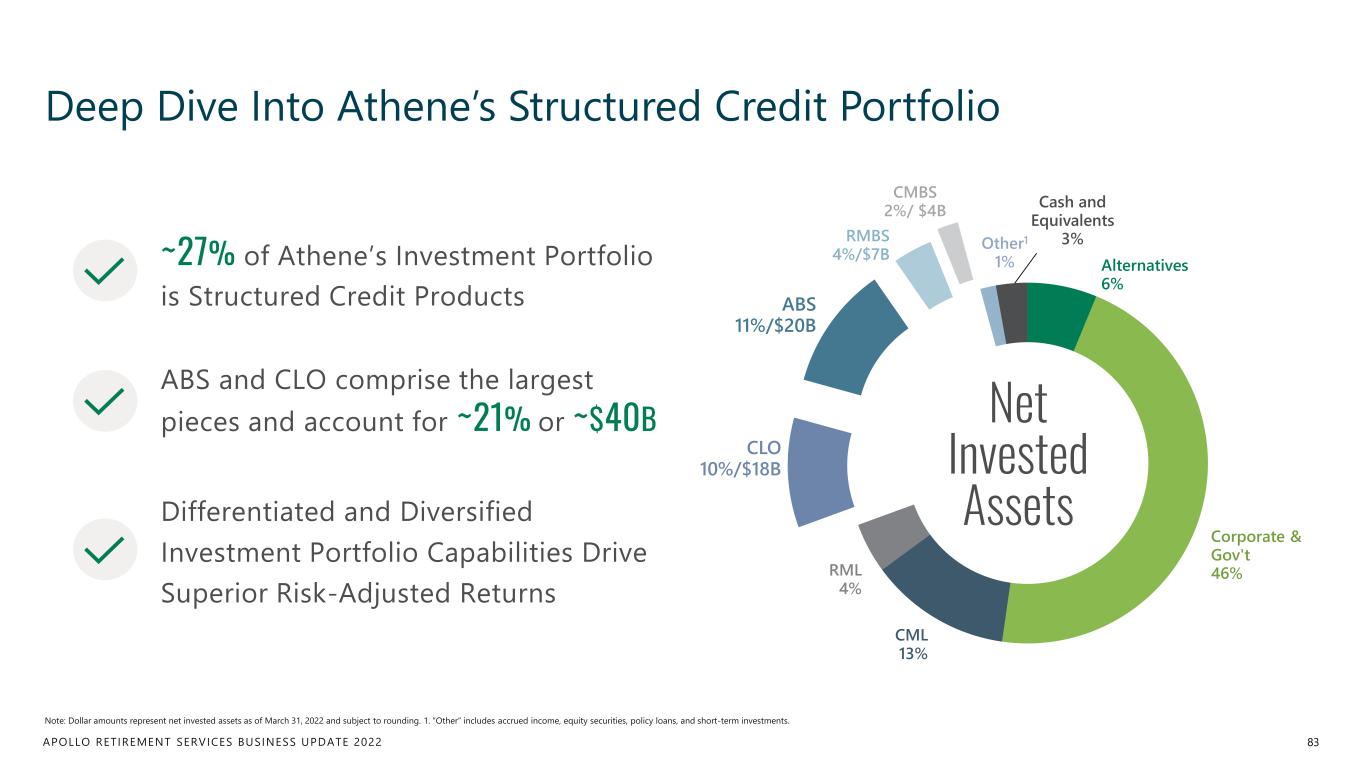
APOLLO RETIREMENT SERVICES BUSINESS UPDATE 2022 Deep Dive Into Athene’s Structured Credit Portfolio 83 Note: Dollar amounts represent net invested assets as of March 31, 2022 and subject to rounding. 1. “Other” includes accrued income, equity securities, policy loans, and short-term investments. ~27% of Athene’s Investment Portfolio is Structured Credit Products ABS and CLO comprise the largest pieces and account for ~21% or ~$40B Differentiated and Diversified Investment Portfolio Capabilities Drive Superior Risk-Adjusted Returns Alternatives 6% Corporate & Gov't 46% CML 13% RML 4% CLO 10%/$18B ABS 11%/$20B RMBS 4%/$7B CMBS 2%/ $4B Other1 1% Cash and Equivalents 3% Net Invested Assets
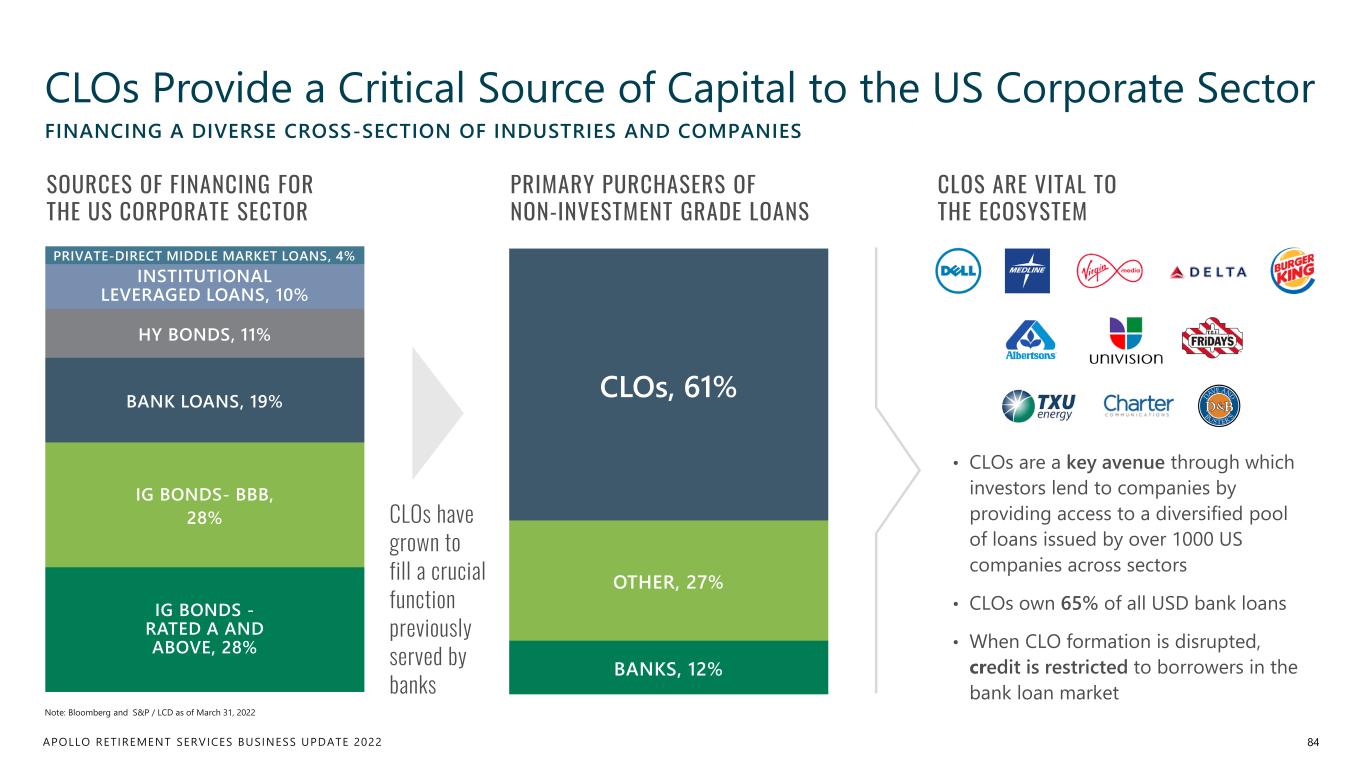
APOLLO RETIREMENT SERVICES BUSINESS UPDATE 2022 BANKS, 12% OTHER, 27% CLOs, 61% IG BONDS - RATED A AND ABOVE, 28% IG BONDS- BBB, 28% BANK LOANS, 19% HY BONDS, 11% INSTITUTIONAL LEVERAGED LOANS, 10% PRIVATE-DIRECT MIDDLE MARKET LOANS, 4% CLOs Provide a Critical Source of Capital to the US Corporate Sector 84 Note: Bloomberg and S&P / LCD as of March 31, 2022 FINANCING A DIVERSE CROSS-SECTION OF INDUSTRIES AND COMPANIES CLOs have grown to fill a crucial function previously served by banks • CLOs are a key avenue through which investors lend to companies by providing access to a diversified pool of loans issued by over 1000 US companies across sectors • CLOs own 65% of all USD bank loans • When CLO formation is disrupted, credit is restricted to borrowers in the bank loan market SOURCES OF FINANCING FOR THE US CORPORATE SECTOR PRIMARY PURCHASERS OF NON-INVESTMENT GRADE LOANS CLOS ARE VITAL TO THE ECOSYSTEM
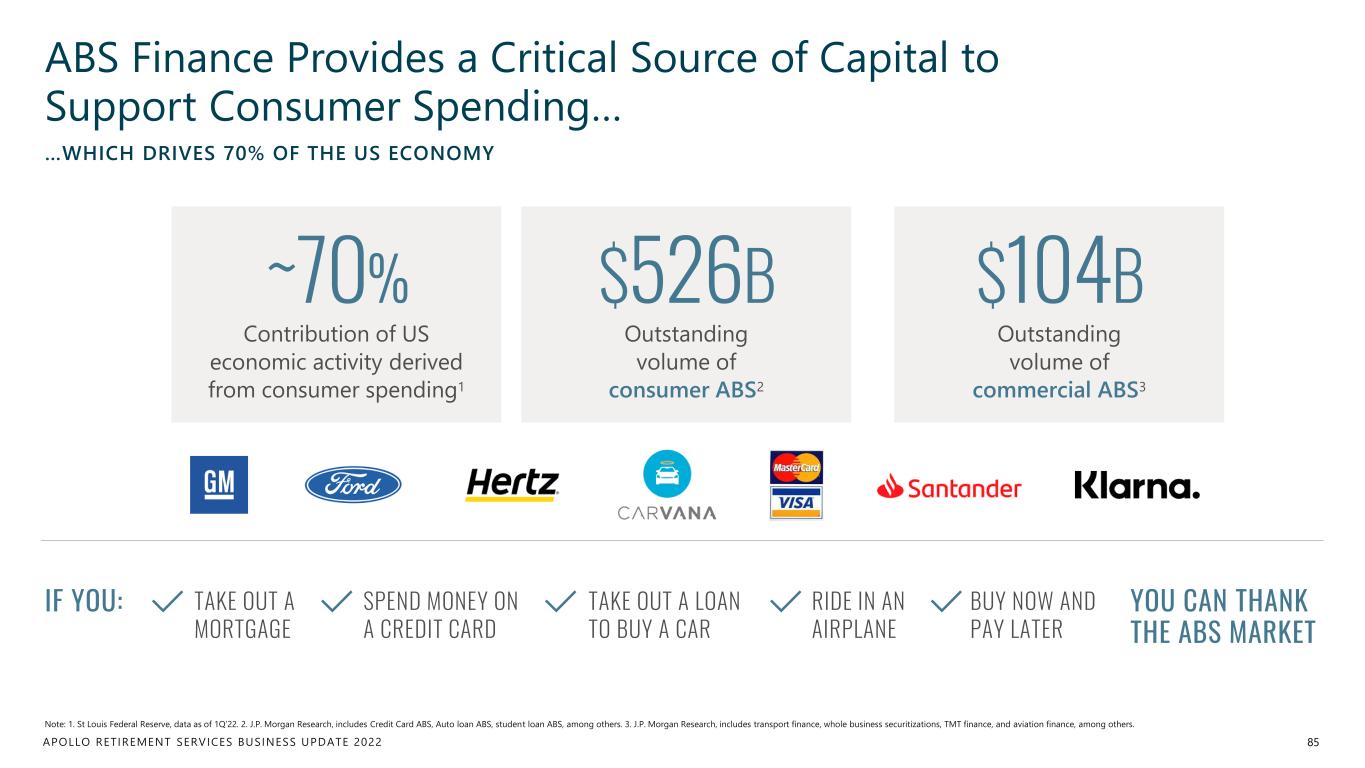
APOLLO RETIREMENT SERVICES BUSINESS UPDATE 2022 ABS Finance Provides a Critical Source of Capital to Support Consumer Spending… 85 Note: 1. St Louis Federal Reserve, data as of 1Q’22. 2. J.P. Morgan Research, includes Credit Card ABS, Auto loan ABS, student loan ABS, among others. 3. J.P. Morgan Research, includes transport finance, whole business securitizations, TMT finance, and aviation finance, among others. …WHICH DRIVES 70% OF THE US ECONOMY ~70% Contribution of US economic activity derived from consumer spending1 $526B Outstanding volume of consumer ABS2 $104B Outstanding volume of commercial ABS3 IF YOU: YOU CAN THANK THE ABS MARKET TAKE OUT A MORTGAGE SPEND MONEY ON A CREDIT CARD TAKE OUT A LOAN TO BUY A CAR RIDE IN AN AIRPLANE BUY NOW AND PAY LATER
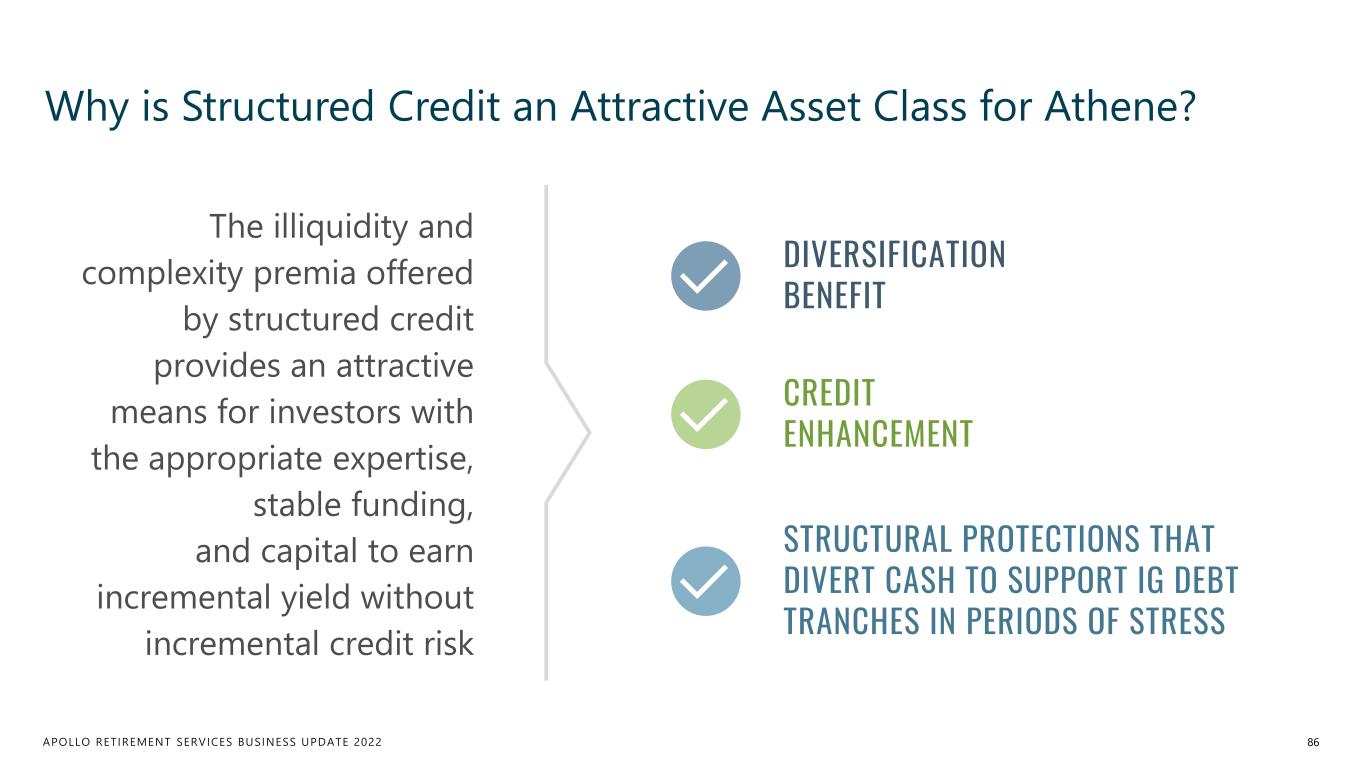
APOLLO RETIREMENT SERVICES BUSINESS UPDATE 2022 Why is Structured Credit an Attractive Asset Class for Athene? 86 The illiquidity and complexity premia offered by structured credit provides an attractive means for investors with the appropriate expertise, stable funding, and capital to earn incremental yield without incremental credit risk STRUCTURAL PROTECTIONS THAT DIVERT CASH TO SUPPORT IG DEBT TRANCHES IN PERIODS OF STRESS CREDIT ENHANCEMENT DIVERSIFICATION BENEFIT
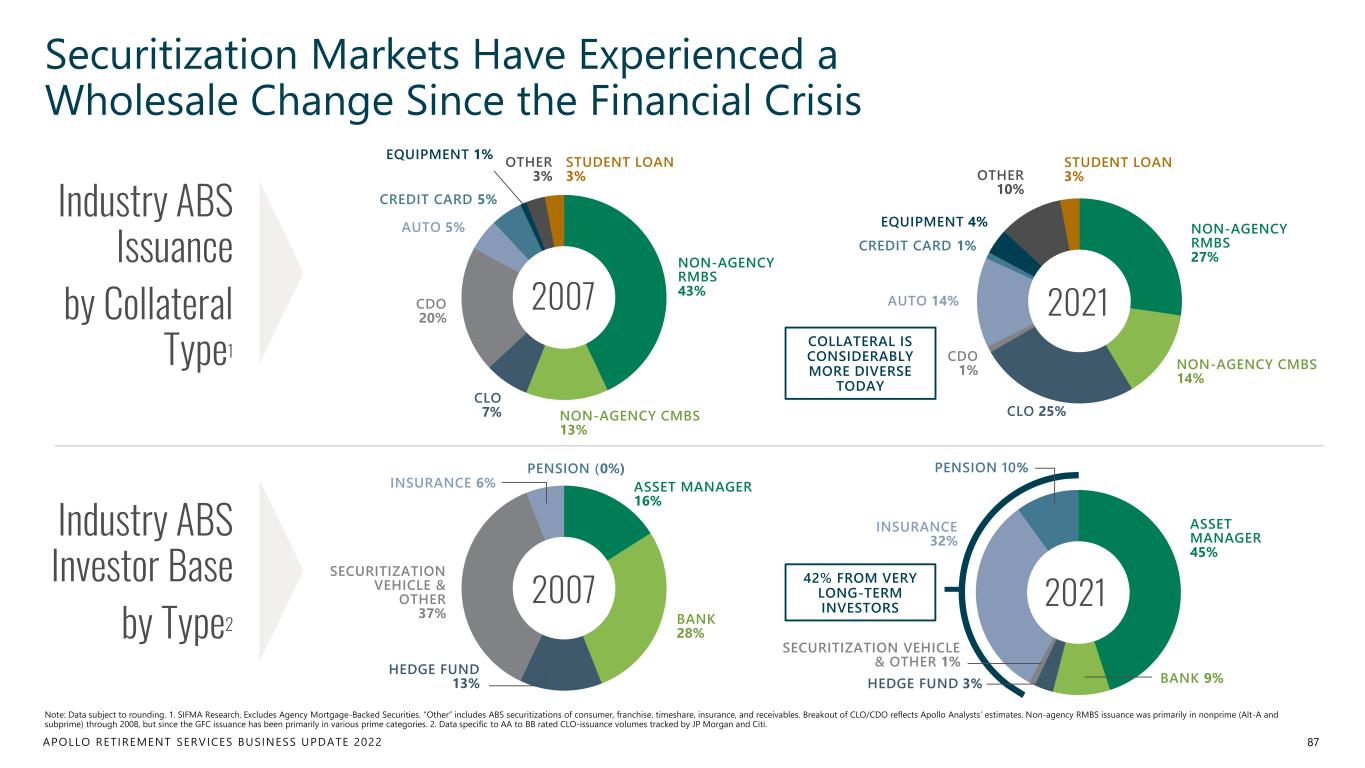
APOLLO RETIREMENT SERVICES BUSINESS UPDATE 2022 20212007 2007 Securitization Markets Have Experienced a Wholesale Change Since the Financial Crisis Industry ABS Issuance by Collateral Type1 Note: Data subject to rounding. 1. SIFMA Research. Excludes Agency Mortgage-Backed Securities. “Other” includes ABS securitizations of consumer, franchise, timeshare, insurance, and receivables. Breakout of CLO/CDO reflects Apollo Analysts’ estimates. Non-agency RMBS issuance was primarily in nonprime (Alt-A and subprime) through 2008, but since the GFC issuance has been primarily in various prime categories. 2. Data specific to AA to BB rated CLO-issuance volumes tracked by JP Morgan and Citi. 87 2021 OTHER 3% STUDENT LOAN 3% EQUIPMENT 1% CREDIT CARD 5% AUTO 5% CDO 20% CLO 7% NON-AGENCY CMBS 13% NON-AGENCY RMBS 43% OTHER 10% STUDENT LOAN 3% EQUIPMENT 4% CREDIT CARD 1% AUTO 14% CDO 1% CLO 25% NON-AGENCY CMBS 14% NON-AGENCY RMBS 27% COLLATERAL IS CONSIDERABLY MORE DIVERSE TODAY PENSION (0%) INSURANCE 6% SECURITIZATION VEHICLE & OTHER 37% HEDGE FUND 13% BANK 28% ASSET MANAGER 16% Industry ABS Investor Base by Type2 PENSION 10% INSURANCE 32% SECURITIZATION VEHICLE & OTHER 1% HEDGE FUND 3% BANK 9% ASSET MANAGER 45% 42% FROM VERY LONG-TERM INVESTORS
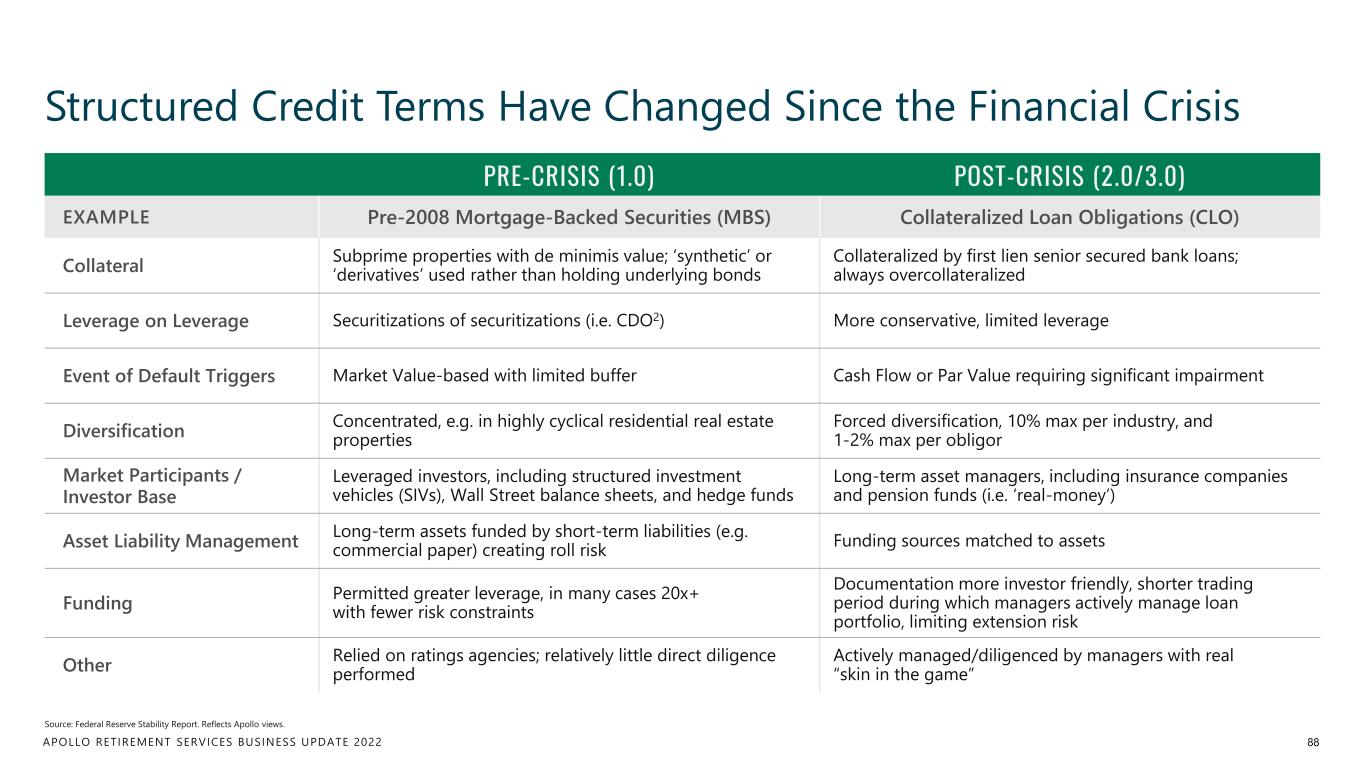
APOLLO RETIREMENT SERVICES BUSINESS UPDATE 2022 Structured Credit Terms Have Changed Since the Financial Crisis 88 Source: Federal Reserve Stability Report. Reflects Apollo views. PRE-CRISIS (1.0) POST-CRISIS (2.0/3.0) EXAMPLE Pre-2008 Mortgage-Backed Securities (MBS) Collateralized Loan Obligations (CLO) Collateral Subprime properties with de minimis value; ‘synthetic’ or ‘derivatives’ used rather than holding underlying bonds Collateralized by first lien senior secured bank loans; always overcollateralized Leverage on Leverage Securitizations of securitizations (i.e. CDO2) More conservative, limited leverage Event of Default Triggers Market Value-based with limited buffer Cash Flow or Par Value requiring significant impairment Diversification Concentrated, e.g. in highly cyclical residential real estate properties Forced diversification, 10% max per industry, and 1-2% max per obligor Market Participants / Investor Base Leveraged investors, including structured investment vehicles (SIVs), Wall Street balance sheets, and hedge funds Long-term asset managers, including insurance companies and pension funds (i.e. ‘real-money’) Asset Liability Management Long-term assets funded by short-term liabilities (e.g. commercial paper) creating roll risk Funding sources matched to assets Funding Permitted greater leverage, in many cases 20x+ with fewer risk constraints Documentation more investor friendly, shorter trading period during which managers actively manage loan portfolio, limiting extension risk Other Relied on ratings agencies; relatively little direct diligence performed Actively managed/diligenced by managers with real “skin in the game”
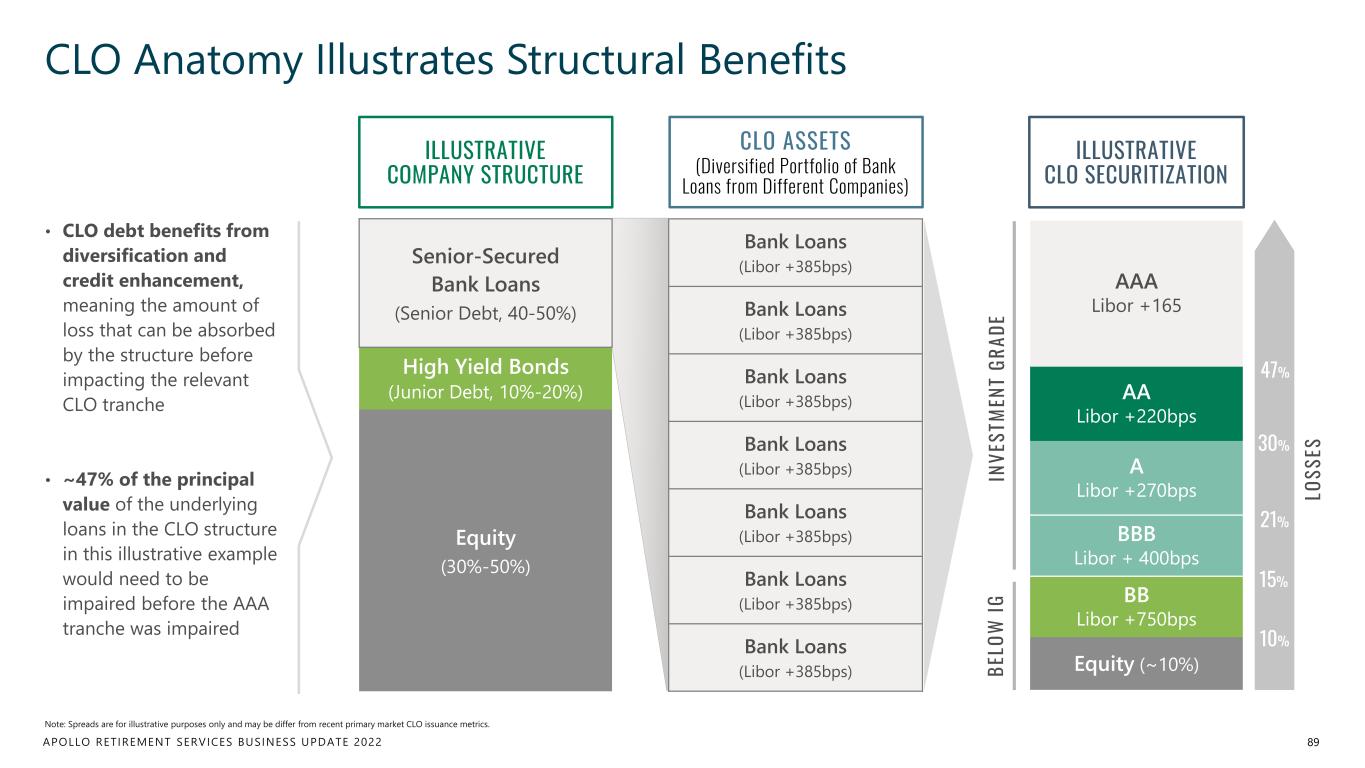
APOLLO RETIREMENT SERVICES BUSINESS UPDATE 2022 CLO Anatomy Illustrates Structural Benefits 89 Note: Spreads are for illustrative purposes only and may be differ from recent primary market CLO issuance metrics. • CLO debt benefits from diversification and credit enhancement, meaning the amount of loss that can be absorbed by the structure before impacting the relevant CLO tranche • ~47% of the principal value of the underlying loans in the CLO structure in this illustrative example would need to be impaired before the AAA tranche was impaired ILLUSTRATIVE COMPANY STRUCTURE CLO ASSETS (Diversified Portfolio of Bank Loans from Different Companies) AAA Libor +165 AA Libor +220bps A Libor +270bps BBB Libor + 400bps BB Libor +750bps Equity (~10%) ILLUSTRATIVE CLO SECURITIZATION 47% 30% 21% 15% 10% IN VE ST M EN T GR AD E BE LO W IG LO SS ES Senior-Secured Bank Loans (Senior Debt, 40-50%) High Yield Bonds (Junior Debt, 10%-20%) Equity (30%-50%) Bank Loans (Libor +385bps) Bank Loans (Libor +385bps) Bank Loans (Libor +385bps) Bank Loans (Libor +385bps) Bank Loans (Libor +385bps) Bank Loans (Libor +385bps) Bank Loans (Libor +385bps) IN VE ST M EN T GR AD E
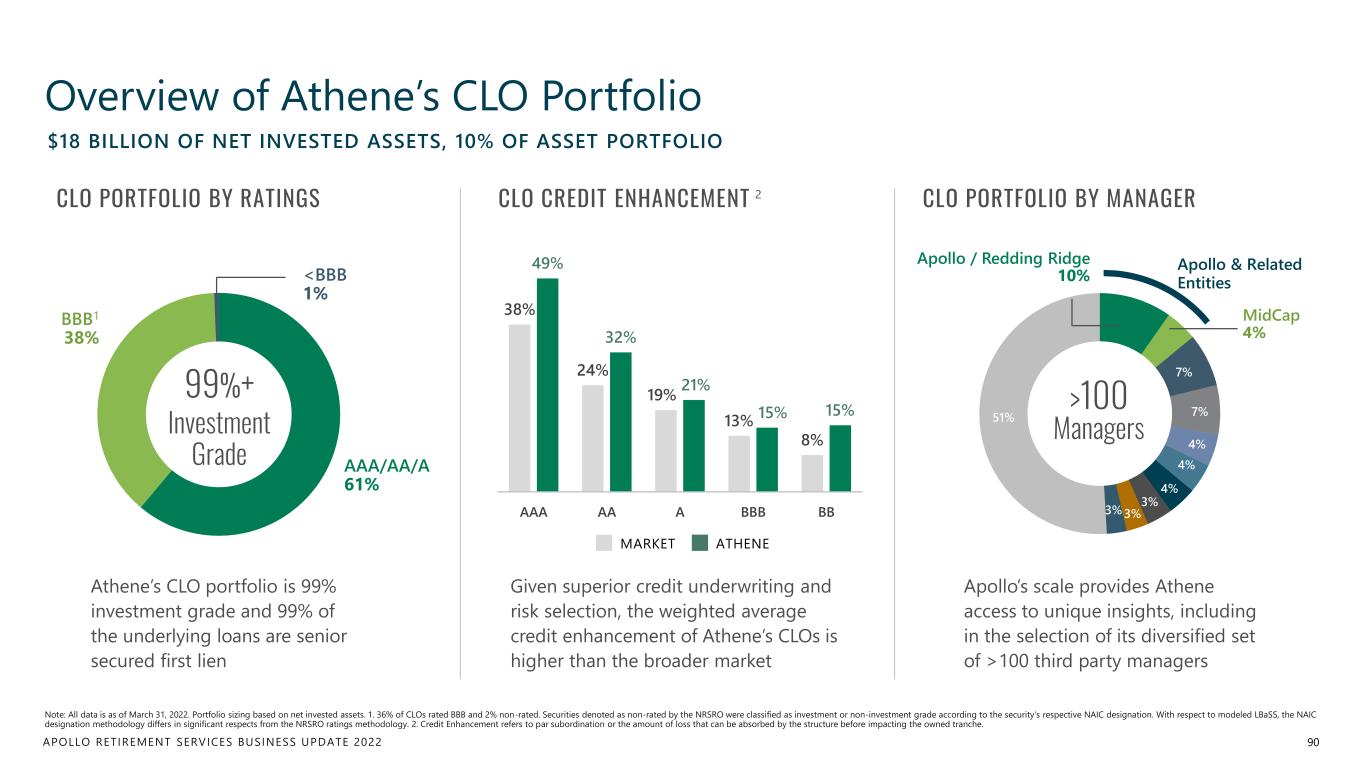
APOLLO RETIREMENT SERVICES BUSINESS UPDATE 2022 AAA/AA/A 61% BBB1 38% <BBB 1% Overview of Athene’s CLO Portfolio 90 Note: All data is as of March 31, 2022. Portfolio sizing based on net invested assets. 1. 36% of CLOs rated BBB and 2% non-rated. Securities denoted as non-rated by the NRSRO were classified as investment or non-investment grade according to the security's respective NAIC designation. With respect to modeled LBaSS, the NAIC designation methodology differs in significant respects from the NRSRO ratings methodology. 2. Credit Enhancement refers to par subordination or the amount of loss that can be absorbed by the structure before impacting the owned tranche. $18 BILLION OF NET INVESTED ASSETS, 10% OF ASSET PORTFOLIO CLO PORTFOLIO BY RATINGS CLO PORTFOLIO BY MANAGERCLO CREDIT ENHANCEMENT 2 Apollo / Redding Ridge 10% MidCap 4% 7% 7% 4% 4% 4% 3% 3%3% 51% >100 Managers Apollo & Related Entities 99%+ Investment Grade 38% 24% 19% 13% 8% 49% 32% 21% 15% 15% AAA AA A BBB BB ATHENEMARKET Athene’s CLO portfolio is 99% investment grade and 99% of the underlying loans are senior secured first lien Given superior credit underwriting and risk selection, the weighted average credit enhancement of Athene’s CLOs is higher than the broader market Apollo’s scale provides Athene access to unique insights, including in the selection of its diversified set of >100 third party managers
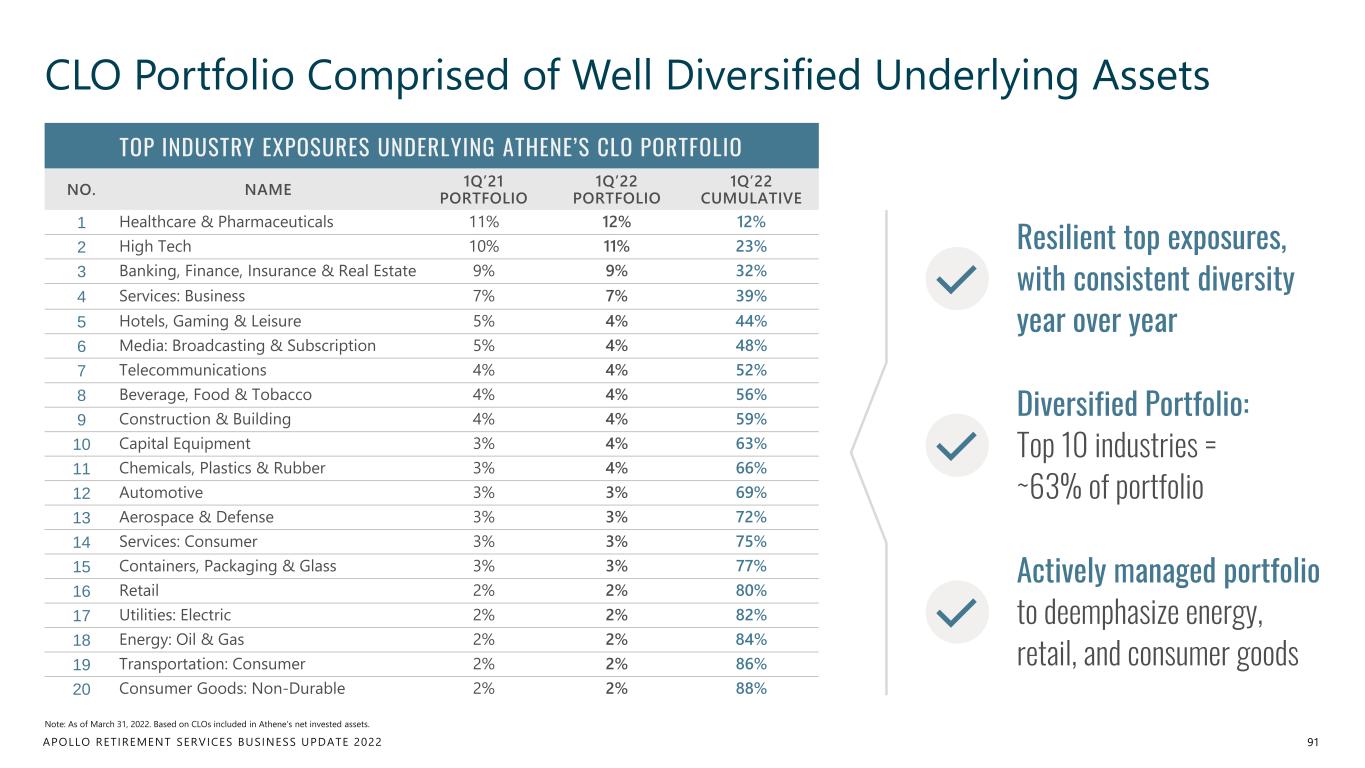
APOLLO RETIREMENT SERVICES BUSINESS UPDATE 2022 CLO Portfolio Comprised of Well Diversified Underlying Assets 91 Note: As of March 31, 2022. Based on CLOs included in Athene’s net invested assets. TOP INDUSTRY EXPOSURES UNDERLYING ATHENE’S CLO PORTFOLIO NO. NAME 1Q’21 PORTFOLIO 1Q’22 PORTFOLIO 1Q’22 CUMULATIVE 1 Healthcare & Pharmaceuticals 11% 12% 12% 2 High Tech 10% 11% 23% 3 Banking, Finance, Insurance & Real Estate 9% 9% 32% 4 Services: Business 7% 7% 39% 5 Hotels, Gaming & Leisure 5% 4% 44% 6 Media: Broadcasting & Subscription 5% 4% 48% 7 Telecommunications 4% 4% 52% 8 Beverage, Food & Tobacco 4% 4% 56% 9 Construction & Building 4% 4% 59% 10 Capital Equipment 3% 4% 63% 11 Chemicals, Plastics & Rubber 3% 4% 66% 12 Automotive 3% 3% 69% 13 Aerospace & Defense 3% 3% 72% 14 Services: Consumer 3% 3% 75% 15 Containers, Packaging & Glass 3% 3% 77% 16 Retail 2% 2% 80% 17 Utilities: Electric 2% 2% 82% 18 Energy: Oil & Gas 2% 2% 84% 19 Transportation: Consumer 2% 2% 86% 20 Consumer Goods: Non-Durable 2% 2% 88% Diversified Portfolio: Top 10 industries = ~63% of portfolio Actively managed portfolio to deemphasize energy, retail, and consumer goods Resilient top exposures, with consistent diversity year over year
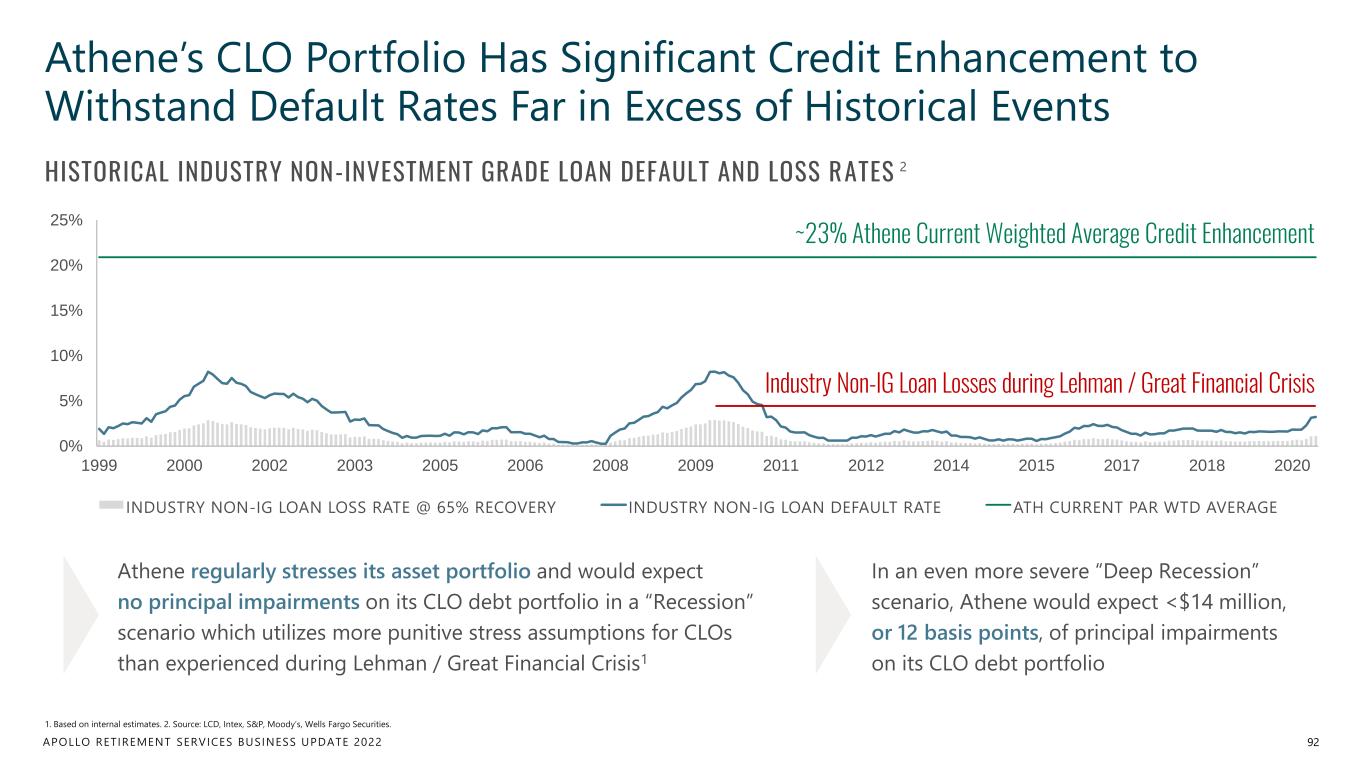
APOLLO RETIREMENT SERVICES BUSINESS UPDATE 2022 0% 5% 10% 15% 20% 25% 1999 2000 2002 2003 2005 2006 2008 2009 2011 2012 2014 2015 2017 2018 2020 INDUSTRY NON-IG LOAN LOSS RATE @ 65% RECOVERY INDUSTRY NON-IG LOAN DEFAULT RATE ATH CURRENT PAR WTD AVERAGE Athene’s CLO Portfolio Has Significant Credit Enhancement to Withstand Default Rates Far in Excess of Historical Events 92 1. Based on internal estimates. 2. Source: LCD, Intex, S&P, Moody’s, Wells Fargo Securities. HISTORICAL INDUSTRY NON-INVESTMENT GRADE LOAN DEFAULT AND LOSS RATES 2 Athene regularly stresses its asset portfolio and would expect no principal impairments on its CLO debt portfolio in a “Recession” scenario which utilizes more punitive stress assumptions for CLOs than experienced during Lehman / Great Financial Crisis1 In an even more severe “Deep Recession” scenario, Athene would expect <$14 million, or 12 basis points, of principal impairments on its CLO debt portfolio ~23% Athene Current Weighted Average Credit Enhancement Industry Non-IG Loan Losses during Lehman / Great Financial Crisis
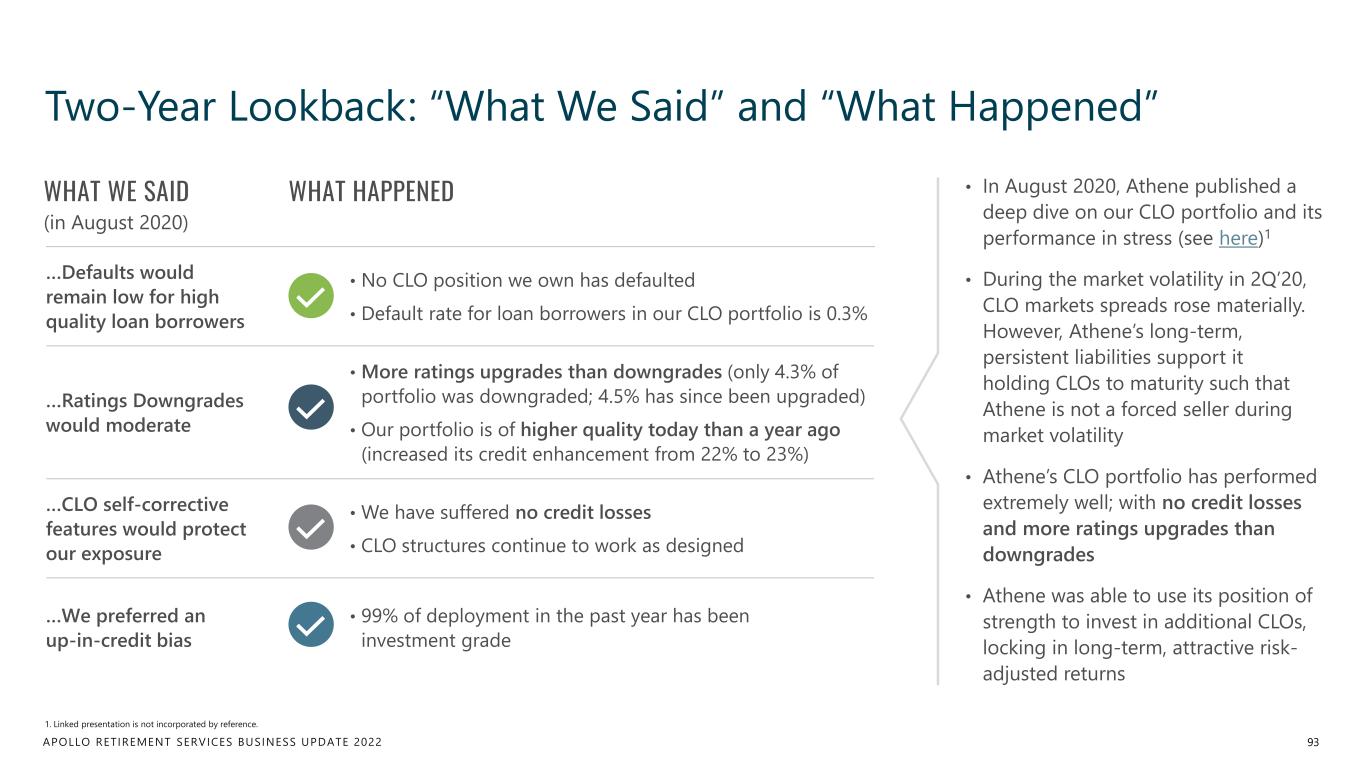
APOLLO RETIREMENT SERVICES BUSINESS UPDATE 2022 Two-Year Lookback: “What We Said” and “What Happened” 93 1. Linked presentation is not incorporated by reference. …Defaults would remain low for high quality loan borrowers • No CLO position we own has defaulted • Default rate for loan borrowers in our CLO portfolio is 0.3% …Ratings Downgrades would moderate • More ratings upgrades than downgrades (only 4.3% of portfolio was downgraded; 4.5% has since been upgraded) • Our portfolio is of higher quality today than a year ago (increased its credit enhancement from 22% to 23%) …CLO self-corrective features would protect our exposure • We have suffered no credit losses • CLO structures continue to work as designed …We preferred an up-in-credit bias • 99% of deployment in the past year has been investment grade WHAT WE SAID (in August 2020) WHAT HAPPENED • In August 2020, Athene published a deep dive on our CLO portfolio and its performance in stress (see here)1 • During the market volatility in 2Q’20, CLO markets spreads rose materially. However, Athene’s long-term, persistent liabilities support it holding CLOs to maturity such that Athene is not a forced seller during market volatility • Athene’s CLO portfolio has performed extremely well; with no credit losses and more ratings upgrades than downgrades • Athene was able to use its position of strength to invest in additional CLOs, locking in long-term, attractive risk- adjusted returns
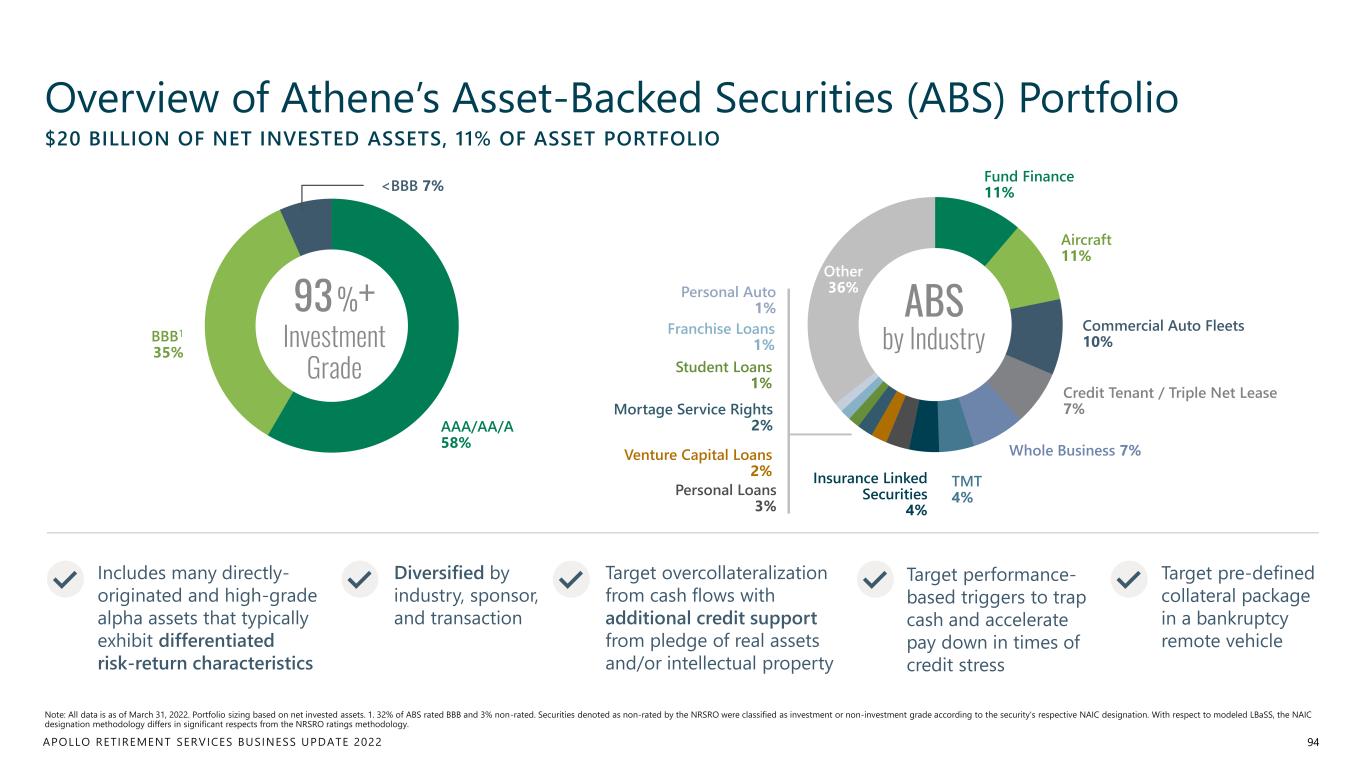
APOLLO RETIREMENT SERVICES BUSINESS UPDATE 2022 AAA/AA/A 58% BBB1 35% <BBB 7% 93 %+ Investment Grade Overview of Athene’s Asset-Backed Securities (ABS) Portfolio 94 Note: All data is as of March 31, 2022. Portfolio sizing based on net invested assets. 1. 32% of ABS rated BBB and 3% non-rated. Securities denoted as non-rated by the NRSRO were classified as investment or non-investment grade according to the security's respective NAIC designation. With respect to modeled LBaSS, the NAIC designation methodology differs in significant respects from the NRSRO ratings methodology. $20 BILLION OF NET INVESTED ASSETS, 11% OF ASSET PORTFOLIO Fund Finance 11% Aircraft 11% Commercial Auto Fleets 10% Credit Tenant / Triple Net Lease 7% Whole Business 7% TMT 4% Insurance Linked Securities 4% Personal Loans 3% Venture Capital Loans 2% Mortage Service Rights 2% Student Loans 1% Franchise Loans 1% Personal Auto 1% Other 36% ABS by Industry Includes many directly- originated and high-grade alpha assets that typically exhibit differentiated risk-return characteristics Diversified by industry, sponsor, and transaction Target overcollateralization from cash flows with additional credit support from pledge of real assets and/or intellectual property Target performance- based triggers to trap cash and accelerate pay down in times of credit stress Target pre-defined collateral package in a bankruptcy remote vehicle
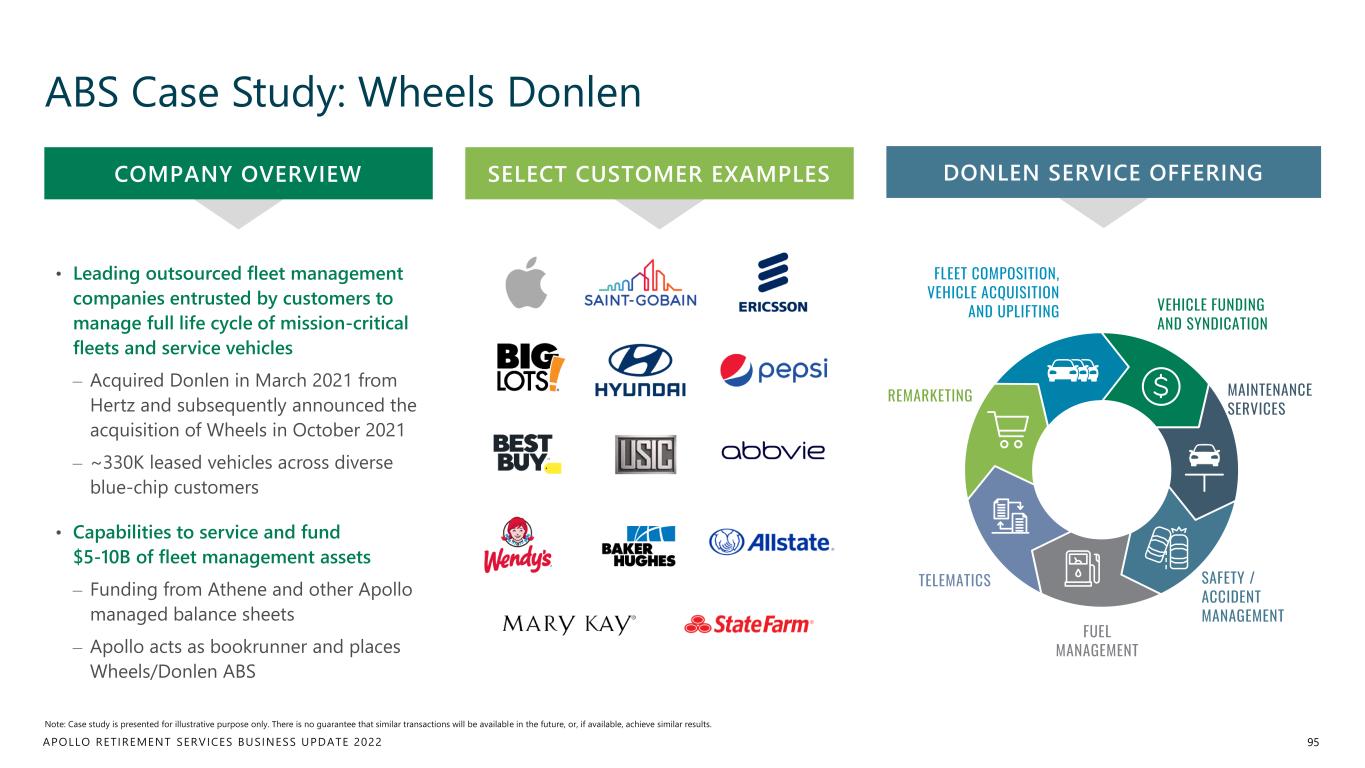
APOLLO RETIREMENT SERVICES BUSINESS UPDATE 2022 ABS Case Study: Wheels Donlen 95 Note: Case study is presented for illustrative purpose only. There is no guarantee that similar transactions will be available in the future, or, if available, achieve similar results. COMPANY OVERVIEW • Leading outsourced fleet management companies entrusted by customers to manage full life cycle of mission-critical fleets and service vehicles – Acquired Donlen in March 2021 from Hertz and subsequently announced the acquisition of Wheels in October 2021 – ~330K leased vehicles across diverse blue-chip customers • Capabilities to service and fund $5-10B of fleet management assets – Funding from Athene and other Apollo managed balance sheets – Apollo acts as bookrunner and places Wheels/Donlen ABS SELECT CUSTOMER EXAMPLES DONLEN SERVICE OFFERING MAINTENANCE SERVICES REMARKETING FLEET COMPOSITION, VEHICLE ACQUISITION AND UPLIFTING VEHICLE FUNDING AND SYNDICATION SAFETY / ACCIDENT MANAGEMENT FUEL MANAGEMENT TELEMATICS
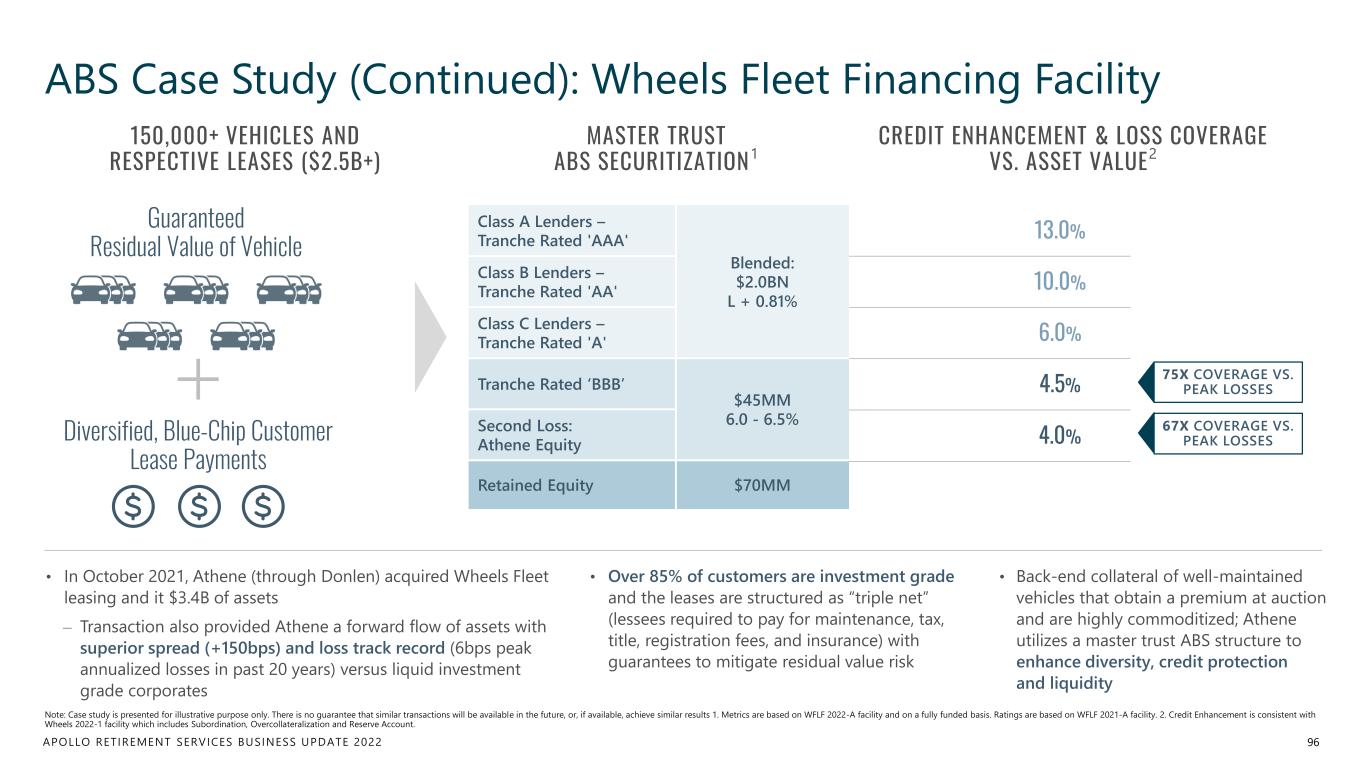
APOLLO RETIREMENT SERVICES BUSINESS UPDATE 2022 13.0% 10.0% 6.0% 4.5% 4.0% ABS Case Study (Continued): Wheels Fleet Financing Facility 96 Note: Case study is presented for illustrative purpose only. There is no guarantee that similar transactions will be available in the future, or, if available, achieve similar results 1. Metrics are based on WFLF 2022-A facility and on a fully funded basis. Ratings are based on WFLF 2021-A facility. 2. Credit Enhancement is consistent with Wheels 2022-1 facility which includes Subordination, Overcollateralization and Reserve Account. MASTER TRUST ABS SECURITIZATION1 CREDIT ENHANCEMENT & LOSS COVERAGE VS. ASSET VALUE2 150,000+ VEHICLES AND RESPECTIVE LEASES ($2.5B+) Guaranteed Residual Value of Vehicle • In October 2021, Athene (through Donlen) acquired Wheels Fleet leasing and it $3.4B of assets – Transaction also provided Athene a forward flow of assets with superior spread (+150bps) and loss track record (6bps peak annualized losses in past 20 years) versus liquid investment grade corporates Class A Lenders – Tranche Rated 'AAA' Blended: $2.0BN L + 0.81% Class B Lenders – Tranche Rated 'AA' Class C Lenders – Tranche Rated 'A' Tranche Rated ‘BBB’ $45MM 6.0 - 6.5%Second Loss: Athene Equity Retained Equity $70MM • Over 85% of customers are investment grade and the leases are structured as “triple net” (lessees required to pay for maintenance, tax, title, registration fees, and insurance) with guarantees to mitigate residual value risk • Back-end collateral of well-maintained vehicles that obtain a premium at auction and are highly commoditized; Athene utilizes a master trust ABS structure to enhance diversity, credit protection and liquidity Diversified, Blue-Chip Customer Lease Payments 75X COVERAGE VS. PEAK LOSSES 67X COVERAGE VS. PEAK LOSSES
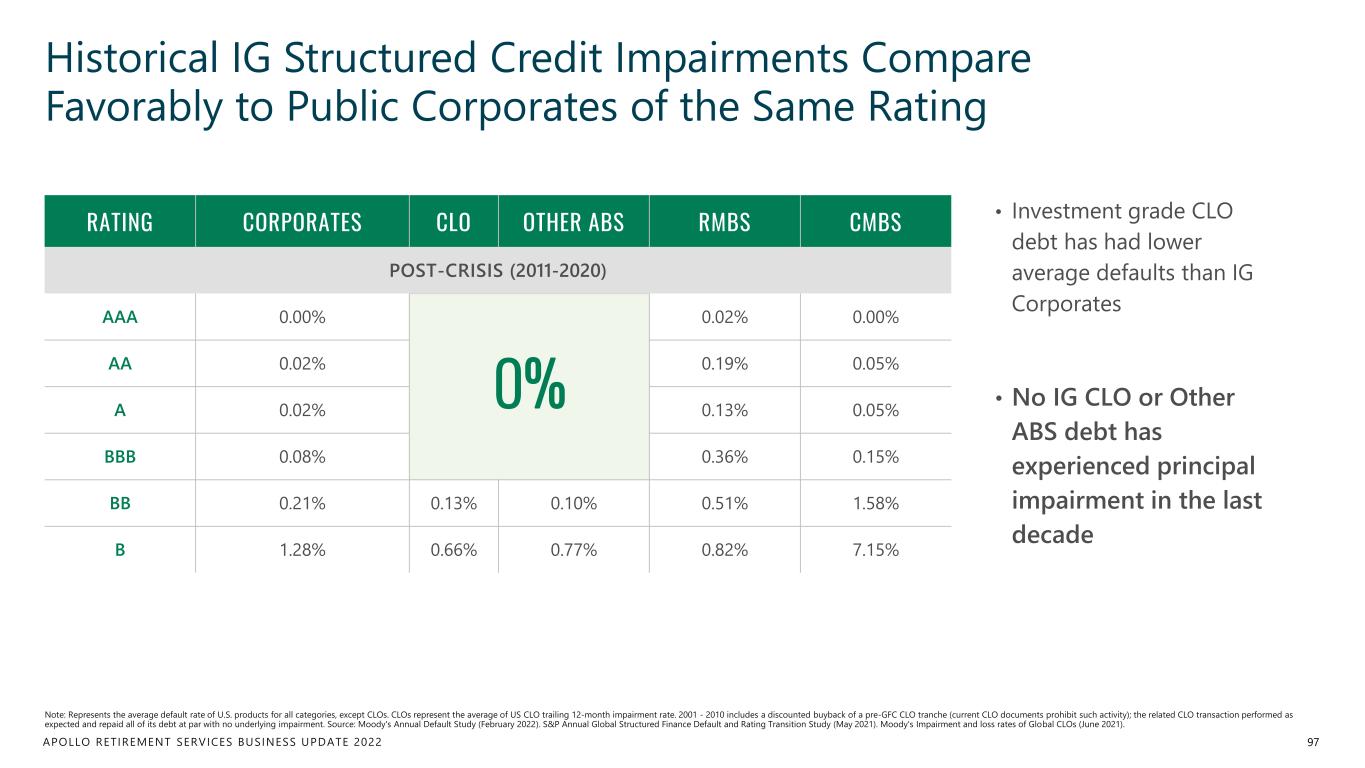
APOLLO RETIREMENT SERVICES BUSINESS UPDATE 2022 Historical IG Structured Credit Impairments Compare Favorably to Public Corporates of the Same Rating • Investment grade CLO debt has had lower average defaults than IG Corporates • No IG CLO or Other ABS debt has experienced principal impairment in the last decade Note: Represents the average default rate of U.S. products for all categories, except CLOs. CLOs represent the average of US CLO trailing 12-month impairment rate. 2001 - 2010 includes a discounted buyback of a pre-GFC CLO tranche (current CLO documents prohibit such activity); the related CLO transaction performed as expected and repaid all of its debt at par with no underlying impairment. Source: Moody's Annual Default Study (February 2022). S&P Annual Global Structured Finance Default and Rating Transition Study (May 2021). Moody's Impairment and loss rates of Global CLOs (June 2021). 97 RATING CORPORATES CLO OTHER ABS RMBS CMBS POST-CRISIS (2011-2020) AAA 0.00% 0% 0.02% 0.00% AA 0.02% 0.19% 0.05% A 0.02% 0.13% 0.05% BBB 0.08% 0.36% 0.15% BB 0.21% 0.13% 0.10% 0.51% 1.58% B 1.28% 0.66% 0.77% 0.82% 7.15%

Asset Class Spotlight: Commercial Real Estate SCOTT WEINER Partner, Commercial Real Estate, Apollo
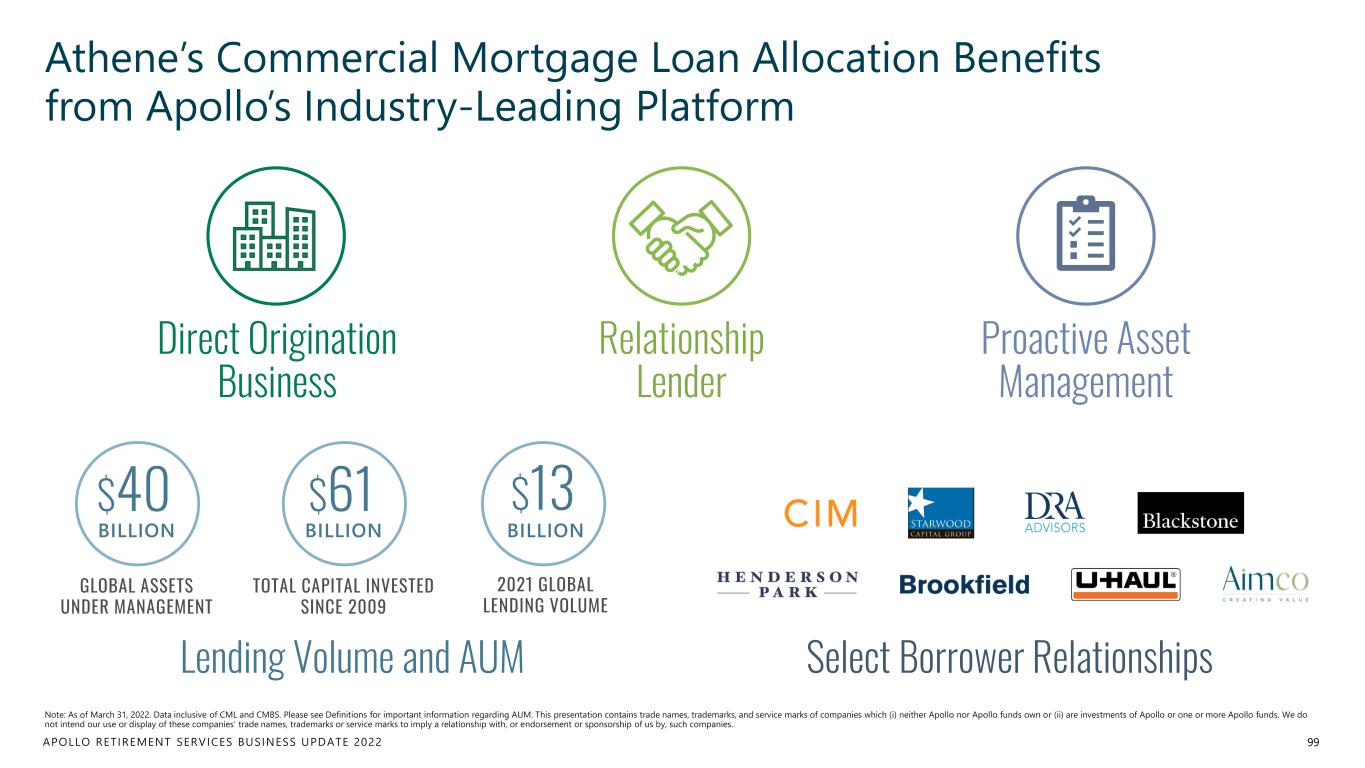
APOLLO RETIREMENT SERVICES BUSINESS UPDATE 2022 Athene’s Commercial Mortgage Loan Allocation Benefits from Apollo’s Industry-Leading Platform 99 Note: As of March 31, 2022. Data inclusive of CML and CMBS. Please see Definitions for important information regarding AUM. This presentation contains trade names, trademarks, and service marks of companies which (i) neither Apollo nor Apollo funds own or (ii) are investments of Apollo or one or more Apollo funds. We do not intend our use or display of these companies’ trade names, trademarks or service marks to imply a relationship with, or endorsement or sponsorship of us by, such companies. Lending Volume and AUM $40 GLOBAL ASSETS UNDER MANAGEMENT BILLION $13 2021 GLOBAL LENDING VOLUME BILLION $61 TOTAL CAPITAL INVESTED SINCE 2009 BILLION Relationship Lender Direct Origination Business Proactive Asset Management Select Borrower Relationships
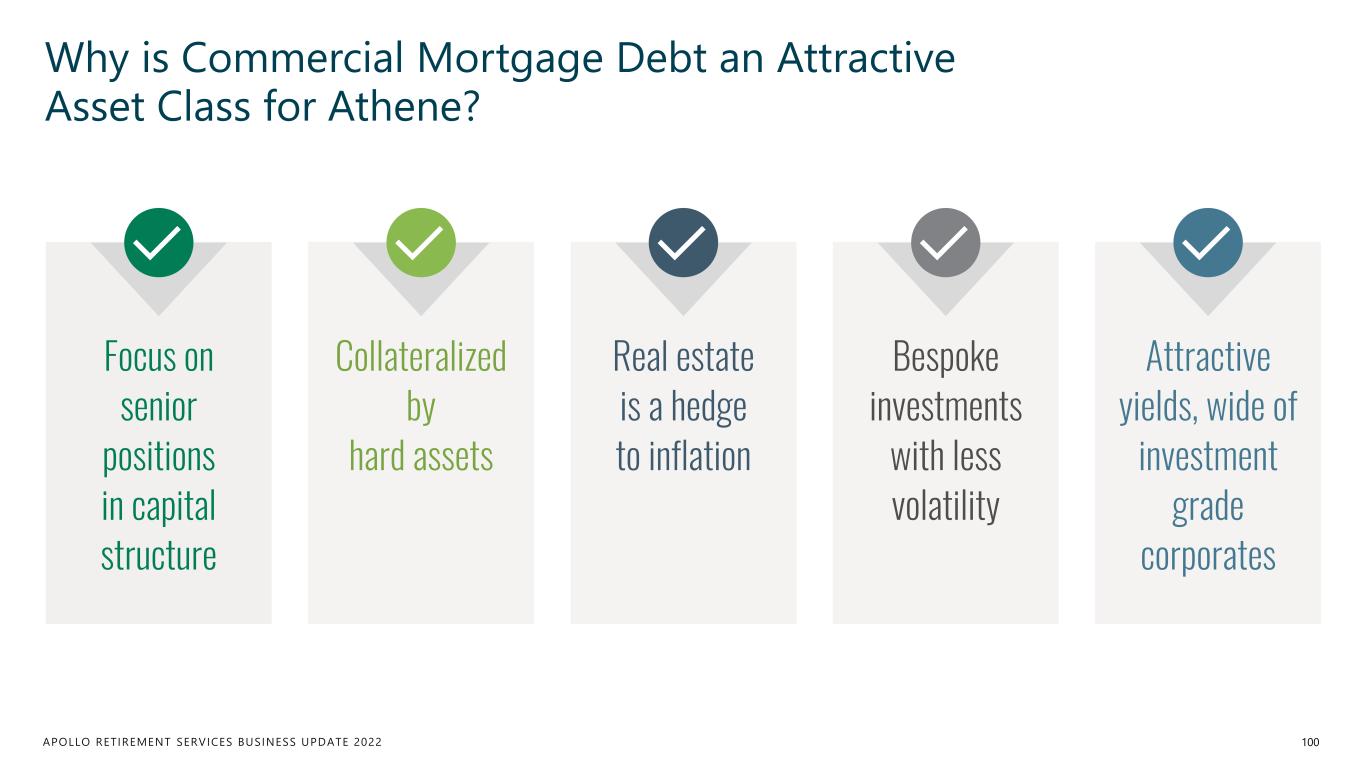
APOLLO RETIREMENT SERVICES BUSINESS UPDATE 2022 Why is Commercial Mortgage Debt an Attractive Asset Class for Athene? 100 Focus on senior positions in capital structure Collateralized by hard assets Real estate is a hedge to inflation Bespoke investments with less volatility Attractive yields, wide of investment grade corporates
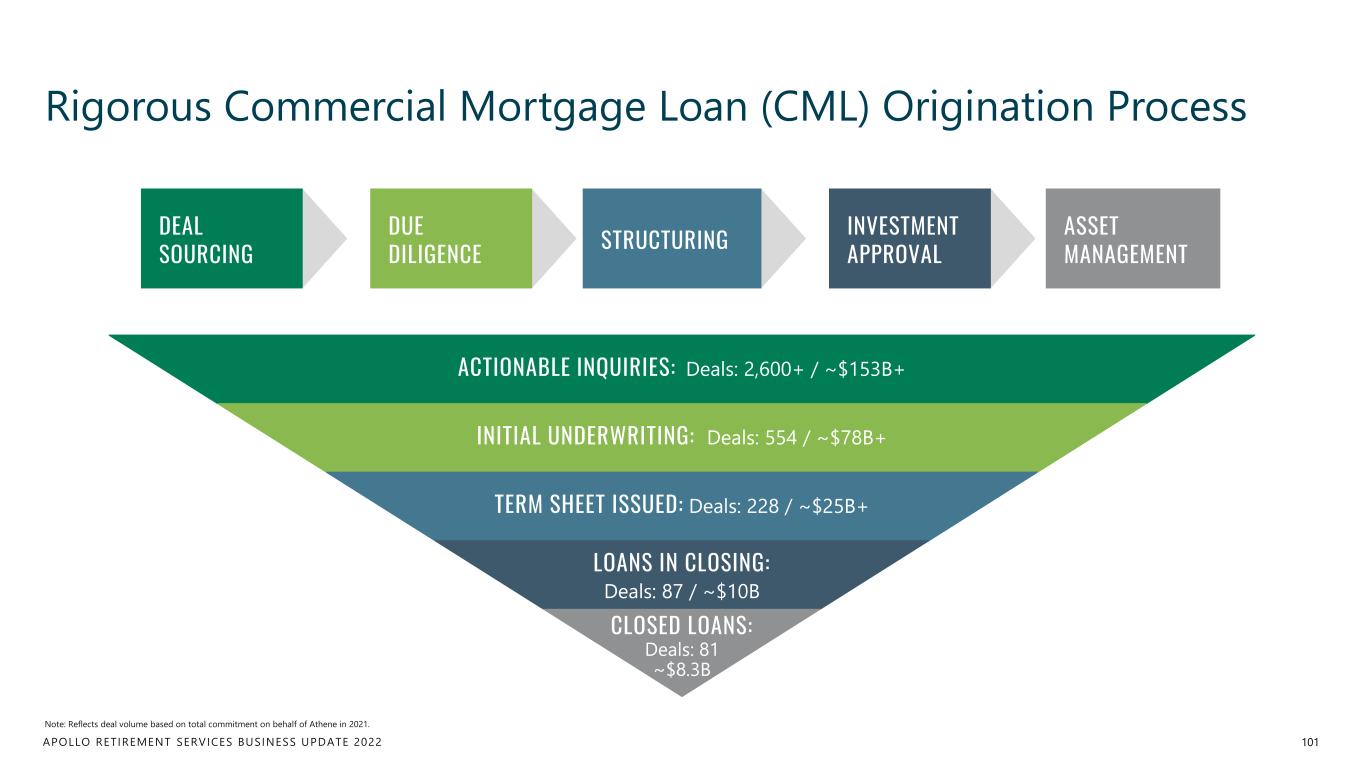
APOLLO RETIREMENT SERVICES BUSINESS UPDATE 2022 Rigorous Commercial Mortgage Loan (CML) Origination Process 101 Note: Reflects deal volume based on total commitment on behalf of Athene in 2021. ACTIONABLE INQUIRIES: Deals: 2,600+ / ~$153B+ INITIAL UNDERWRITING: Deals: 554 / ~$78B+ TERM SHEET ISSUED: Deals: 228 / ~$25B+ LOANS IN CLOSING: Deals: 87 / ~$10B CLOSED LOANS: Deals: 81 ~$8.3B DEAL SOURCING DUE DILIGENCE STRUCTURING INVESTMENT APPROVAL ASSET MANAGEMENT ACTIONABLE INQUIRIES: Deals: 2,6 $153B+ INITIAL UNDERWRITING: Deals: 5 $78B+ TERM SHEET IS UED: : 28 / ~$25B+ LOANS I SING: Deals: $10B CLOS NS: .
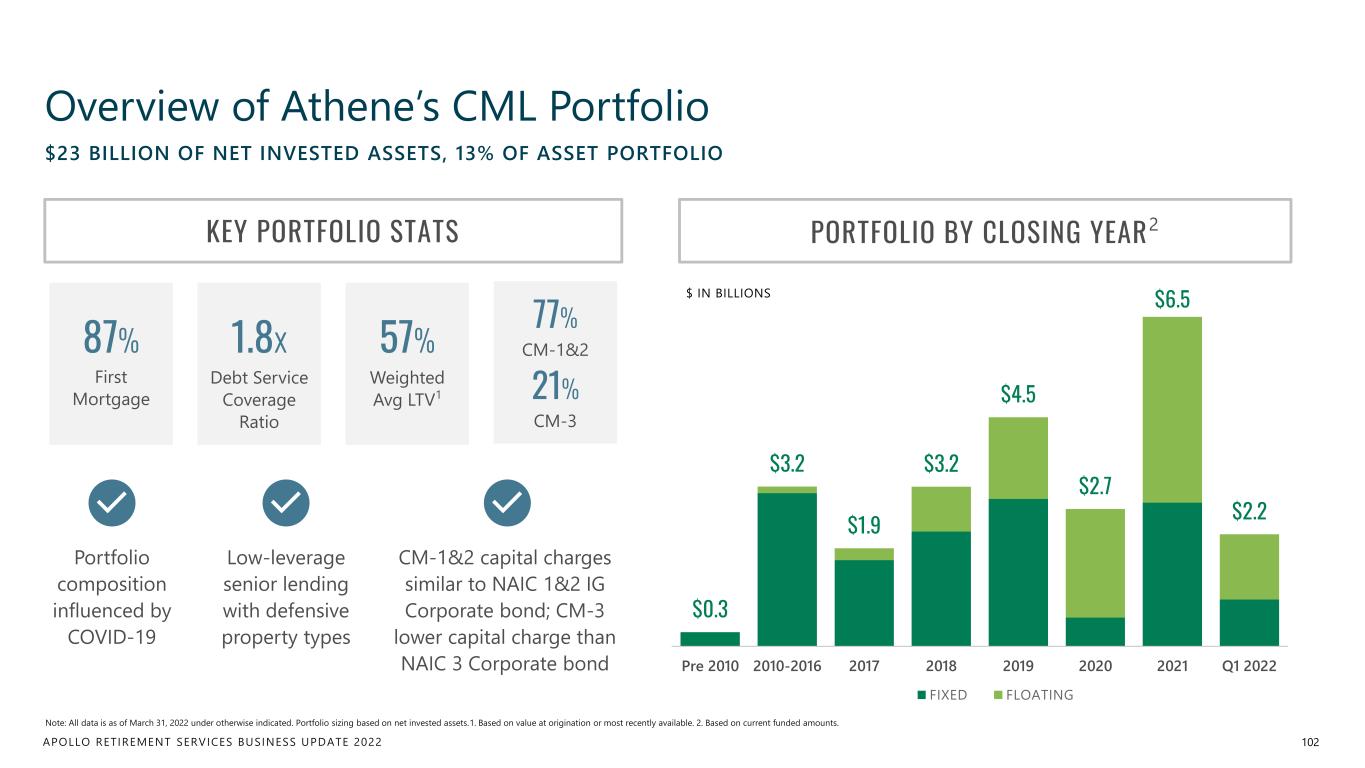
APOLLO RETIREMENT SERVICES BUSINESS UPDATE 2022 Overview of Athene’s CML Portfolio 102 Note: All data is as of March 31, 2022 under otherwise indicated. Portfolio sizing based on net invested assets.1. Based on value at origination or most recently available. 2. Based on current funded amounts. $23 BILLION OF NET INVESTED ASSETS, 13% OF ASSET PORTFOLIO PORTFOLIO BY CLOSING YEAR2KEY PORTFOLIO STATS Portfolio composition influenced by COVID-19 $0.3 $3.2 $1.9 $3.2 $4.5 $2.7 $6.5 $2.2 Pre 2010 2010-2016 2017 2018 2019 2020 2021 Q1 2022 FIXED FLOATING 87% First Mortgage 1.8x Debt Service Coverage Ratio 57% Weighted Avg LTV1 77% CM-1&2 21% CM-3 Low-leverage senior lending with defensive property types CM-1&2 capital charges similar to NAIC 1&2 IG Corporate bond; CM-3 lower capital charge than NAIC 3 Corporate bond $ IN BILLIONS
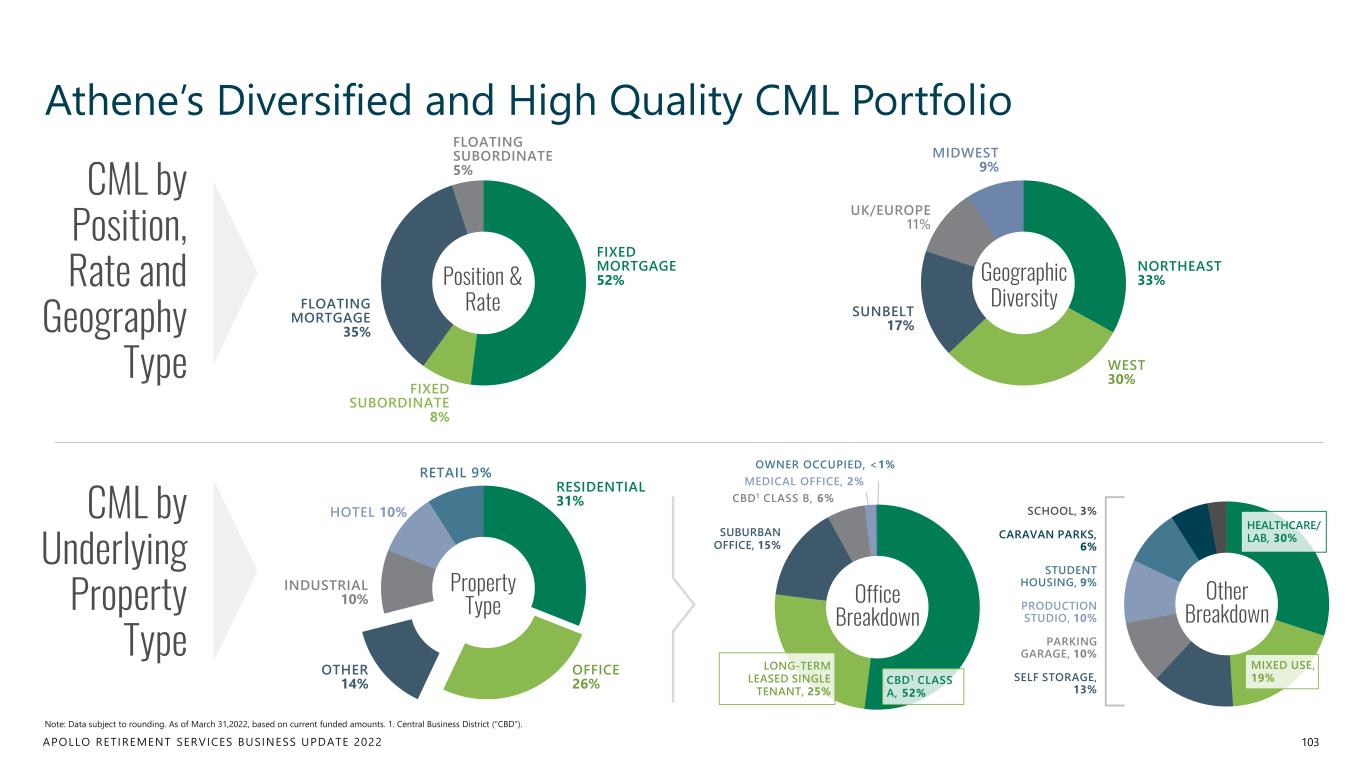
APOLLO RETIREMENT SERVICES BUSINESS UPDATE 2022 HEALTHCARE/ LAB, 30% MIXED USE, 19% Other Breakdown Property Type Position & Rate Athene’s Diversified and High Quality CML Portfolio CML by Position, Rate and Geography Type Note: Data subject to rounding. As of March 31,2022, based on current funded amounts. 1. Central Business District (“CBD”). 103 FIXED SUBORDINATE 8% FLOATING MORTGAGE 35% FIXED MORTGAGE 52% RETAIL 9% HOTEL 10% INDUSTRIAL 10% OTHER 14% OFFICE 26% RESIDENTIAL 31%CML by Underlying Property Type FLOATING SUBORDINATE 5% Geographic Diversity UK/EUROPE 11% SUNBELT 17% WEST 30% NORTHEAST 33% MIDWEST 9% CBD1 CLASS A, 52% LONG-TERM LEASED SINGLE TENANT, 25% SUBURBAN OFFICE, 15% Office Breakdown CBD1 CLASS B, 6% MEDICAL OFFICE, 2% OWNER OCCUPIED, <1% SCHOOL, 3% CARAVAN PARKS, 6% STUDENT HOUSING, 9% PRODUCTION STUDIO, 10% PARKING GARAGE, 10% SELF STORAGE, 13%
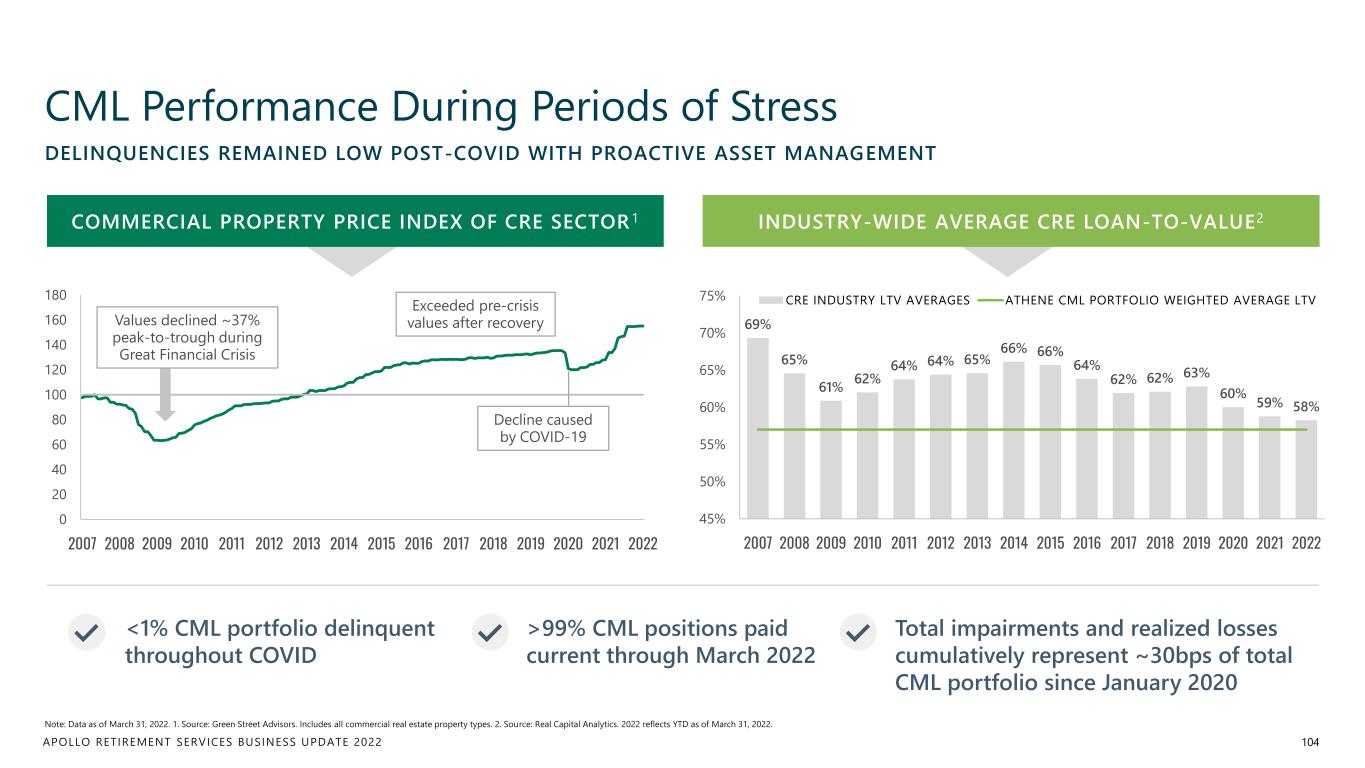
APOLLO RETIREMENT SERVICES BUSINESS UPDATE 2022 0 20 40 60 80 100 120 140 160 180 2007 2008 2009 2010 2011 2012 2013 2014 2015 2016 2017 2018 2019 2020 2021 2022 CML Performance During Periods of Stress 104 Note: Data as of March 31, 2022. 1. Source: Green Street Advisors. Includes all commercial real estate property types. 2. Source: Real Capital Analytics. 2022 reflects YTD as of March 31, 2022. DELINQUENCIES REMAINED LOW POST-COVID WITH PROACTIVE ASSET MANAGEMENT Exceeded pre-crisis values after recovery 69% 65% 61% 62% 64% 64% 65% 66% 66% 64% 62% 62% 63% 60% 59% 58% 45% 50% 55% 60% 65% 70% 75% 2007 2008 2009 2010 2011 2012 2013 2014 2015 2016 2017 2018 2019 2020 2021 2022 CRE INDUSTRY LTV AVERAGES ATHENE CML PORTFOLIO WEIGHTED AVERAGE LTV Values declined ~37% peak-to-trough during Great Financial Crisis <1% CML portfolio delinquent throughout COVID >99% CML positions paid current through March 2022 Total impairments and realized losses cumulatively represent ~30bps of total CML portfolio since January 2020 COMMERCIAL PROPERTY PRICE INDEX OF CRE SECTOR 1 INDUSTRY-WIDE AVERAGE CRE LOAN-TO-VALUE2 Decline caused by COVID-19
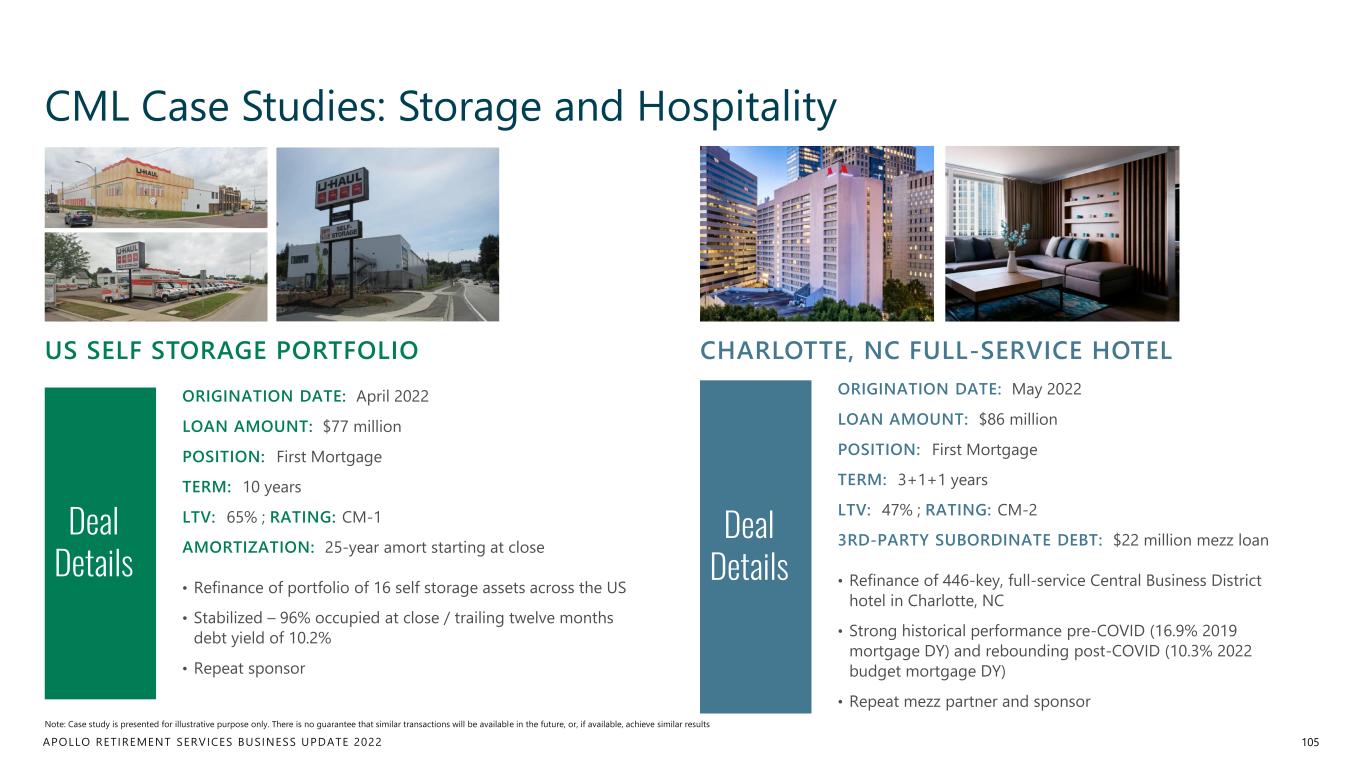
APOLLO RETIREMENT SERVICES BUSINESS UPDATE 2022 CML Case Studies: Storage and Hospitality 105 CHARLOTTE, NC FULL-SERVICE HOTELUS SELF STORAGE PORTFOLIO Deal Details ORIGINATION DATE: April 2022 LOAN AMOUNT: $77 million POSITION: First Mortgage TERM: 10 years LTV: 65% ; RATING: CM-1 AMORTIZATION: 25-year amort starting at close • Refinance of portfolio of 16 self storage assets across the US • Stabilized – 96% occupied at close / trailing twelve months debt yield of 10.2% • Repeat sponsor Deal Details ORIGINATION DATE: May 2022 LOAN AMOUNT: $86 million POSITION: First Mortgage TERM: 3+1+1 years LTV: 47% ; RATING: CM-2 3RD-PARTY SUBORDINATE DEBT: $22 million mezz loan • Refinance of 446-key, full-service Central Business District hotel in Charlotte, NC • Strong historical performance pre-COVID (16.9% 2019 mortgage DY) and rebounding post-COVID (10.3% 2022 budget mortgage DY) • Repeat mezz partner and sponsor Note: Case study is presented for illustrative purpose only. There is no guarantee that similar transactions will be available in the future, or, if available, achieve similar results
Financial Overview & Capital Management MARTY KLEIN Chief Financial Officer, Athene
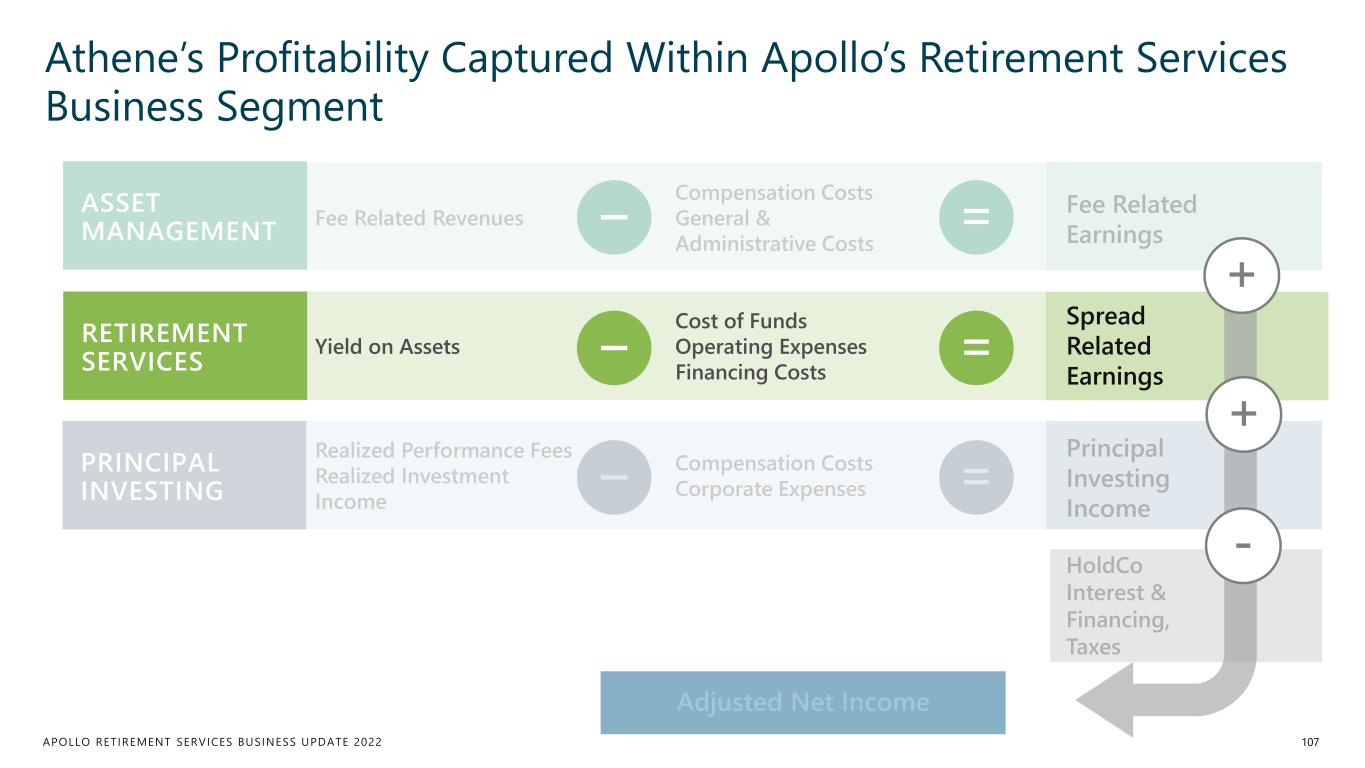
APOLLO RETIREMENT SERVICES BUSINESS UPDATE 2022 PRINCIPAL INVESTING RETIREMENT SERVICES Yield on Assets Cost of Funds Operating Expenses Financing Costs Spread Related Earnings Athene’s Profitability Captured Within Apollo’s Retirement Services Business Segment 107 = ASSET MANAGEMENT =– – - + +
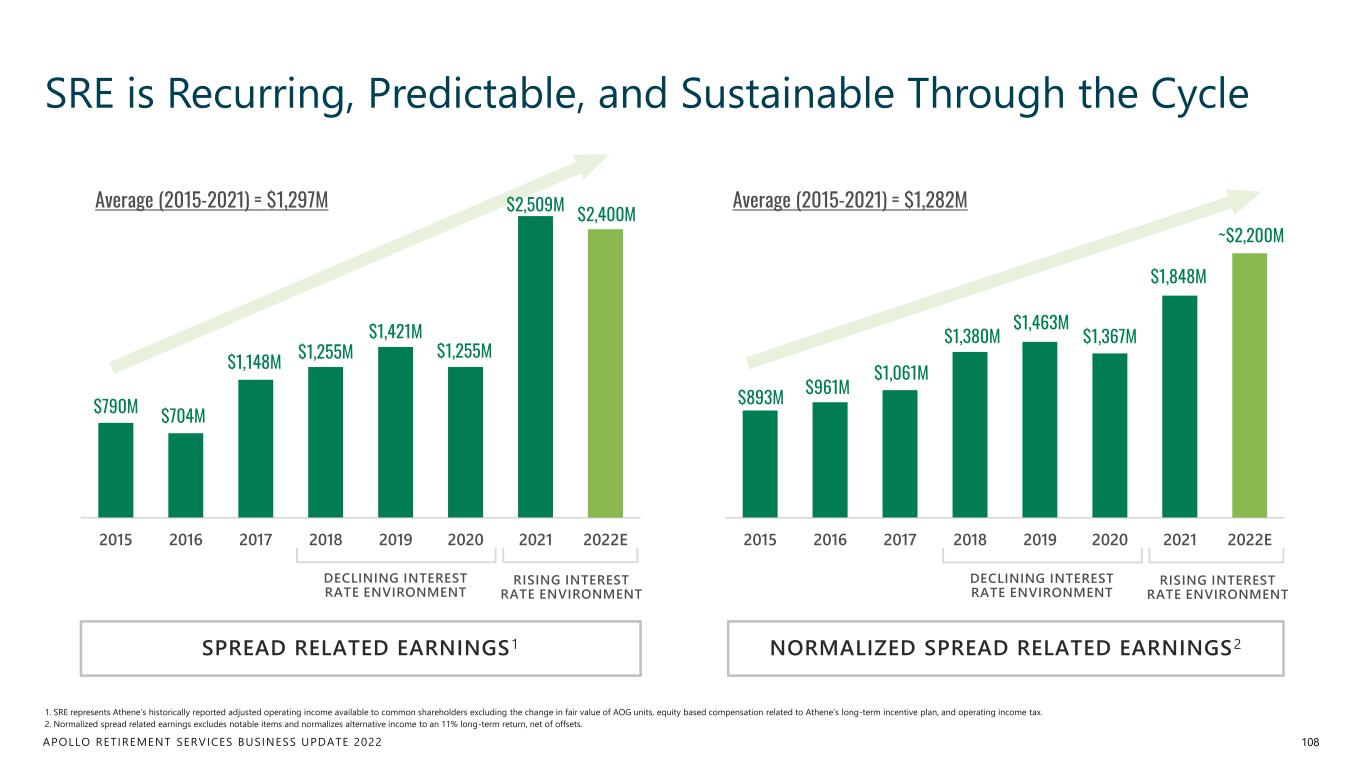
APOLLO RETIREMENT SERVICES BUSINESS UPDATE 2022 SRE is Recurring, Predictable, and Sustainable Through the Cycle 108 1. SRE represents Athene’s historically reported adjusted operating income available to common shareholders excluding the change in fair value of AOG units, equity based compensation related to Athene’s long-term incentive plan, and operating income tax. 2. Normalized spread related earnings excludes notable items and normalizes alternative income to an 11% long-term return, net of offsets. $790M $704M $1,148M $1,255M $1,421M $1,255M $2,509M $2,400M 2015 2016 2017 2018 2019 2020 2021 2022E $893M $961M $1,061M $1,380M $1,463M $1,367M $1,848M ~$2,200M 2015 2016 2017 2018 2019 2020 2021 2022E NORMALIZED SPREAD RELATED EARNINGS2SPREAD RELATED EARNINGS1 DECLINING INTEREST RATE ENVIRONMENT RISING INTEREST RATE ENVIRONMENT DECLINING INTEREST RATE ENVIRONMENT RISING INTEREST RATE ENVIRONMENT Average (2015-2021) = $1,297M Average (2015-2021) = $1,282M
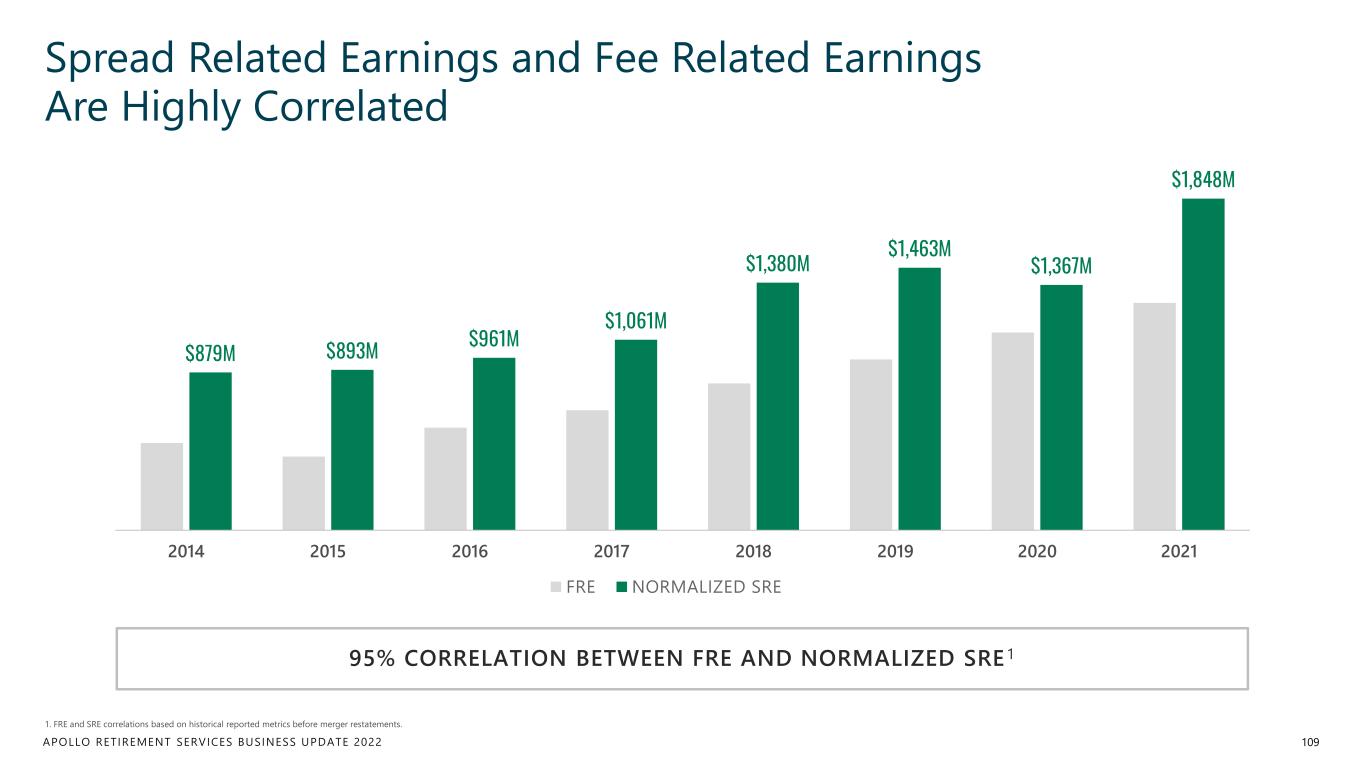
APOLLO RETIREMENT SERVICES BUSINESS UPDATE 2022 $879M $893M $961M $1,061M $1,380M $1,463M $1,367M $1,848M 2014 2015 2016 2017 2018 2019 2020 2021 FRE NORMALIZED SRE Spread Related Earnings and Fee Related Earnings Are Highly Correlated 109 1. FRE and SRE correlations based on historical reported metrics before merger restatements. 95% CORRELATION BETWEEN FRE AND NORMALIZED SRE1
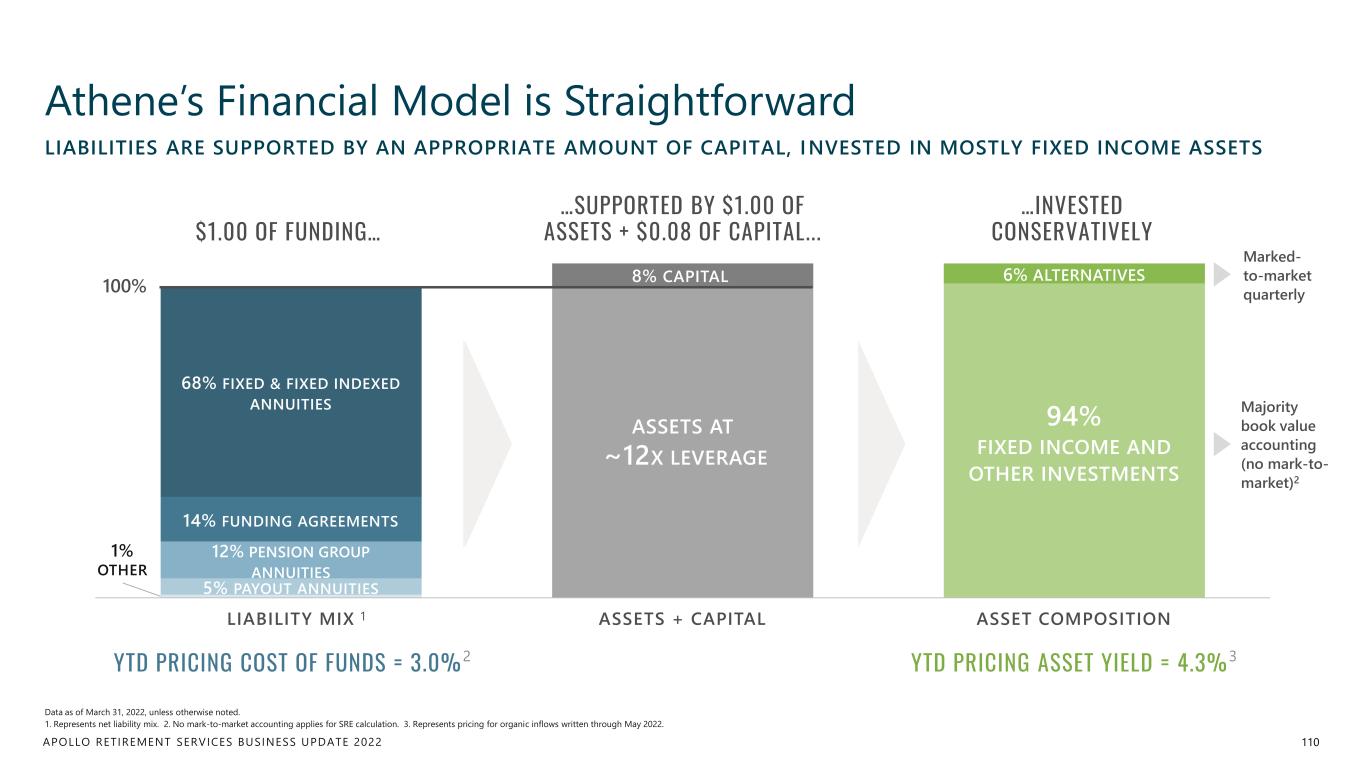
APOLLO RETIREMENT SERVICES BUSINESS UPDATE 2022 Athene’s Financial Model is Straightforward 110 Data as of March 31, 2022, unless otherwise noted. 1. Represents net liability mix. 2. No mark-to-market accounting applies for SRE calculation. 3. Represents pricing for organic inflows written through May 2022. LIABILITIES ARE SUPPORTED BY AN APPROPRIATE AMOUNT OF CAPITAL, INVESTED IN MOSTLY FIXED INCOME ASSETS 1% OTHER ASSETS AT ~12X LEVERAGE 5% PAYOUT ANNUITIES 8% CAPITAL 94% FIXED INCOME AND OTHER INVESTMENTS 12% PENSION GROUP ANNUITIES 6% ALTERNATIVES 14% FUNDING AGREEMENTS 68% FIXED & FIXED INDEXED ANNUITIES LIABILITY MIX ASSETS + CAPITAL ASSET COMPOSITION 100% YTD PRICING COST OF FUNDS = 3.0%2 YTD PRICING ASSET YIELD = 4.3%3 $1.00 OF FUNDING… …SUPPORTED BY $1.00 OF ASSETS + $0.08 OF CAPITAL... …INVESTED CONSERVATIVELY Marked- to-market quarterly Majority book value accounting (no mark-to- market)2 1
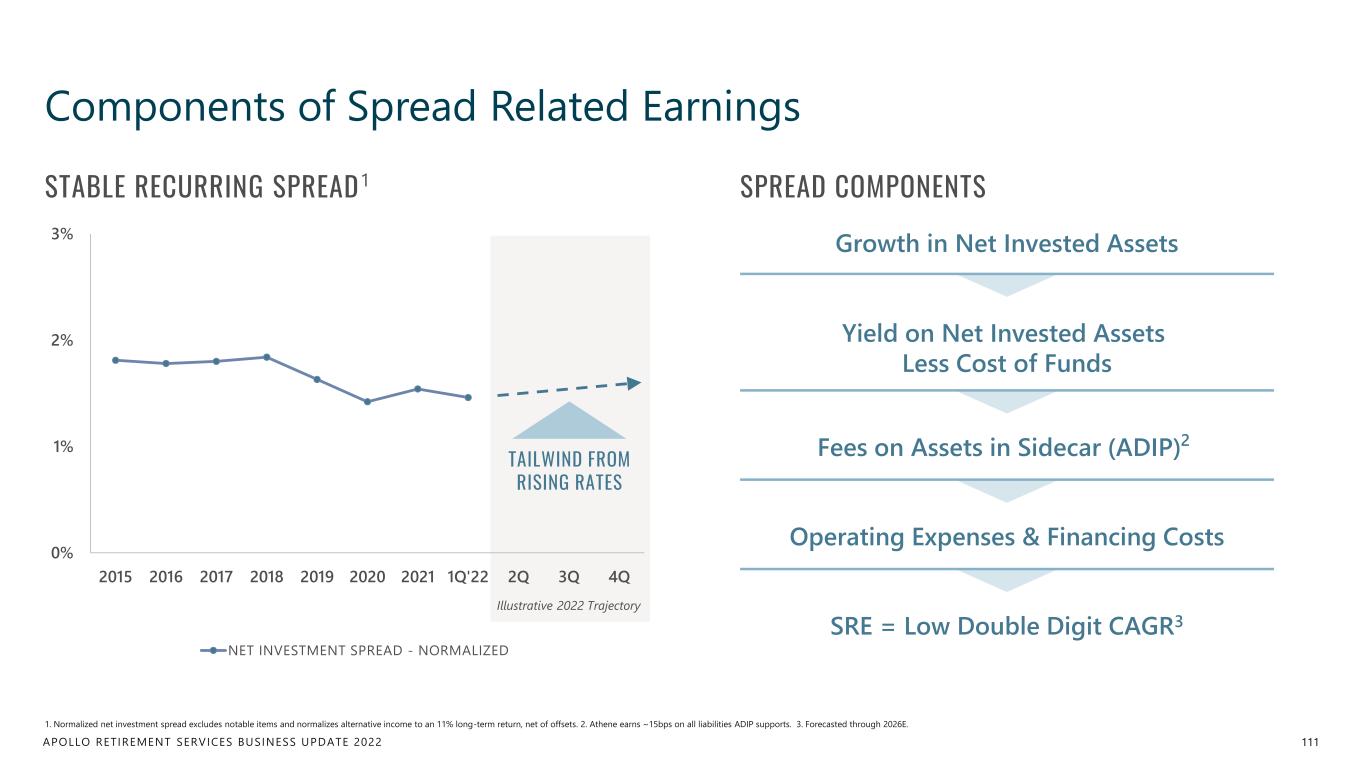
APOLLO RETIREMENT SERVICES BUSINESS UPDATE 2022 0% 1% 2% 3% 2015 2016 2017 2018 2019 2020 2021 1Q'22 2Q 3Q 4Q NET INVESTMENT SPREAD - NORMALIZED Components of Spread Related Earnings 111 1. Normalized net investment spread excludes notable items and normalizes alternative income to an 11% long-term return, net of offsets. 2. Athene earns ~15bps on all liabilities ADIP supports. 3. Forecasted through 2026E. Growth in Net Invested Assets Yield on Net Invested Assets Less Cost of Funds Fees on Assets in Sidecar (ADIP)2 Operating Expenses & Financing Costs SRE = Low Double Digit CAGR3 STABLE RECURRING SPREAD1 Illustrative 2022 Trajectory SPREAD COMPONENTS TAILWIND FROM RISING RATES
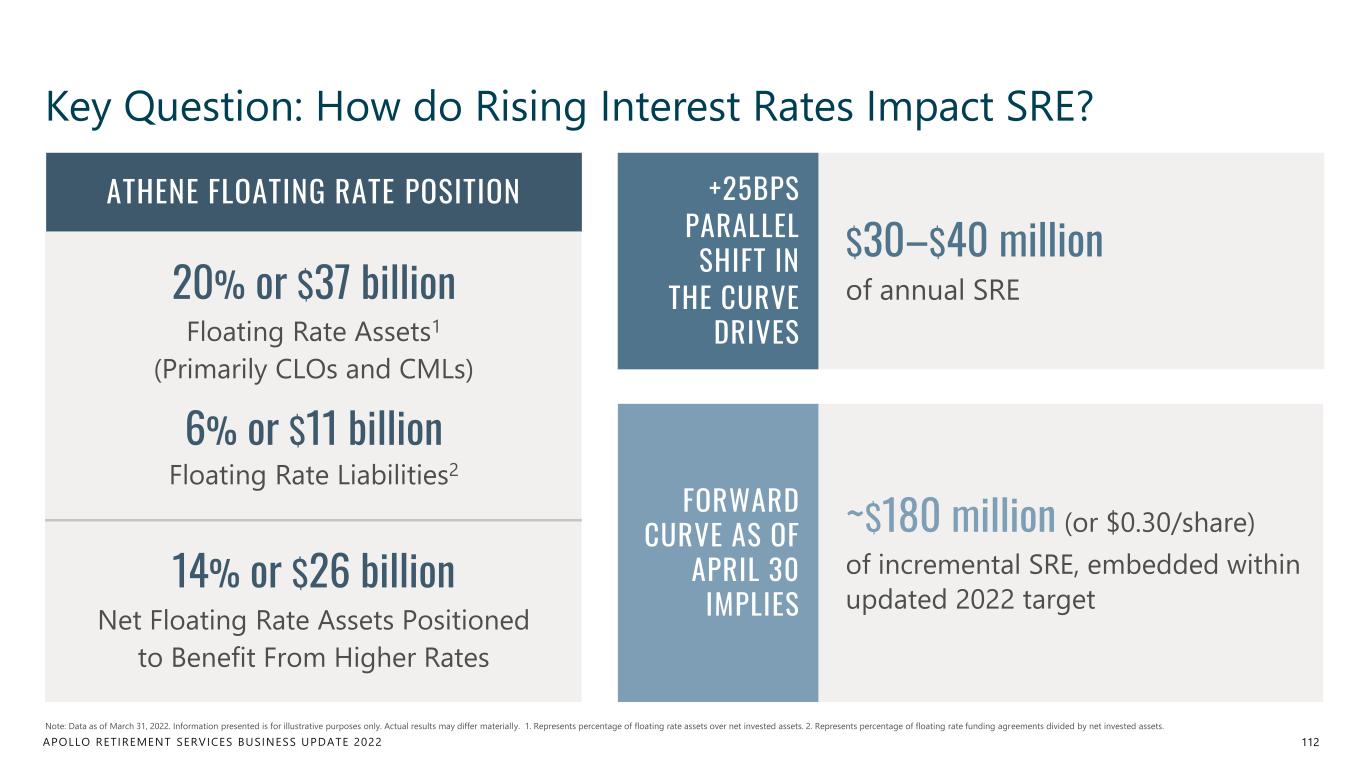
APOLLO RETIREMENT SERVICES BUSINESS UPDATE 2022 Key Question: How do Rising Interest Rates Impact SRE? 112 Note: Data as of March 31, 2022. Information presented is for illustrative purposes only. Actual results may differ materially. 1. Represents percentage of floating rate assets over net invested assets. 2. Represents percentage of floating rate funding agreements divided by net invested assets. ATHENE FLOATING RATE POSITION +25BPS PARALLEL SHIFT IN THE CURVE DRIVES $30–$40 million of annual SRE FORWARD CURVE AS OF APRIL 30 IMPLIES ~$180 million (or $0.30/share) of incremental SRE, embedded within updated 2022 target 20% or $37 billion Floating Rate Assets1 (Primarily CLOs and CMLs) 6% or $11 billion Floating Rate Liabilities2 14% or $26 billion Net Floating Rate Assets Positioned to Benefit From Higher Rates
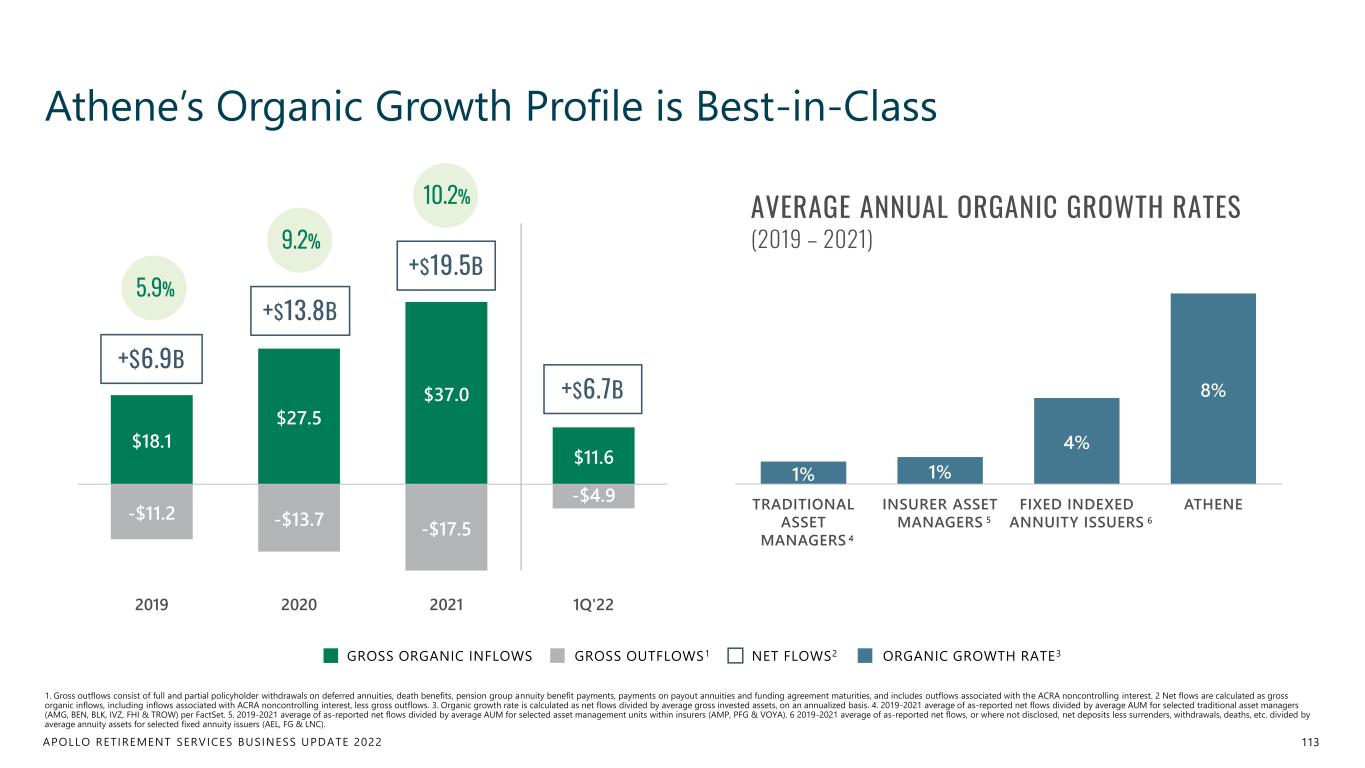
APOLLO RETIREMENT SERVICES BUSINESS UPDATE 2022 $18.1 $27.5 $37.0 $11.6 -$11.2 -$13.7 -$17.5 -$4.9 2019 2020 2021 1Q'22 Athene’s Organic Growth Profile is Best-in-Class 113 1. Gross outflows consist of full and partial policyholder withdrawals on deferred annuities, death benefits, pension group annuity benefit payments, payments on payout annuities and funding agreement maturities, and includes outflows associated with the ACRA noncontrolling interest. 2 Net flows are calculated as gross organic inflows, including inflows associated with ACRA noncontrolling interest, less gross outflows. 3. Organic growth rate is calculated as net flows divided by average gross invested assets, on an annualized basis. 4. 2019-2021 average of as-reported net flows divided by average AUM for selected traditional asset managers (AMG, BEN, BLK, IVZ, FHI & TROW) per FactSet. 5. 2019-2021 average of as-reported net flows divided by average AUM for selected asset management units within insurers (AMP, PFG & VOYA). 6 2019-2021 average of as-reported net flows, or where not disclosed, net deposits less surrenders, withdrawals, deaths, etc. divided by average annuity assets for selected fixed annuity issuers (AEL, FG & LNC). NET FLOWS2GROSS ORGANIC INFLOWS GROSS OUTFLOWS1 ORGANIC GROWTH RATE3 1% 1% 4% 8% TRADITIONAL ASSET MANAGERS INSURER ASSET MANAGERS FIXED INDEXED ANNUITY ISSUERS ATHENE AVERAGE ANNUAL ORGANIC GROWTH RATES (2019 – 2021) 4 65 5.9% 9.2% 10.2% +$6.9B +$19.5B +$13.8B +$6.7B
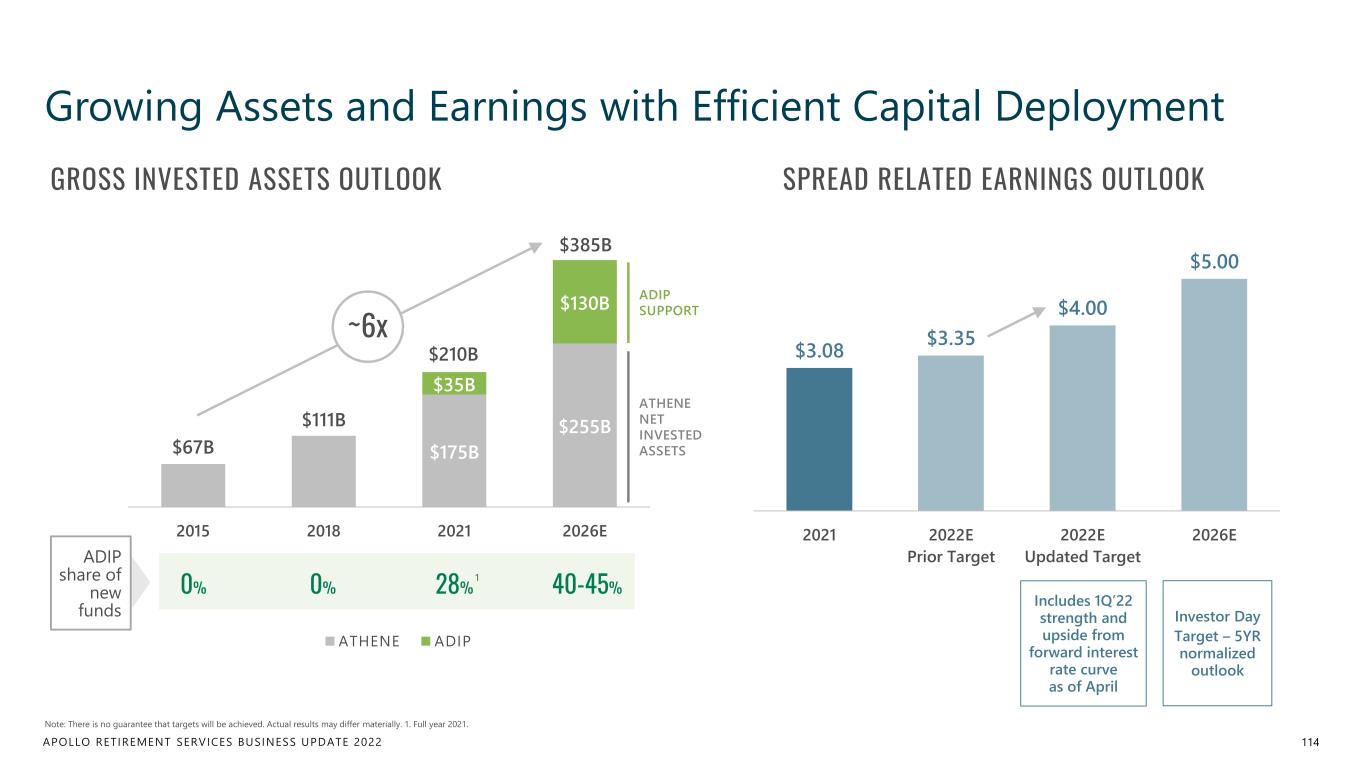
APOLLO RETIREMENT SERVICES BUSINESS UPDATE 2022 $67B $111B $175B $255B $35B $130B 2015 2018 2021 2026E ATHENE ADIP $3.08 $3.35 $4.00 $5.00 2021 2022E Prior Target 2022E Updated Target 2026E Growing Assets and Earnings with Efficient Capital Deployment 114 Note: There is no guarantee that targets will be achieved. Actual results may differ materially. 1. Full year 2021. ~6x ADIP SUPPORT ATHENE NET INVESTED ASSETS GROSS INVESTED ASSETS OUTLOOK SPREAD RELATED EARNINGS OUTLOOK 0% 0% 28% ADIP share of new funds 40-45% 1 $210B $385B Includes 1Q’22 strength and upside from forward interest rate curve as of April Investor Day Target – 5YR normalized outlook
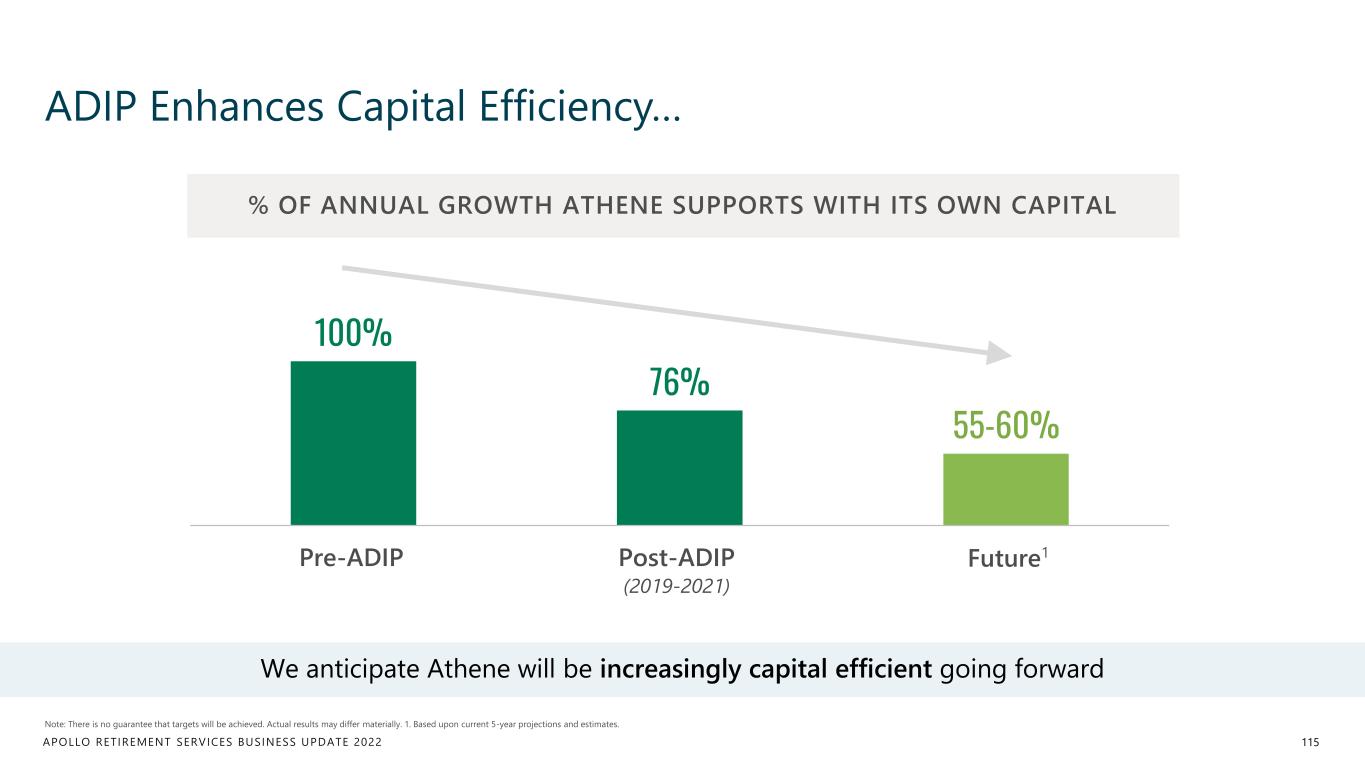
APOLLO RETIREMENT SERVICES BUSINESS UPDATE 2022 ADIP Enhances Capital Efficiency… 115 Note: There is no guarantee that targets will be achieved. Actual results may differ materially. 1. Based upon current 5-year projections and estimates. 100% 76% 55-60% Pre-ADIP 2018-1H21 Next 5 YearsPre- IP Post-ADIP (2019-2021) Future1 % OF ANNUAL GROWTH ATHENE SUPPORTS WITH ITS OWN CAPITAL We anticipate Athene will be increasingly capital efficient going forward

APOLLO RETIREMENT SERVICES BUSINESS UPDATE 2022 ….And Strengthens Our Earnings Power 116 Illustrative Pre-ADIP Earnings Model Illustrative Future State (45% ADIP Support) VS $1 Billion of Capital from Athene $150 Million Total Annual Earnings $1 Billion of Capital from Athene $187 Million Total Annual Earnings +25% EARNINGS POWER Supports $12 Billion of Inflow Generation Athene @ ~12x Leverage Supports $21 Billion of Liability Generation Athene: $12 Billion @ ~12x leverage $120 Million Annual SRE 100 bps Net Spread x $12B $30 Million Annual FRE ~45 bps Mgmt. Fees x $12B @ ~55% Current Margin $52 Million Annual FRE ~45 bps Mgmt. Fees x $21B @ ~55% Current Margin $135 Million Annual SRE Athene: ~100 bps Net Spread x $12B, plus: ADIP: ~15 bps Fee x $9BADIP: $9 Billion @ 45% of Inflows Note: Future state earnings model is presented for illustrative purposes only and is based on a variety of assumptions. Actual results may differ materially.
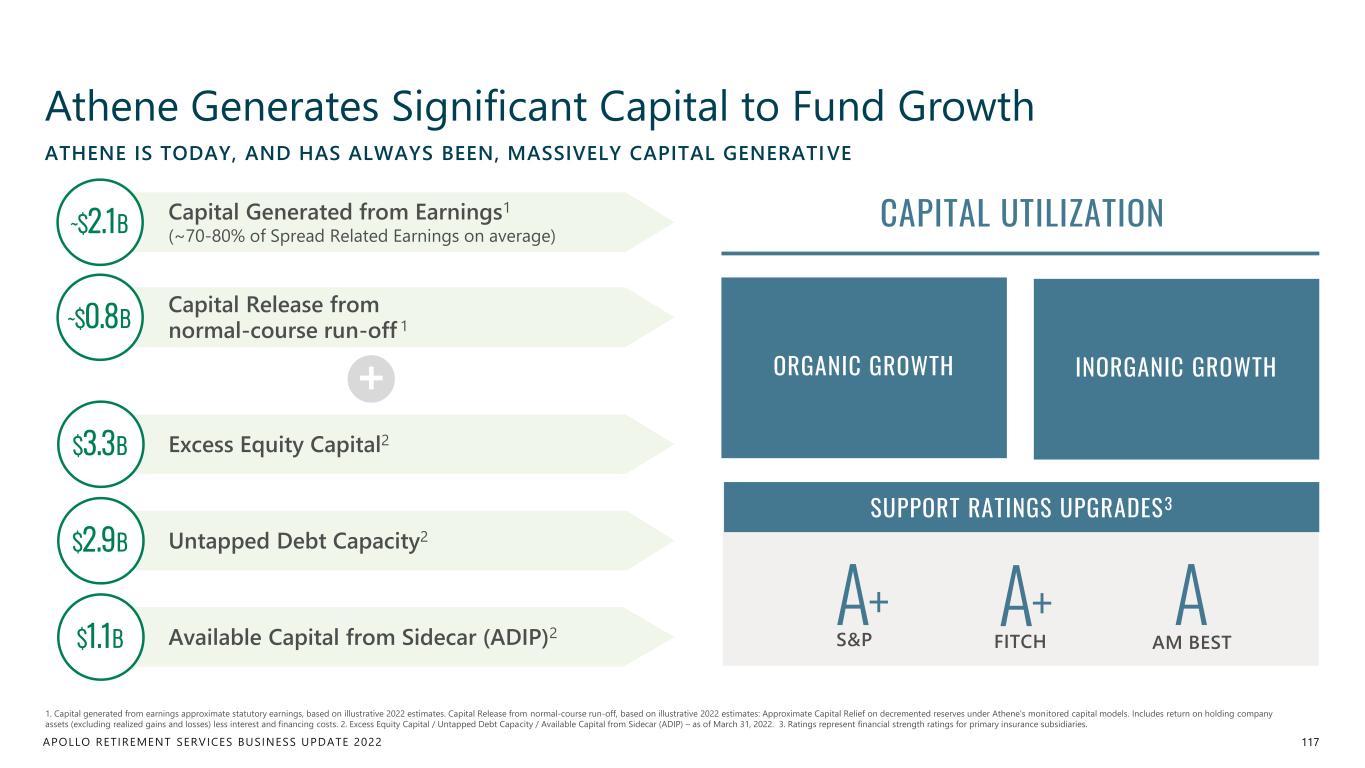
APOLLO RETIREMENT SERVICES BUSINESS UPDATE 2022 Athene Generates Significant Capital to Fund Growth 117 ATHENE IS TODAY, AND HAS ALWAYS BEEN, MASSIVELY CAPITAL GENERATIVE Capital Generated from Earnings1 (~70-80% of Spread Related Earnings on average) ~$2.1B Capital Release from normal-course run-off 1~$0.8B Excess Equity Capital2$3.3B Untapped Debt Capacity2$2.9B Available Capital from Sidecar (ADIP)2$1.1B SUPPORT RATINGS UPGRADES3 A+ S&P A AM BEST A+ 1. Capital generated from earnings approximate statutory earnings, based on illustrative 2022 estimates. Capital Release from normal-course run-off, based on illustrative 2022 estimates: Approximate Capital Relief on decremented reserves under Athene’s monitored capital models. Includes return on holding company assets (excluding realized gains and losses) less interest and financing costs. 2. Excess Equity Capital / Untapped Debt Capacity / Available Capital from Sidecar (ADIP) – as of March 31, 2022. 3. Ratings represent financial strength ratings for primary insurance subsidiaries. + CAPITAL UTILIZATION FITCH ORGANIC GROWTH INORGANIC GROWTH
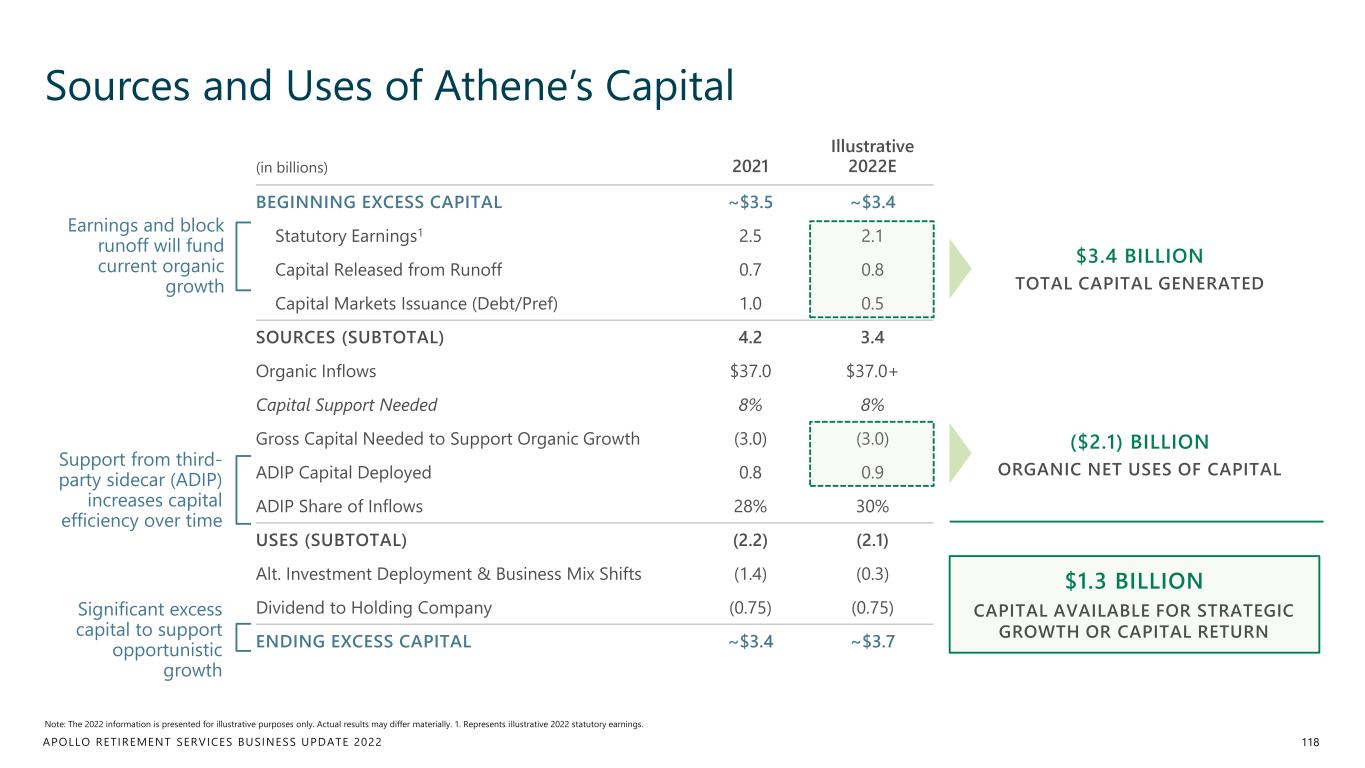
APOLLO RETIREMENT SERVICES BUSINESS UPDATE 2022 (in billions) 2021 Illustrative 2022E BEGINNING EXCESS CAPITAL ~$3.5 ~$3.4 Statutory Earnings1 2.5 2.1 Capital Released from Runoff 0.7 0.8 Capital Markets Issuance (Debt/Pref) 1.0 0.5 SOURCES (SUBTOTAL) 4.2 3.4 Organic Inflows $37.0 $37.0+ Capital Support Needed 8% 8% Gross Capital Needed to Support Organic Growth (3.0) (3.0) ADIP Capital Deployed 0.8 0.9 ADIP Share of Inflows 28% 30% USES (SUBTOTAL) (2.2) (2.1) Alt. Investment Deployment & Business Mix Shifts (1.4) (0.3) Dividend to Holding Company (0.75) (0.75) ENDING EXCESS CAPITAL ~$3.4 ~$3.7 Sources and Uses of Athene’s Capital 118 Note: The 2022 information is presented for illustrative purposes only. Actual results may differ materially. 1. Represents illustrative 2022 statutory earnings. $3.4 BILLION TOTAL CAPITAL GENERATED ($2.1) BILLION ORGANIC NET USES OF CAPITAL Earnings and block runoff will fund current organic growth Support from third- party sidecar (ADIP) increases capital efficiency over time Significant excess capital to support opportunistic growth $1.3 BILLION CAPITAL AVAILABLE FOR STRATEGIC GROWTH OR CAPITAL RETURN
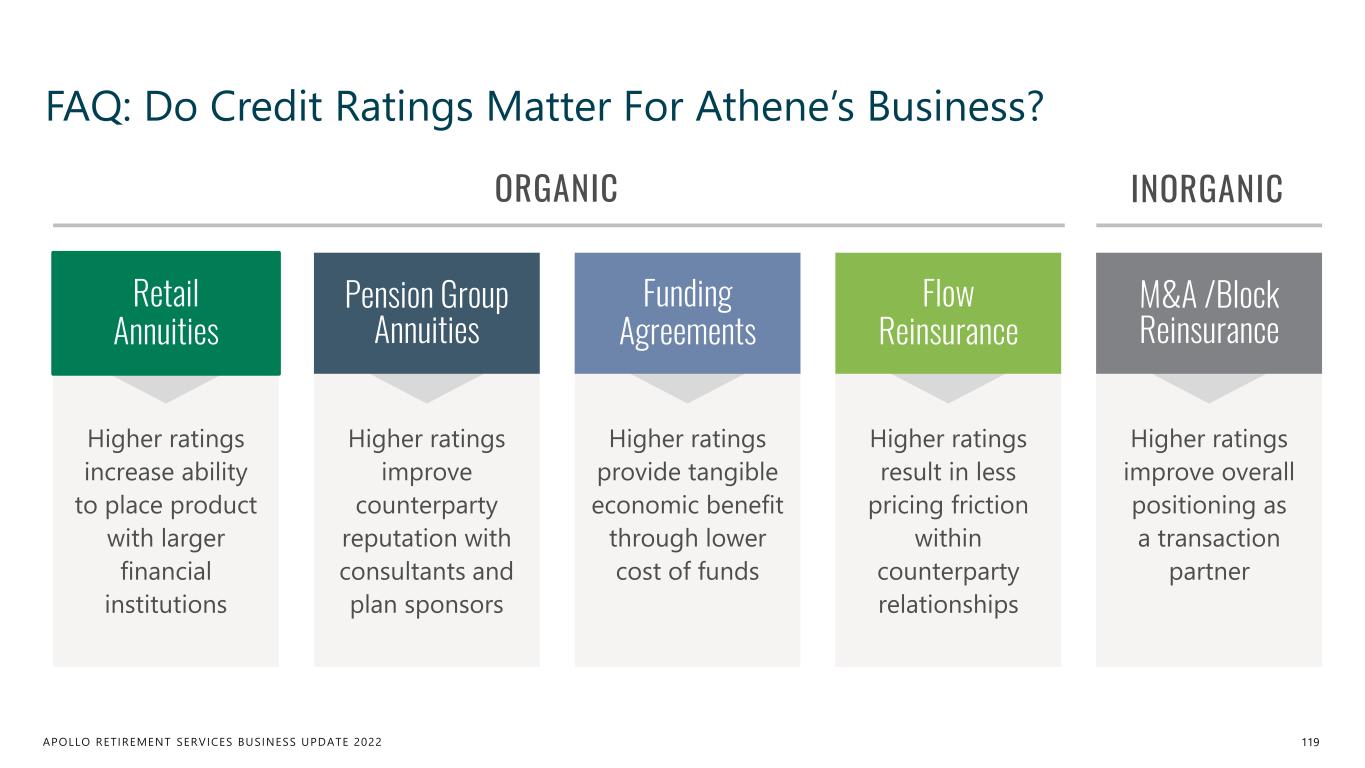
APOLLO RETIREMENT SERVICES BUSINESS UPDATE 2022 Higher ratings increase ability to place product with larger financial institutions Higher ratings result in less pricing friction within counterparty relationships Higher ratings improve counterparty reputation with consultants and plan sponsors Higher ratings provide tangible economic benefit through lower cost of funds Higher ratings improve overall positioning as a transaction partner FAQ: Do Credit Ratings Matter For Athene’s Business? 119 ORGANIC INORGANIC Retail Annuities Flow Reinsurance Pension Group Annuities Funding Agreements M&A /Block Reinsurance
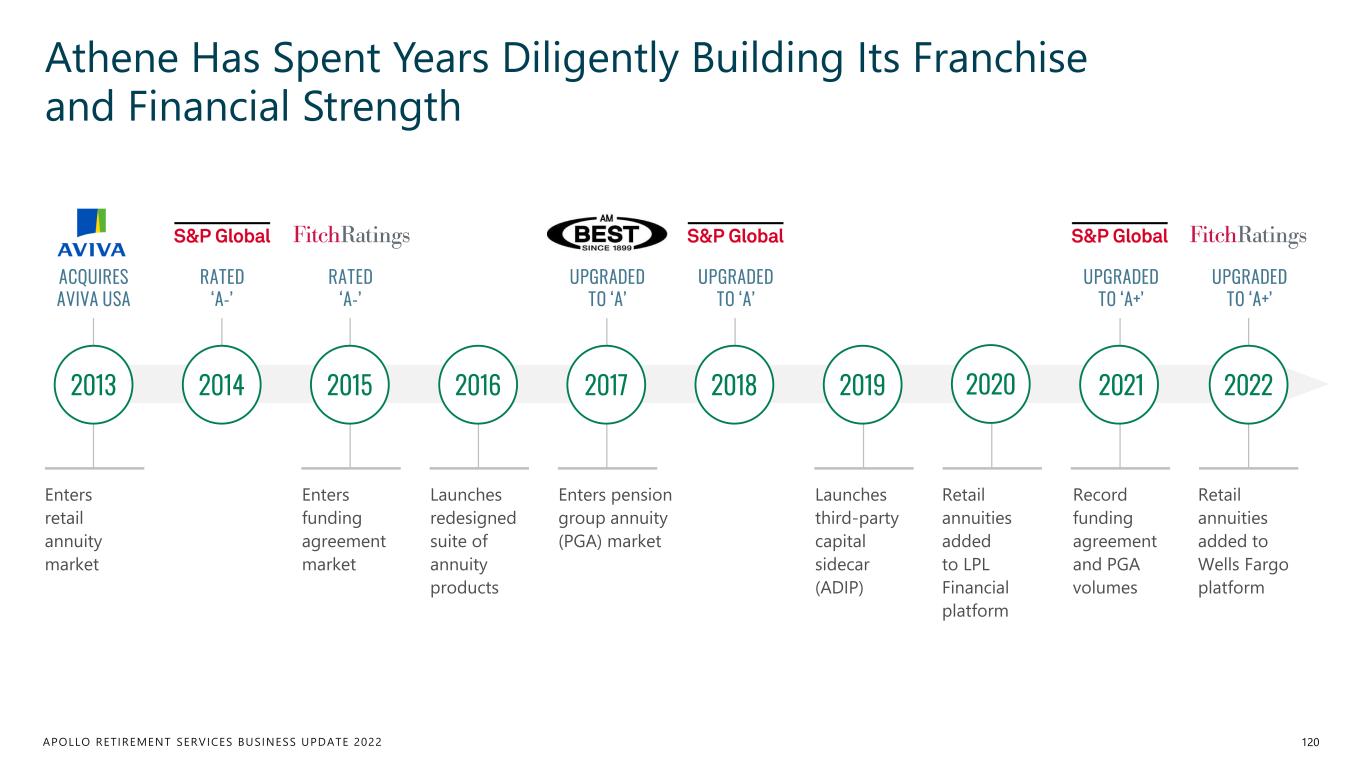
APOLLO RETIREMENT SERVICES BUSINESS UPDATE 2022 Athene Has Spent Years Diligently Building Its Franchise and Financial Strength 120 UPGRADED TO ‘A+’ RATED ‘A- ’ UPGRADED TO ‘A’ RATED ‘A- ’ ACQUIRES AVIVA USA 20152014 20212017 20222016 20182013 2019 2020 UPGRADED TO ‘A+’ UPGRADED TO ‘A’ Enters retail annuity market Enters funding agreement market Launches redesigned suite of annuity products Enters pension group annuity (PGA) market Launches third-party capital sidecar (ADIP) Retail annuities added to LPL Financial platform Record funding agreement and PGA volumes Retail annuities added to Wells Fargo platform
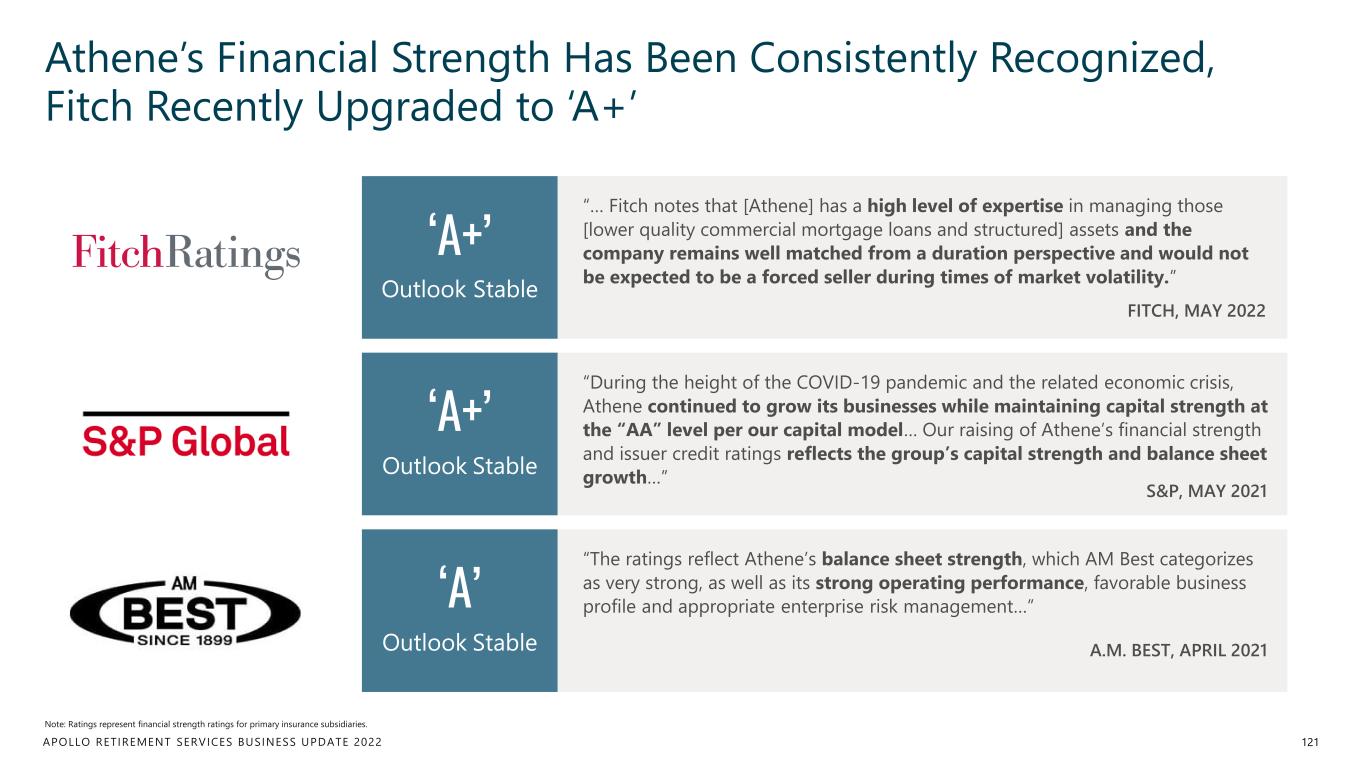
APOLLO RETIREMENT SERVICES BUSINESS UPDATE 2022 Athene’s Financial Strength Has Been Consistently Recognized, Fitch Recently Upgraded to ‘A+’ 121 Note: Ratings represent financial strength ratings for primary insurance subsidiaries. “… Fitch notes that [Athene] has a high level of expertise in managing those [lower quality commercial mortgage loans and structured] assets and the company remains well matched from a duration perspective and would not be expected to be a forced seller during times of market volatility.” ‘A+’ Outlook Stable “During the height of the COVID-19 pandemic and the related economic crisis, Athene continued to grow its businesses while maintaining capital strength at the “AA” level per our capital model… Our raising of Athene’s financial strength and issuer credit ratings reflects the group’s capital strength and balance sheet growth…” ‘A+’ Outlook Stable “The ratings reflect Athene’s balance sheet strength, which AM Best categorizes as very strong, as well as its strong operating performance, favorable business profile and appropriate enterprise risk management…”‘A’ Outlook Stable S&P, MAY 2021 FITCH, MAY 2022 A.M. BEST, APRIL 2021
Apollo’s Winning Model MARTIN KELLY Chief Financial Officer, Apollo
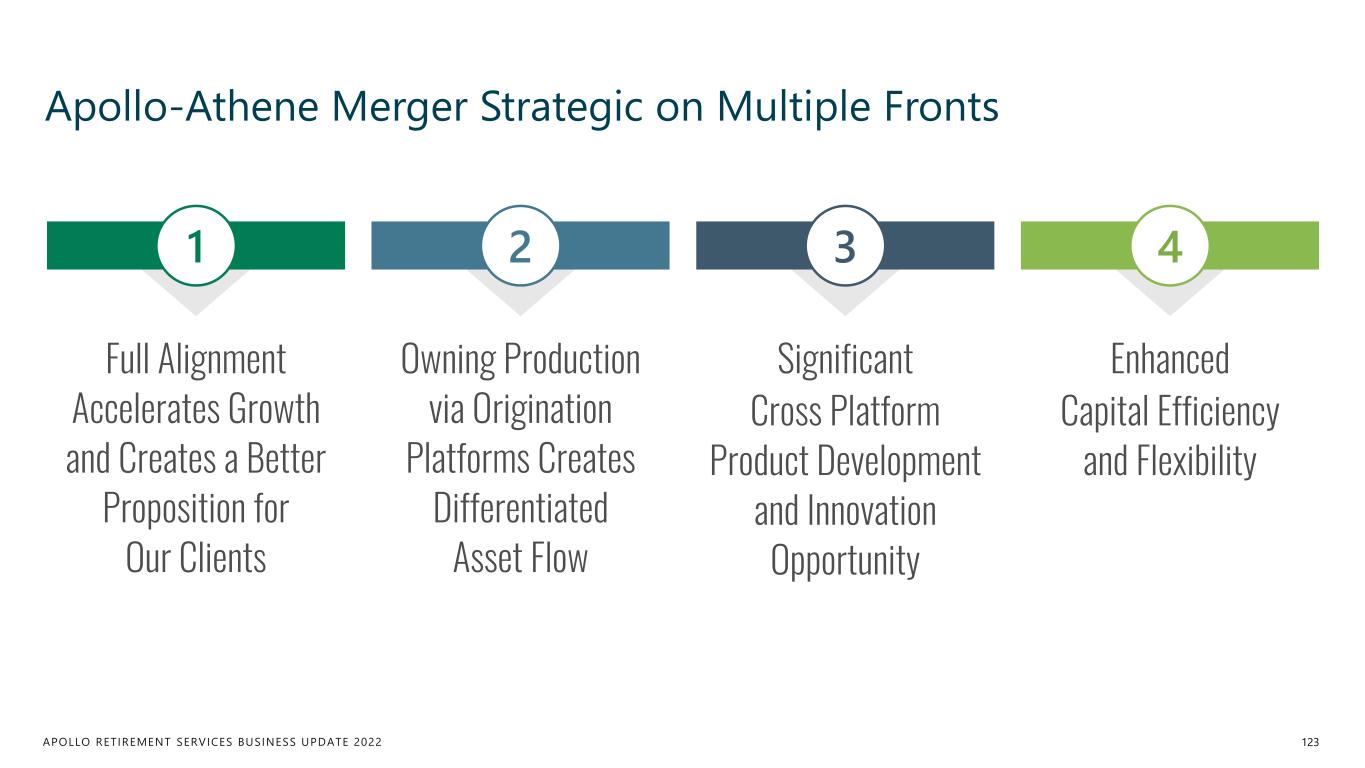
APOLLO RETIREMENT SERVICES BUSINESS UPDATE 2022 Apollo-Athene Merger Strategic on Multiple Fronts 123 Full Alignment Accelerates Growth and Creates a Better Proposition for Our Clients 1 Significant Cross Platform Product Development and Innovation Opportunity 3 Owning Production via Origination Platforms Creates Differentiated Asset Flow 2 Enhanced Capital Efficiency and Flexibility 4
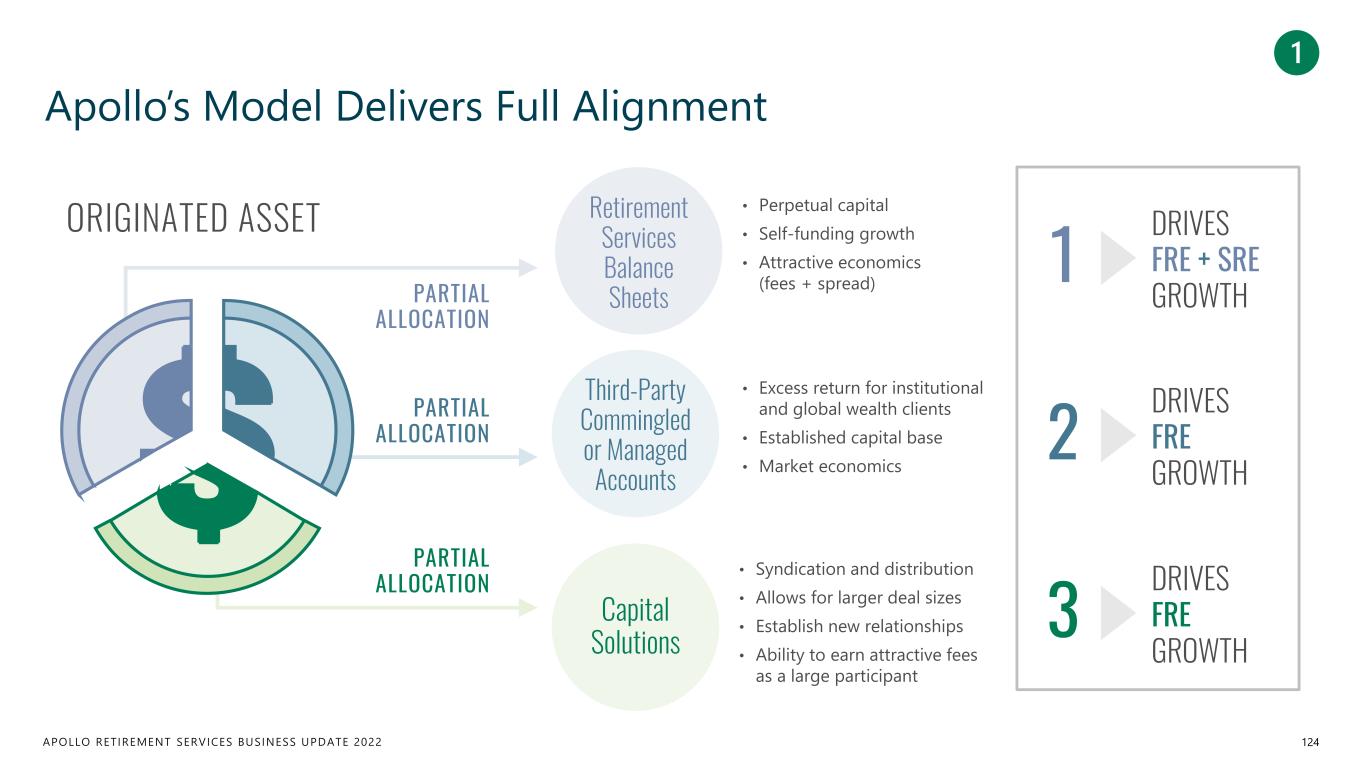
APOLLO RETIREMENT SERVICES BUSINESS UPDATE 2022 Apollo’s Model Delivers Full Alignment 124 DRIVES FRE + SRE GROWTH 1 DRIVES FRE GROWTH 3 1 DRIVES FRE GROWTH 2 • Excess return for institutional and global wealth clients • Established capital base • Market economics • Perpetual capital • Self-funding growth • Attractive economics (fees + spread) • Syndication and distribution • Allows for larger deal sizes • Establish new relationships • Ability to earn attractive fees as a large participant Third-Party Commingled or Managed Accounts Retirement Services Balance Sheets Capital Solutions ORIGINATED ASSET PARTIAL ALLOCATION PARTIAL ALLOCATION PARTIAL ALLOCATION
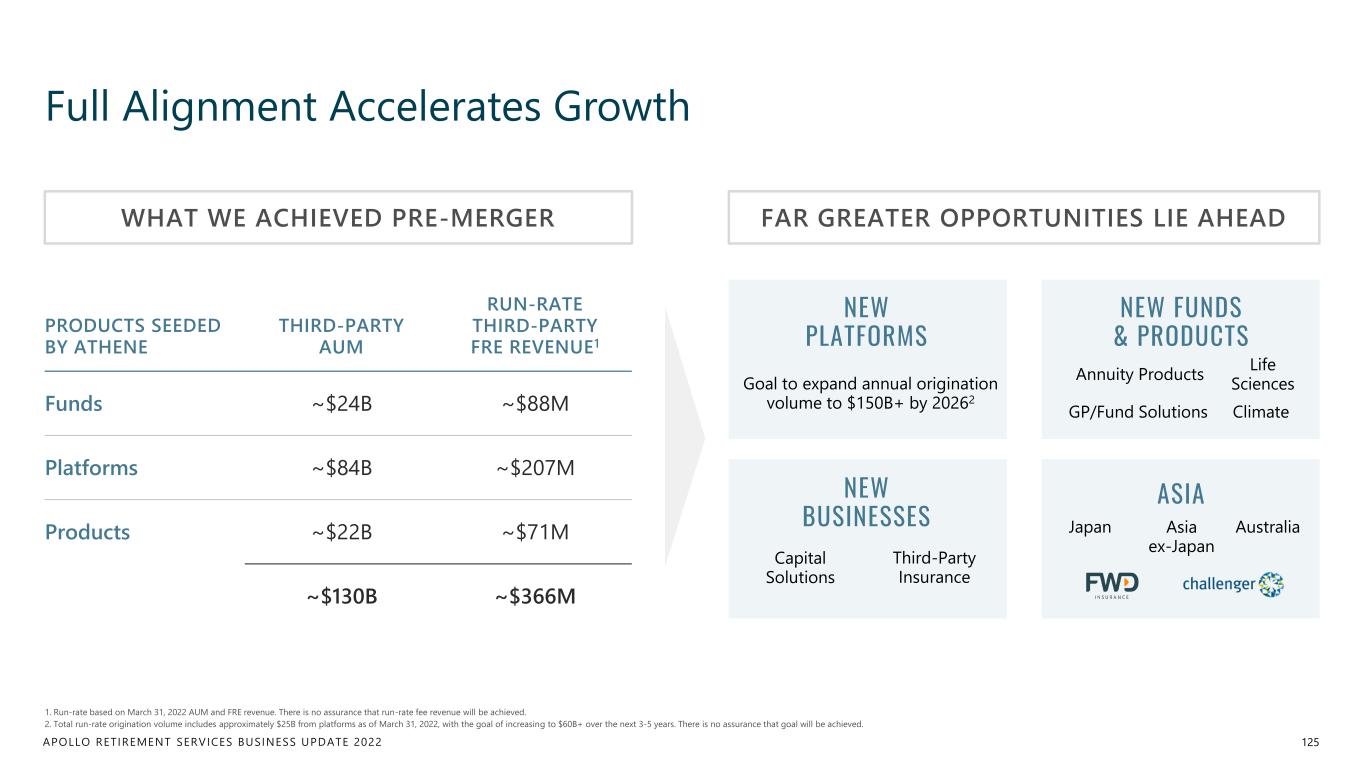
APOLLO RETIREMENT SERVICES BUSINESS UPDATE 2022 Full Alignment Accelerates Growth 125 1. Run-rate based on March 31, 2022 AUM and FRE revenue. There is no assurance that run-rate fee revenue will be achieved. 2. Total run-rate origination volume includes approximately $25B from platforms as of March 31, 2022, with the goal of increasing to $60B+ over the next 3-5 years. There is no assurance that goal will be achieved. PRODUCTS SEEDED BY ATHENE THIRD-PARTY AUM RUN-RATE THIRD-PARTY FRE REVENUE1 Funds ~$24B ~$88M Platforms ~$84B ~$207M Products ~$22B ~$71M ~$130B ~$366M WHAT WE ACHIEVED PRE-MERGER FAR GREATER OPPORTUNITIES LIE AHEAD Goal to expand annual origination volume to $150B+ by 20262 Japan AustraliaAsia ex-Japan Capital Solutions Third-Party Insurance Annuity Products GP/Fund Solutions Climate Life Sciences NEW BUSINESSES NEW PLATFORMS NEW FUNDS & PRODUCTS ASIA
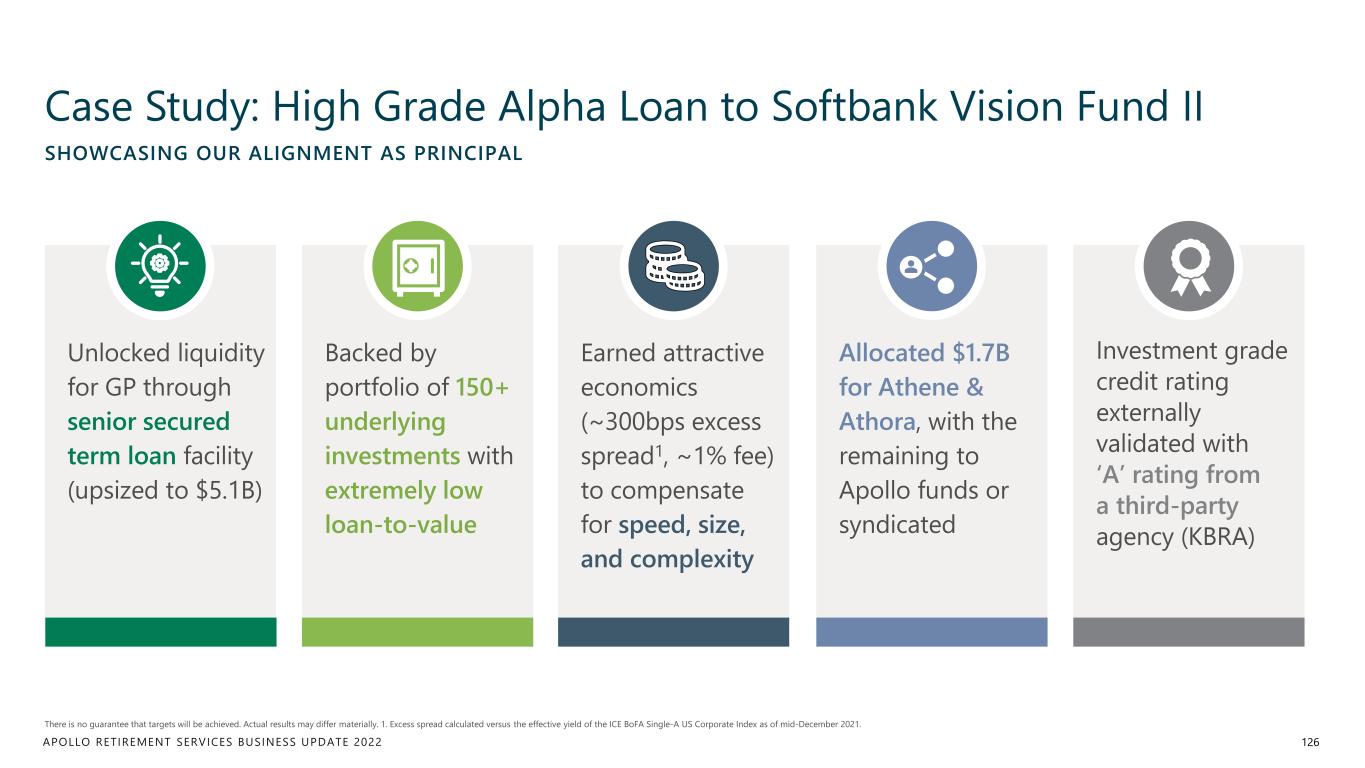
APOLLO RETIREMENT SERVICES BUSINESS UPDATE 2022 Case Study: High Grade Alpha Loan to Softbank Vision Fund II 126 SHOWCASING OUR ALIGNMENT AS PRINCIPAL Unlocked liquidity for GP through senior secured term loan facility (upsized to $5.1B) Backed by portfolio of 150+ underlying investments with extremely low loan-to-value Earned attractive economics (~300bps excess spread1, ~1% fee) to compensate for speed, size, and complexity Allocated $1.7B for Athene & Athora, with the remaining to Apollo funds or syndicated Investment grade credit rating externally validated with ‘A’ rating from a third-party agency (KBRA) 126 There is no guarantee that targets will be achieved. Actual results may differ materially. 1. Excess spread calculated versus the effective yield of the ICE BoFA Single-A US Corporate Index as of mid-December 2021.
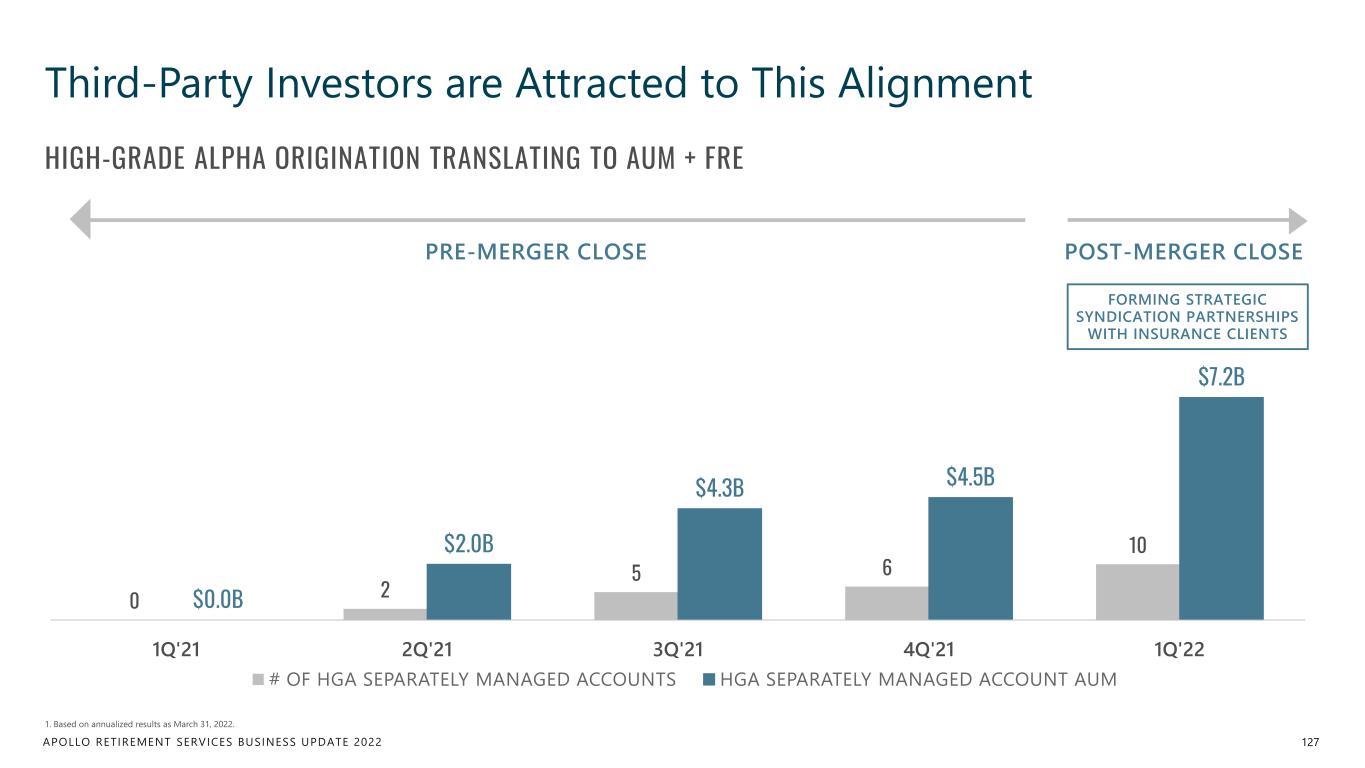
APOLLO RETIREMENT SERVICES BUSINESS UPDATE 2022 Third-Party Investors are Attracted to This Alignment 127 HIGH-GRADE ALPHA ORIGINATION TRANSLATING TO AUM + FRE 0 2 5 6 10 $0.0B $2.0B $4.3B $4.5B $7.2B 1Q'21 2Q'21 3Q'21 4Q'21 1Q'22 # OF HGA SEPARATELY MANAGED ACCOUNTS HGA SEPARATELY MANAGED ACCOUNT AUM PRE-MERGER CLOSE POST-MERGER CLOSE FORMING STRATEGIC SYNDICATION PARTNERSHIPS WITH INSURANCE CLIENTS 1. Based on annualized results as March 31, 2022.
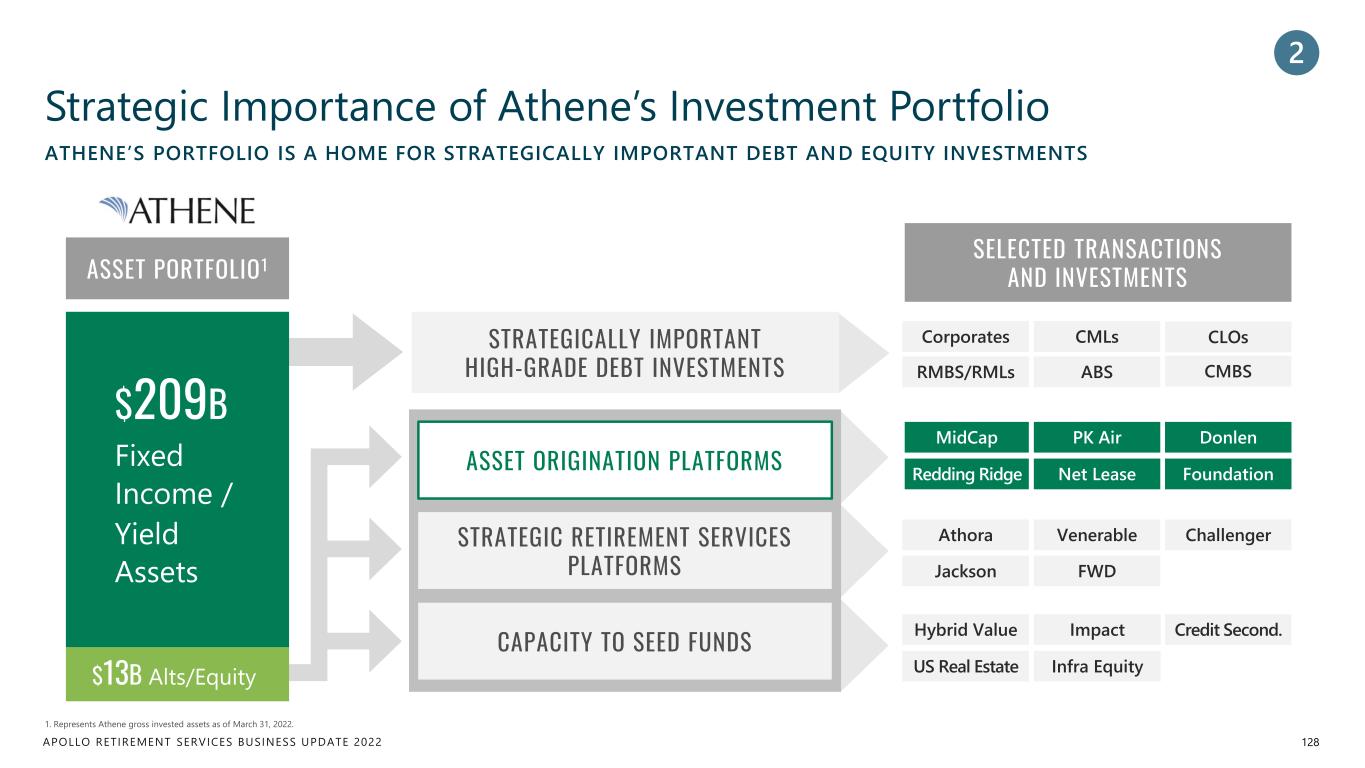
APOLLO RETIREMENT SERVICES BUSINESS UPDATE 2022 Strategic Importance of Athene’s Investment Portfolio 128 1. Represents Athene gross invested assets as of March 31, 2022. ATHENE’S PORTFOLIO IS A HOME FOR STRATEGICALLY IMPORTANT DEBT AND EQUITY INVESTMENTS ASSET PORTFOLIO1 SELECTED TRANSACTIONS AND INVESTMENTS Corporates CMLs RMBS/RMLs CLOs CMBSABS MidCap PK Air Redding Ridge Donlen FoundationNet Lease Hybrid Value US Real Estate Infra Equity Credit Second.Impact Athora Venerable Jackson FWD Challenger STRATEGICALLY IMPORTANT HIGH-GRADE DEBT INVESTMENTS ASSET ORIGINATION PLATFORMS STRATEGIC RETIREMENT SERVICES PLATFORMS CAPACITY TO SEED FUNDS 2 $209B Fixed Income / Yield Assets $13B Alts/Equity
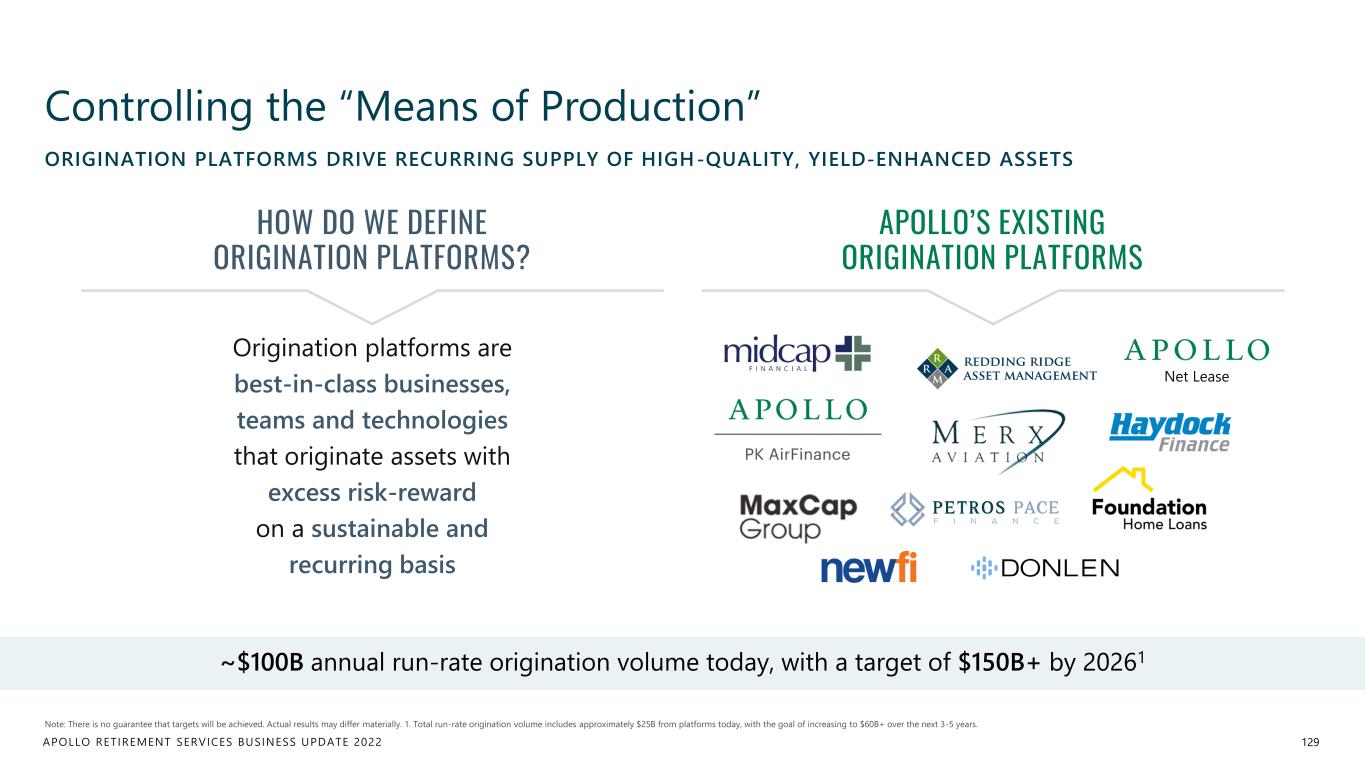
APOLLO RETIREMENT SERVICES BUSINESS UPDATE 2022 ORIGINATION PLATFORMS DRIVE RECURRING SUPPLY OF HIGH-QUALITY, YIELD-ENHANCED ASSETS Controlling the “Means of Production” 129 Net Lease HOW DO WE DEFINE ORIGINATION PLATFORMS? APOLLO’S EXISTING ORIGINATION PLATFORMS Origination platforms are best-in-class businesses, teams and technologies that originate assets with excess risk-reward on a sustainable and recurring basis ~$100B annual run-rate origination volume today, with a target of $150B+ by 20261 Note: There is no guarantee that targets will be achieved. Actual results may differ materially. 1. Total run-rate origination volume includes approximately $25B from platforms today, with the goal of increasing to $60B+ over the next 3-5 years.
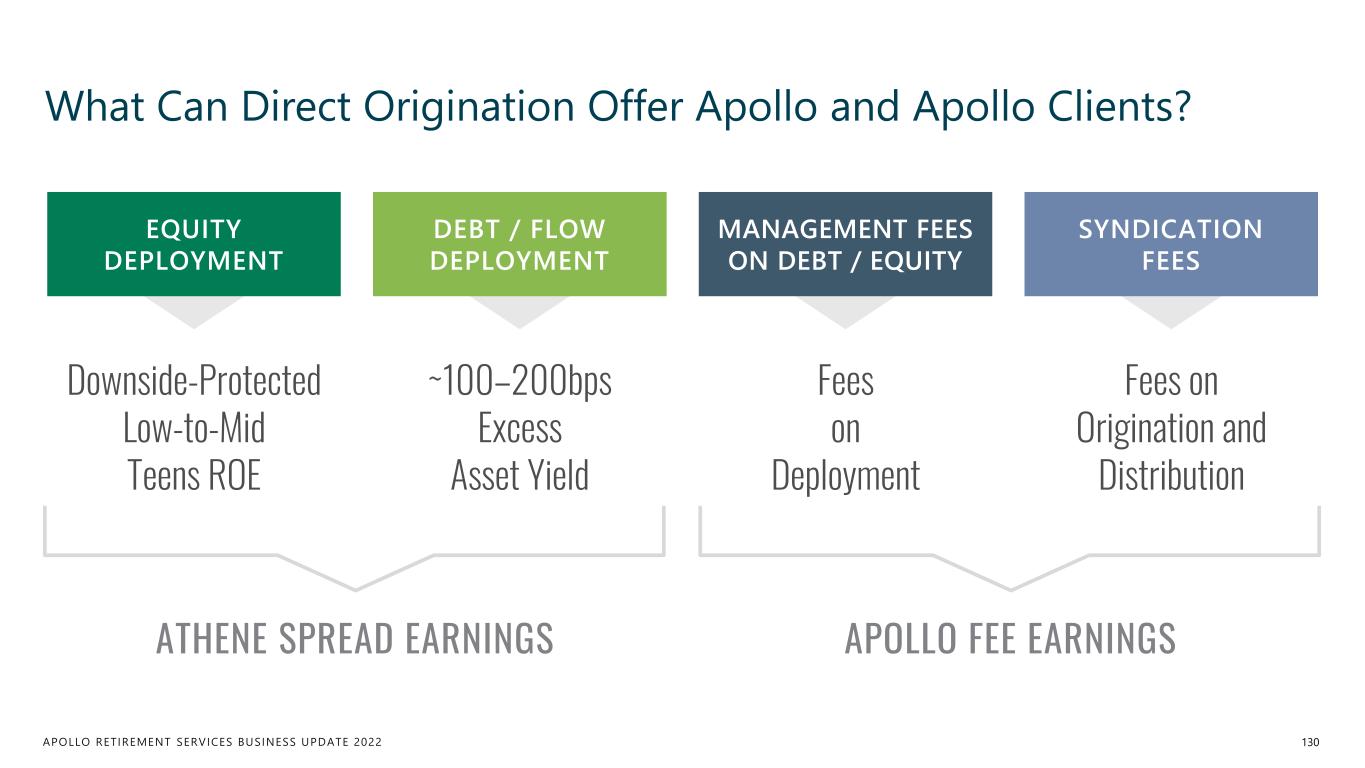
APOLLO RETIREMENT SERVICES BUSINESS UPDATE 2022 What Can Direct Origination Offer Apollo and Apollo Clients? 130 EQUITY DEPLOYMENT Downside-Protected Low-to-Mid Teens ROE DEBT / FLOW DEPLOYMENT ~100–200bps Excess Asset Yield MANAGEMENT FEES ON DEBT / EQUITY Fees on Deployment SYNDICATION FEES Fees on Origination and Distribution ATHENE SPREAD EARNINGS APOLLO FEE EARNINGS
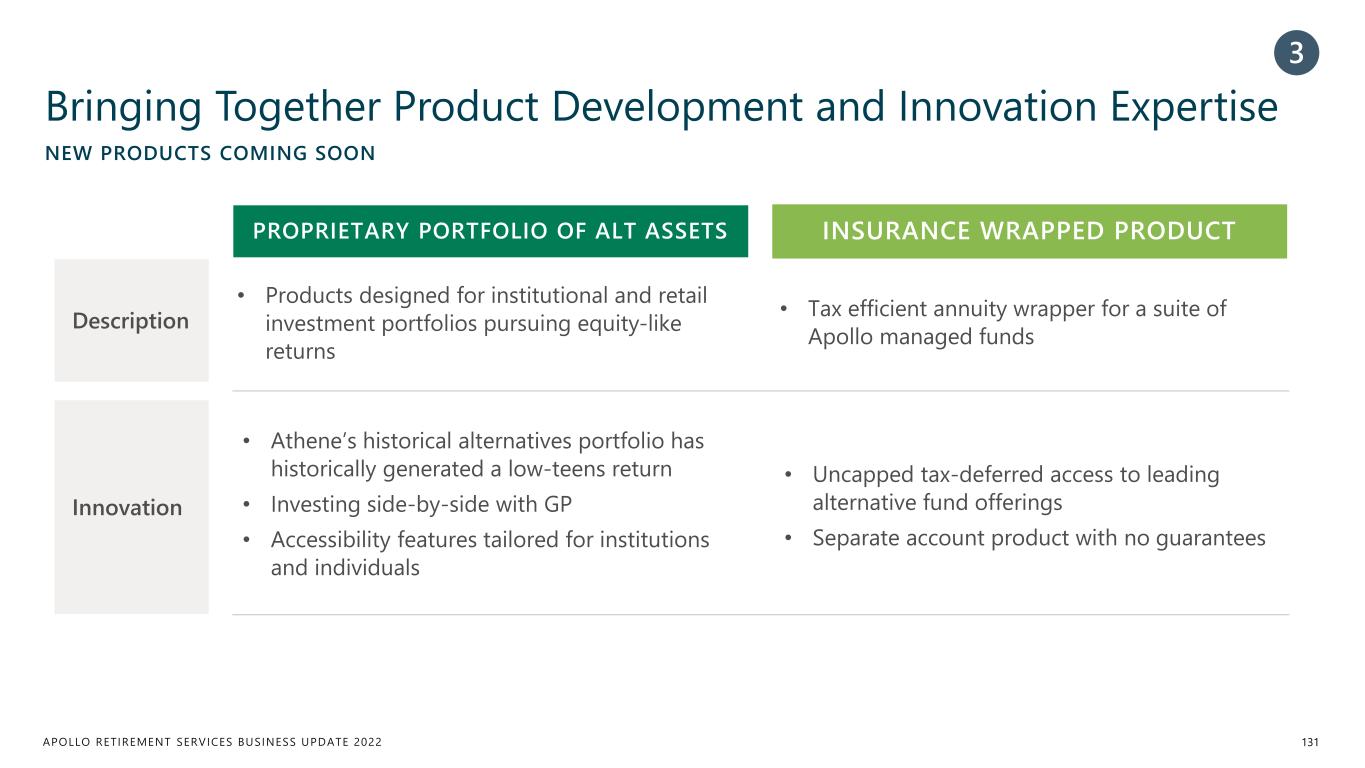
APOLLO RETIREMENT SERVICES BUSINESS UPDATE 2022 NEW PRODUCTS COMING SOON Bringing Together Product Development and Innovation Expertise 131 PROPRIETARY PORTFOLIO OF ALT ASSETS INSURANCE WRAPPED PRODUCT Description • Athene’s historical alternatives portfolio has historically generated a low-teens return • Investing side-by-side with GP • Accessibility features tailored for institutions and individuals • Products designed for institutional and retail investment portfolios pursuing equity-like returns • Uncapped tax-deferred access to leading alternative fund offerings • Separate account product with no guarantees • Tax efficient annuity wrapper for a suite of Apollo managed funds 3 Innovation
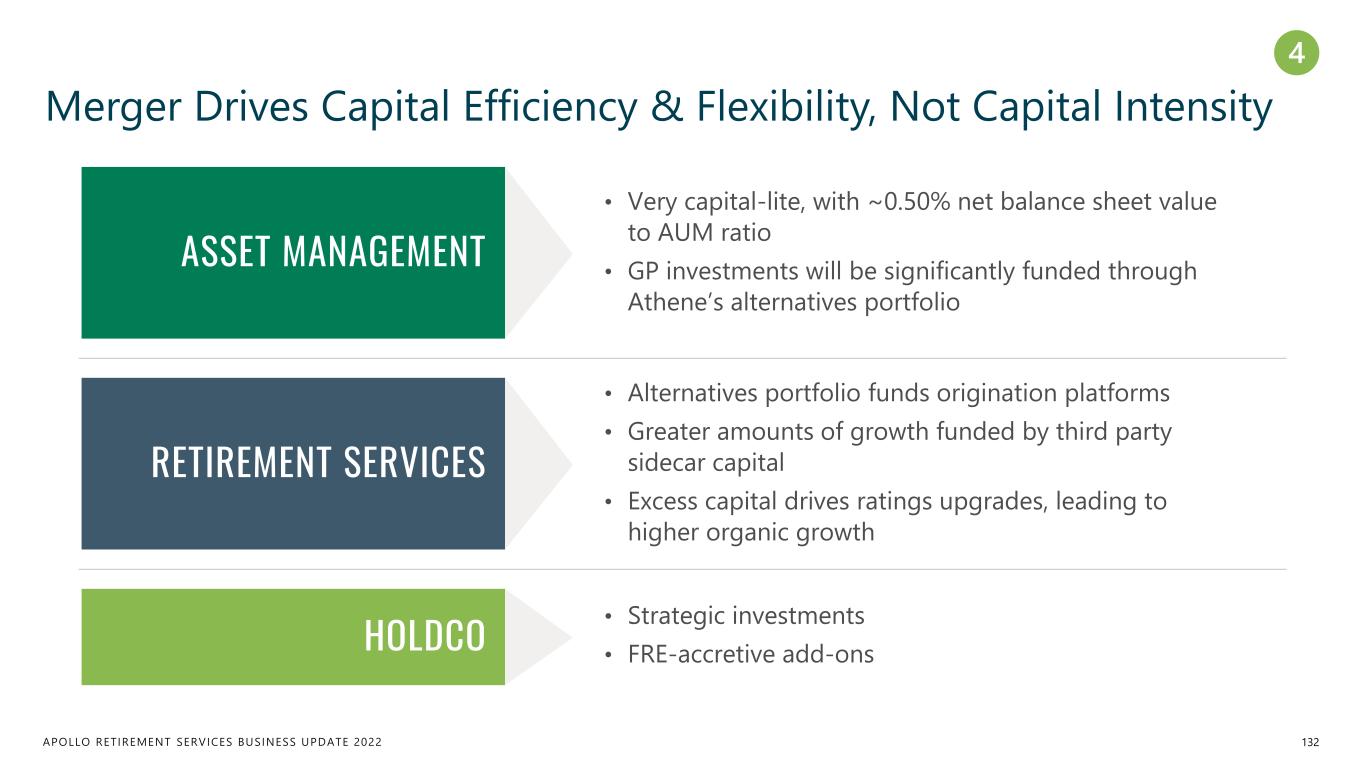
APOLLO RETIREMENT SERVICES BUSINESS UPDATE 2022 Merger Drives Capital Efficiency & Flexibility, Not Capital Intensity 132 ASSET MANAGEMENT • Very capital-lite, with ~0.50% net balance sheet value to AUM ratio • GP investments will be significantly funded through Athene’s alternatives portfolio RETIREMENT SERVICES • Alternatives portfolio funds origination platforms • Greater amounts of growth funded by third party sidecar capital • Excess capital drives ratings upgrades, leading to higher organic growth HOLDCO • Strategic investments • FRE-accretive add-ons 4
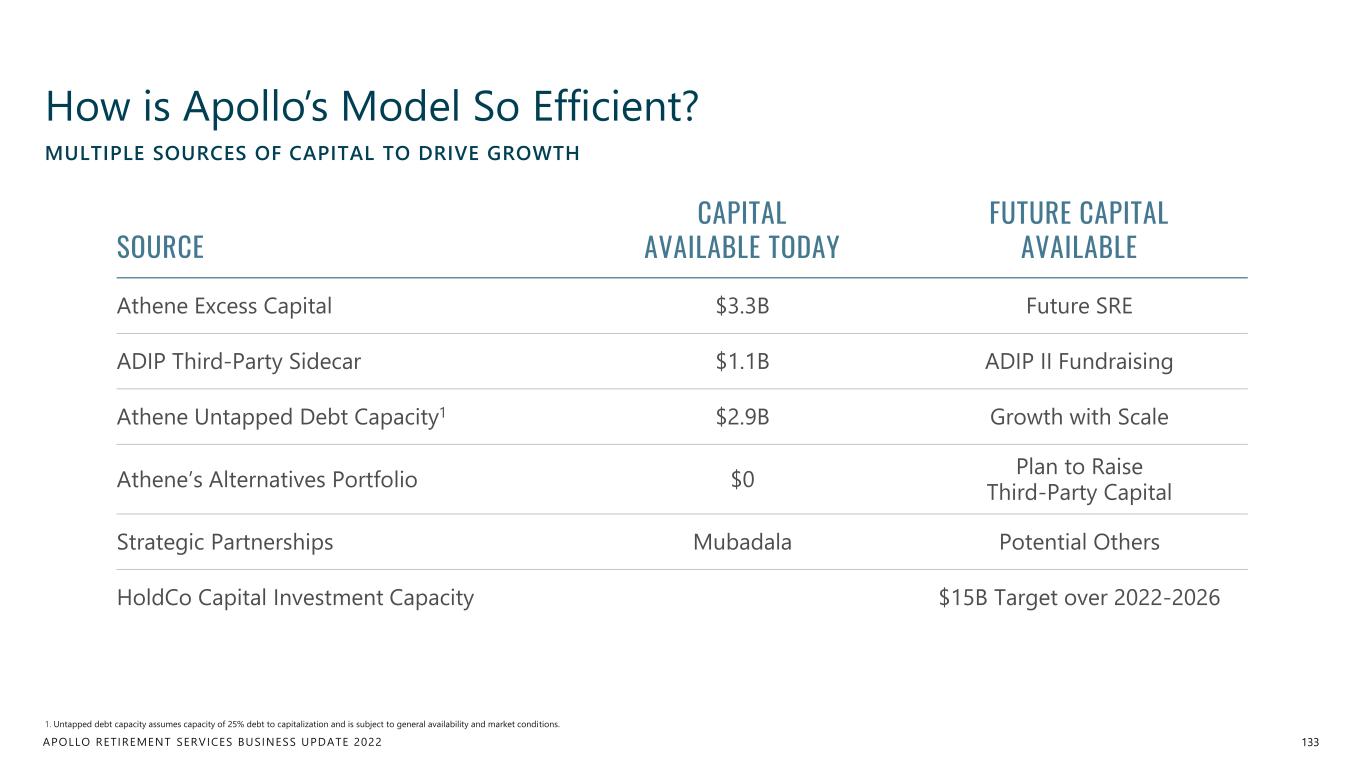
APOLLO RETIREMENT SERVICES BUSINESS UPDATE 2022 How is Apollo’s Model So Efficient? 133 1. Untapped debt capacity assumes capacity of 25% debt to capitalization and is subject to general availability and market conditions. MULTIPLE SOURCES OF CAPITAL TO DRIVE GROWTH SOURCE CAPITAL AVAILABLE TODAY FUTURE CAPITAL AVAILABLE Athene Excess Capital $3.3B Future SRE ADIP Third-Party Sidecar $1.1B ADIP II Fundraising Athene Untapped Debt Capacity1 $2.9B Growth with Scale Athene’s Alternatives Portfolio $0 Plan to Raise Third-Party Capital Strategic Partnerships Mubadala Potential Others HoldCo Capital Investment Capacity $15B Target over 2022-2026
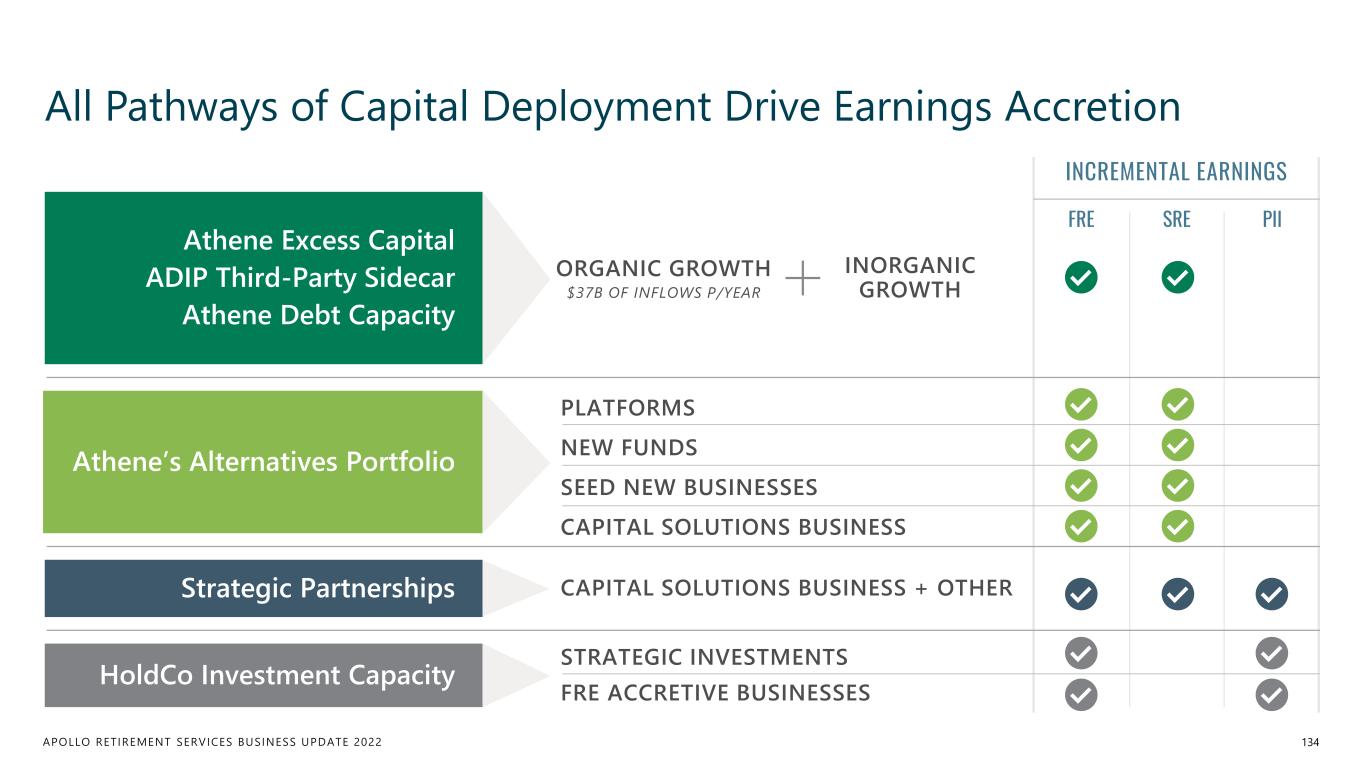
APOLLO RETIREMENT SERVICES BUSINESS UPDATE 2022 All Pathways of Capital Deployment Drive Earnings Accretion 134 ORGANIC GROWTH $37B OF INFLOWS P/YEAR INORGANIC GROWTH PLATFORMS NEW FUNDS SEED NEW BUSINESSES CAPITAL SOLUTIONS BUSINESS CAPITAL SOLUTIONS BUSINESS + OTHER STRATEGIC INVESTMENTS FRE ACCRETIVE BUSINESSES INCREMENTAL EARNINGS FRE SRE PII Athene Excess Capital ADIP Third-Party Sidecar Athene Debt Capacity Athene’s Alternatives Portfolio Strategic Partnerships HoldCo Investment Capacity
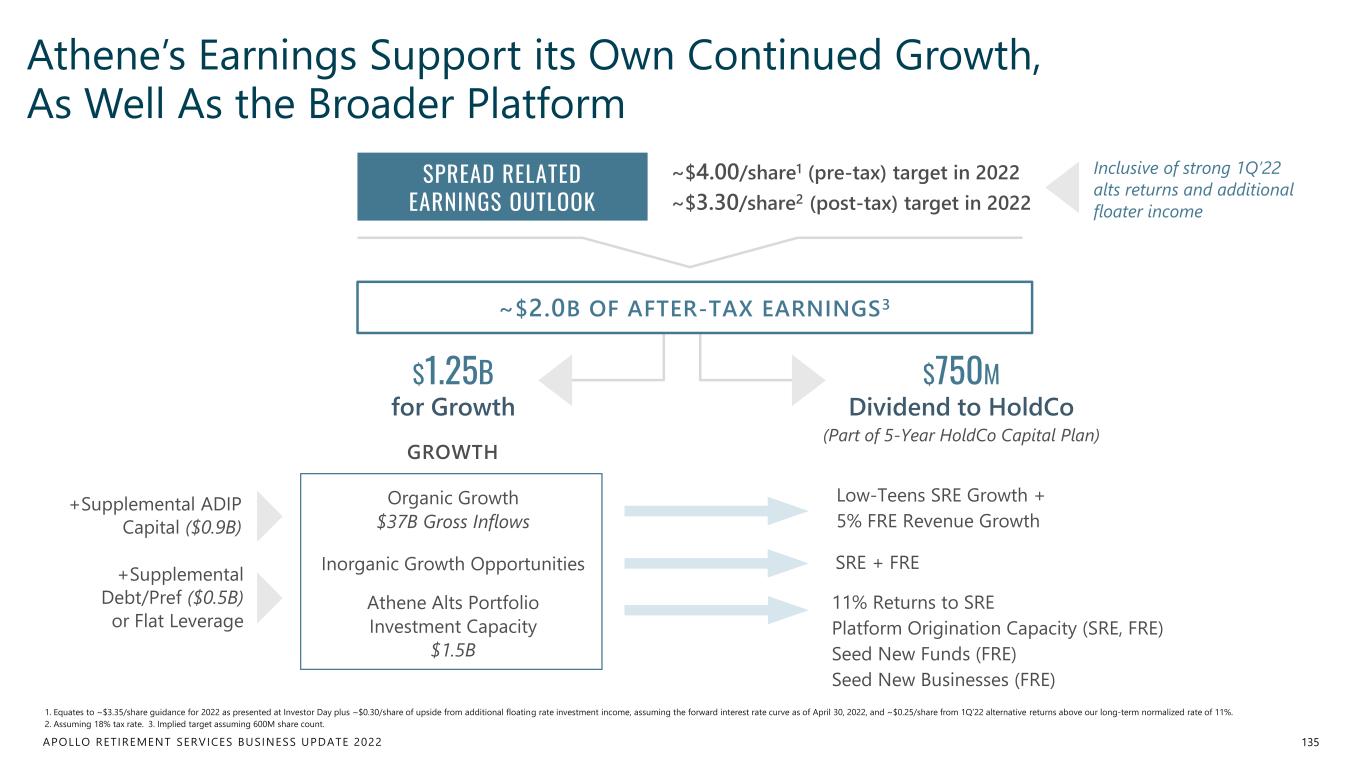
APOLLO RETIREMENT SERVICES BUSINESS UPDATE 2022 Athene’s Earnings Support its Own Continued Growth, As Well As the Broader Platform 135 1. Equates to ~$3.35/share guidance for 2022 as presented at Investor Day plus ~$0.30/share of upside from additional floating rate investment income, assuming the forward interest rate curve as of April 30, 2022, and ~$0.25/share from 1Q’22 alternative returns above our long-term normalized rate of 11%. 2. Assuming 18% tax rate. 3. Implied target assuming 600M share count. SPREAD RELATED EARNINGS OUTLOOK ~$4.00/share1 (pre-tax) target in 2022 ~$3.30/share2 (post-tax) target in 2022 ~$2.0B OF AFTER-TAX EARNINGS3 +Supplemental ADIP Capital ($0.9B) +Supplemental Debt/Pref ($0.5B) or Flat Leverage Low-Teens SRE Growth + 5% FRE Revenue Growth SRE + FRE 11% Returns to SRE Platform Origination Capacity (SRE, FRE) Seed New Funds (FRE) Seed New Businesses (FRE) $750M Dividend to HoldCo $1.25B for Growth (Part of 5-Year HoldCo Capital Plan) GROWTH Organic Growth $37B Gross Inflows Inorganic Growth Opportunities Athene Alts Portfolio Investment Capacity $1.5B Inclusive of strong 1Q’22 alts returns and additional floater income
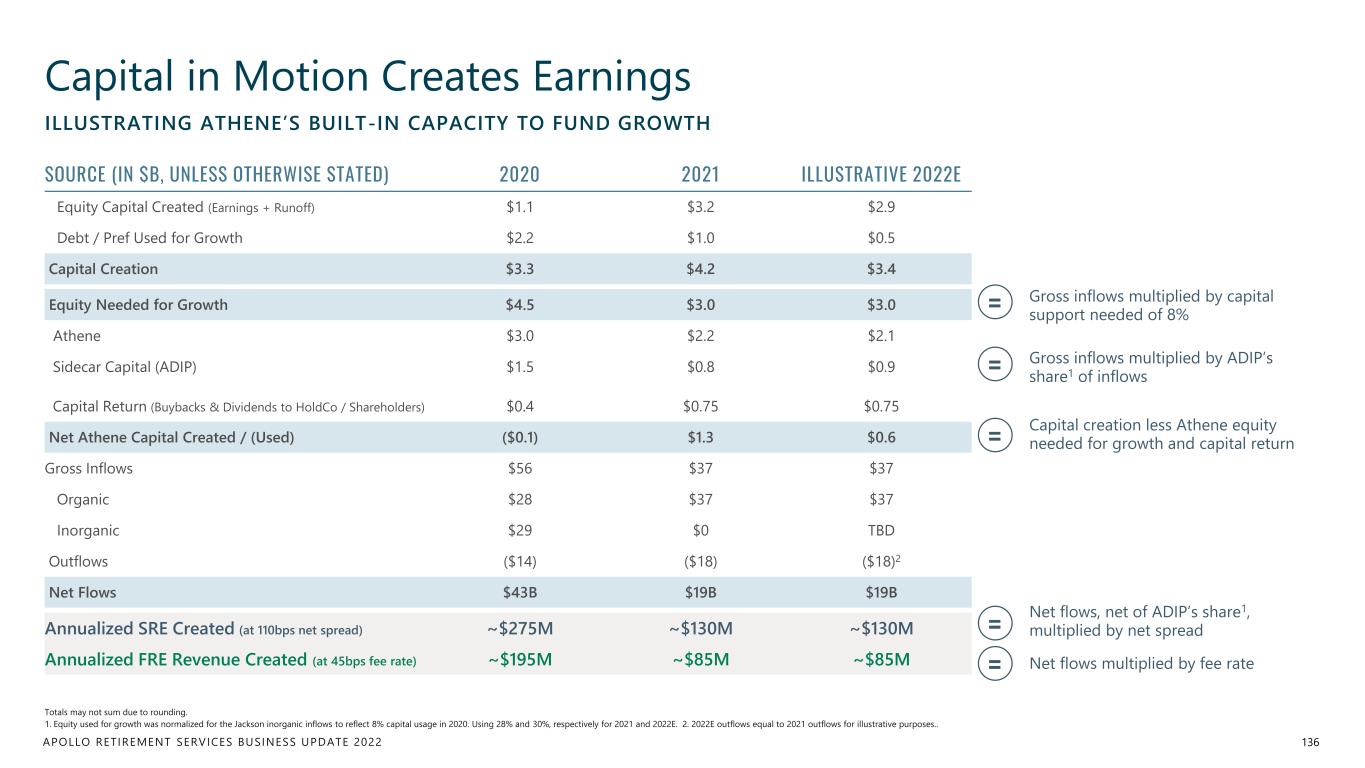
APOLLO RETIREMENT SERVICES BUSINESS UPDATE 2022 Capital in Motion Creates Earnings 136 Totals may not sum due to rounding. 1. Equity used for growth was normalized for the Jackson inorganic inflows to reflect 8% capital usage in 2020. Using 28% and 30%, respectively for 2021 and 2022E. 2. 2022E outflows equal to 2021 outflows for illustrative purposes.. ILLUSTRATING ATHENE’S BUILT-IN CAPACITY TO FUND GROWTH SOURCE (IN $B, UNLESS OTHERWISE STATED) 2020 2021 ILLUSTRATIVE 2022E Equity Capital Created (Earnings + Runoff) $1.1 $3.2 $2.9 Debt / Pref Used for Growth $2.2 $1.0 $0.5 Capital Creation $3.3 $4.2 $3.4 Equity Needed for Growth $4.5 $3.0 $3.0 Athene $3.0 $2.2 $2.1 Sidecar Capital (ADIP) $1.5 $0.8 $0.9 Capital Return (Buybacks & Dividends to HoldCo / Shareholders) $0.4 $0.75 $0.75 Net Athene Capital Created / (Used) ($0.1) $1.3 $0.6 Gross Inflows $56 $37 $37 Organic $28 $37 $37 Inorganic $29 $0 TBD Outflows ($14) ($18) ($18)2 Net Flows $43B $19B $19B Annualized SRE Created (at 110bps net spread) ~$275M ~$130M ~$130M Annualized FRE Revenue Created (at 45bps fee rate) ~$195M ~$85M ~$85M Gross inflows multiplied by capital support needed of 8% Gross inflows multiplied by ADIP’s share1 of inflows Capital creation less Athene equity needed for growth and capital return Net flows, net of ADIP’s share1, multiplied by net spread Net flows multiplied by fee rate = = = = =
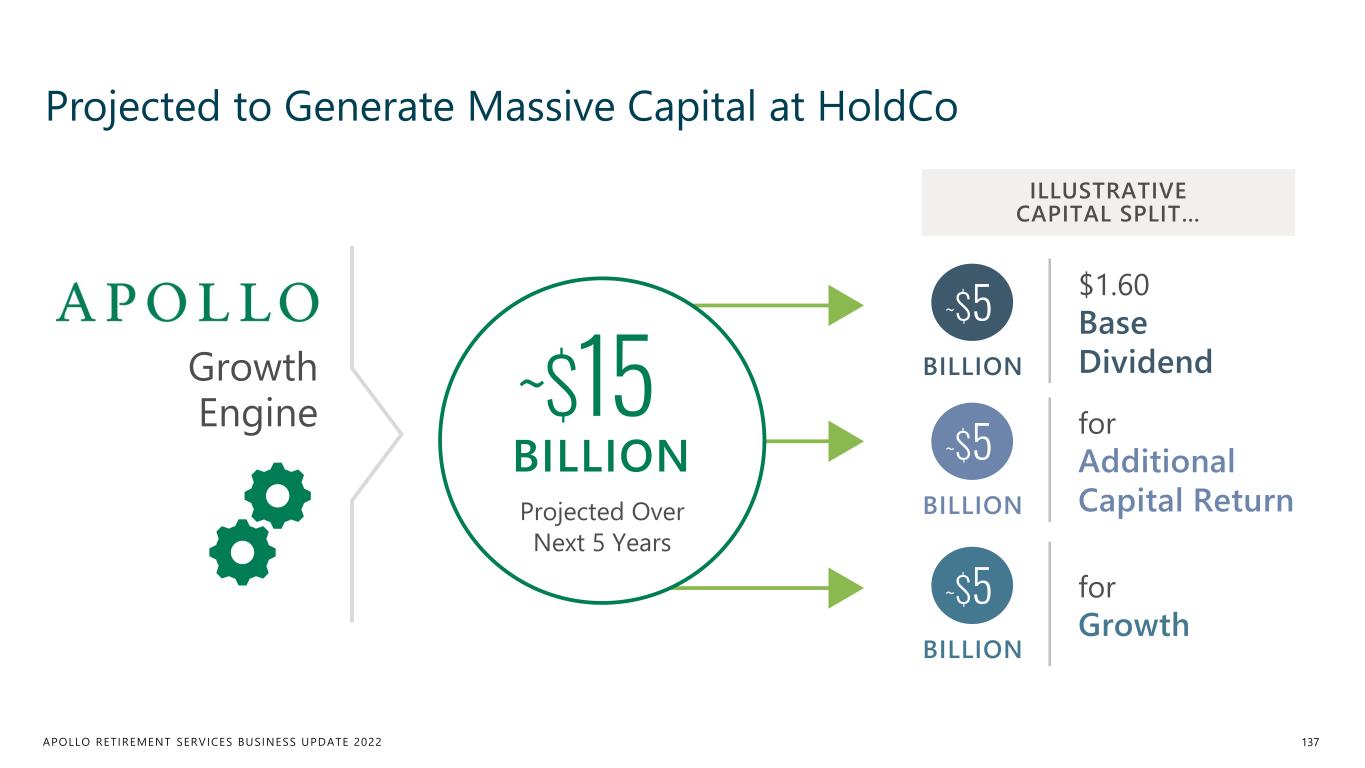
APOLLO RETIREMENT SERVICES BUSINESS UPDATE 2022 Projected to Generate Massive Capital at HoldCo 137 Growth Engine ILLUSTRATIVE CAPITAL SPLIT… $1.60 Base Dividend ~$5 BILLION for Additional Capital Return ~$5 BILLION for Growth ~$5 BILLION Projected Over Next 5 Years ~$15 BILLION
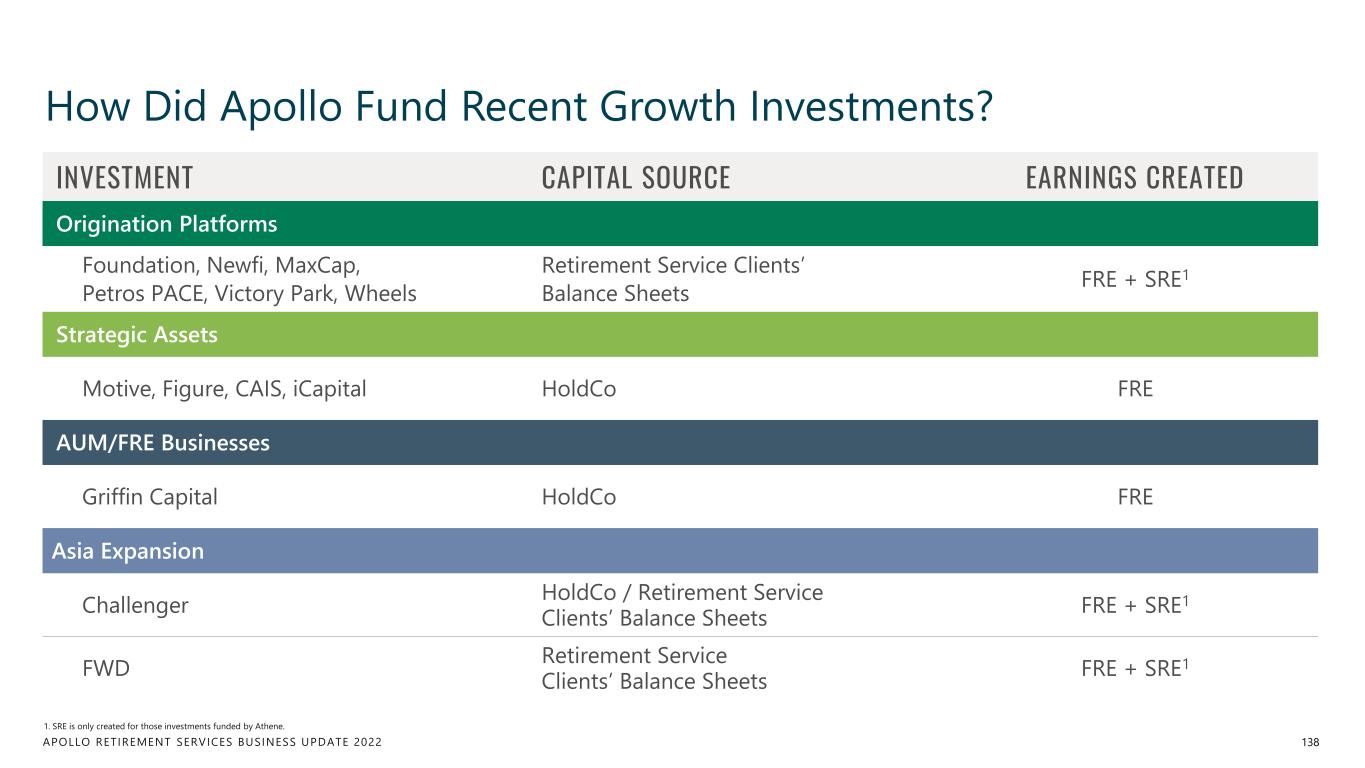
APOLLO RETIREMENT SERVICES BUSINESS UPDATE 2022 How Did Apollo Fund Recent Growth Investments? 138 INVESTMENT CAPITAL SOURCE EARNINGS CREATED Origination Platforms Foundation, Newfi, MaxCap, Petros PACE, Victory Park, Wheels Retirement Service Clients’ Balance Sheets FRE + SRE1 Strategic Assets Motive, Figure, CAIS, iCapital HoldCo FRE AUM/FRE Businesses Griffin Capital HoldCo FRE Asia Expansion Challenger HoldCo / Retirement Service Clients’ Balance Sheets FRE + SRE1 FWD Retirement Service Clients’ Balance Sheets FRE + SRE1 1. SRE is only created for those investments funded by Athene.
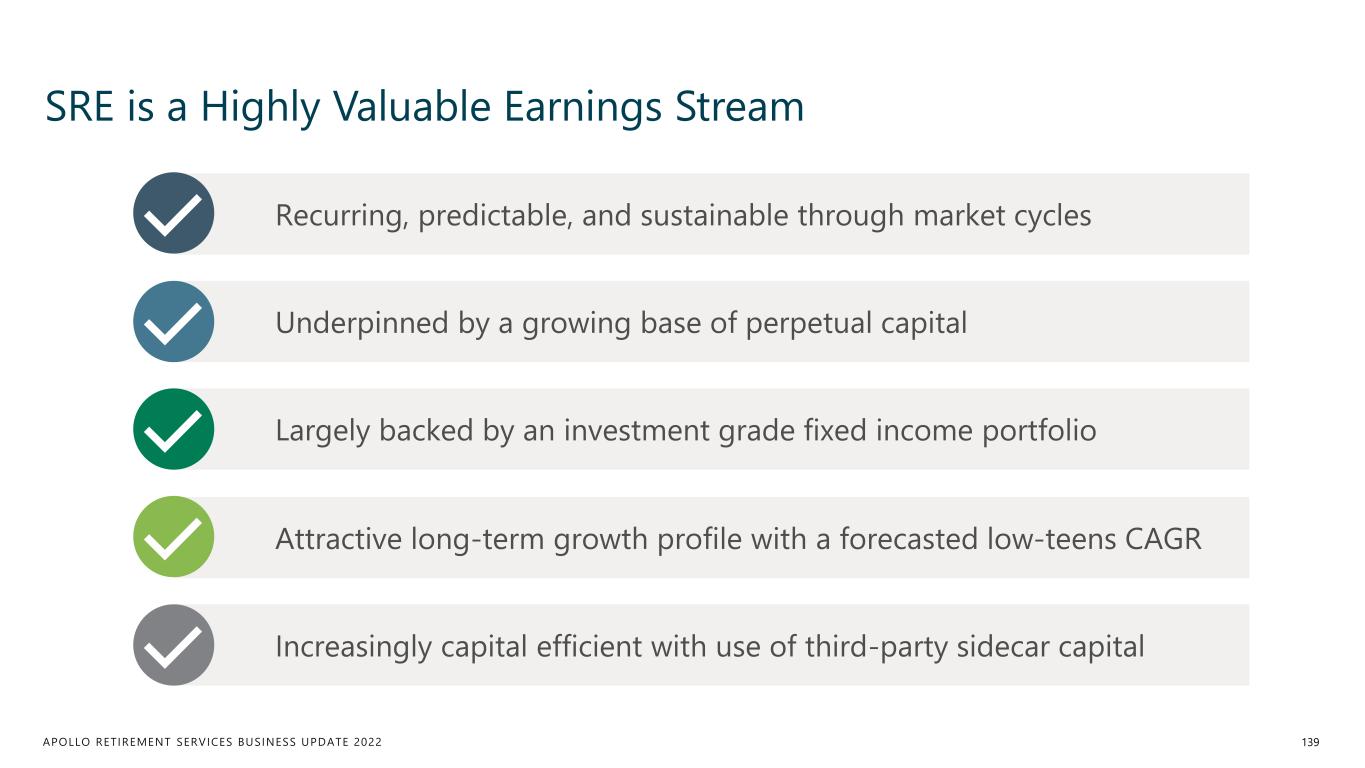
APOLLO RETIREMENT SERVICES BUSINESS UPDATE 2022 SRE is a Highly Valuable Earnings Stream 139 Recurring, predictable, and sustainable through market cycles Underpinned by a growing base of perpetual capital Largely backed by an investment grade fixed income portfolio Increasingly capital efficient with use of third-party sidecar capital Attractive long-term growth profile with a forecasted low-teens CAGR

APOLLO RETIREMENT SERVICES BUSINESS UPDATE 2022 NON-TRADED BDC / REIT MODEL RETIREMENT SERVICES MODEL Portfolio Non-Investment Grade Assets Investment Grade Assets Hurdle 5-8% Hurdle ~2.5% Cost of Funds High Water Mark? Yes, Driving Volatility None Profitability Cyclical All Weather Marks Marked-to-Market Held at Cost Liquidity Periodic Liquidity None Basis of Fees Equity Assets Capital 0% Co-invest Today 8% Co-Invest Avg. P/E Multiple ~30x1 ~8x2 We Believe Retirement Services is a Superior Model 140 1. Represents the average target Consensus FRE multiple for BX and ARES (on 2023E), standardizing for stock-based compensation expense, as of May 19, 2022. 2. Represents the current average target Consensus multiple on APO’s spread related earnings (2023E), as of May 19, 2022.
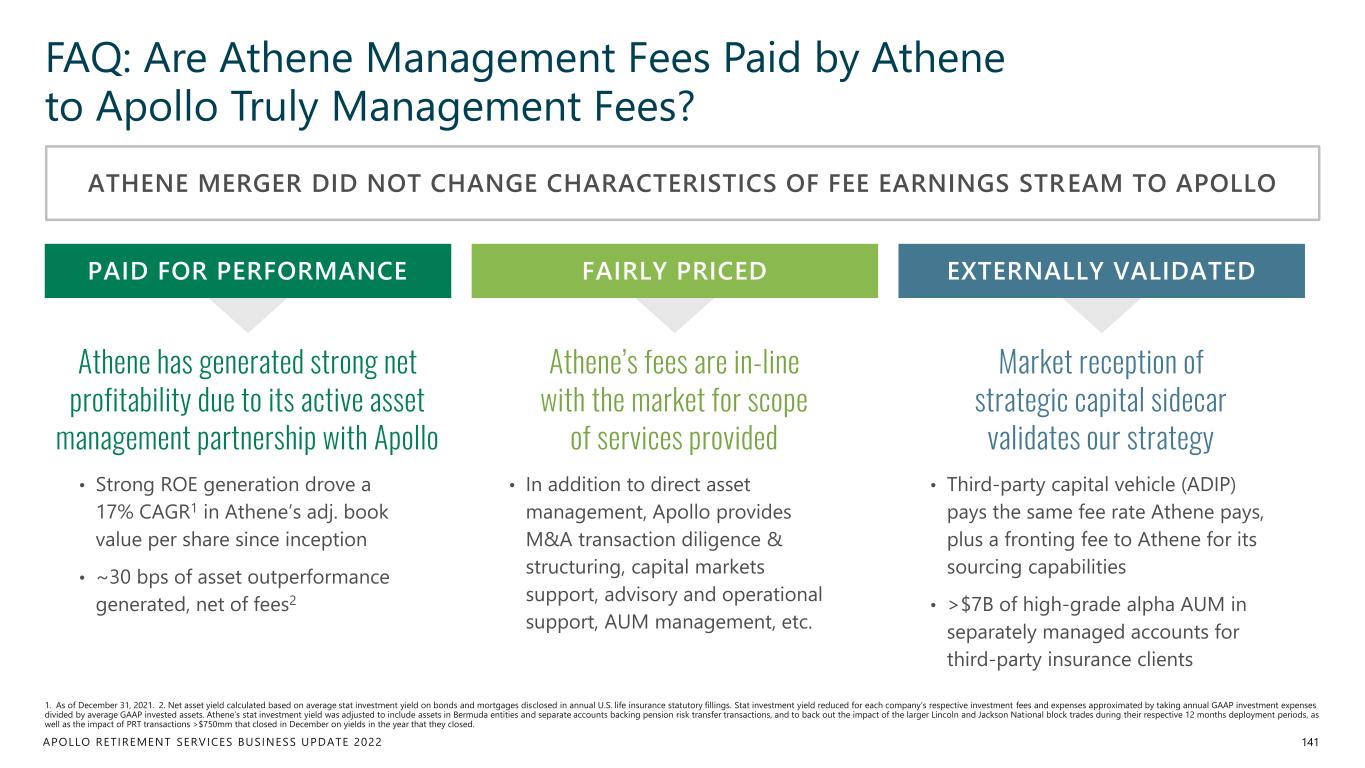
APOLLO RETIREMENT SERVICES BUSINESS UPDATE 2022 FAQ: Are Athene Management Fees Paid by Athene to Apollo Truly Management Fees? 141 1. As of December 31, 2021. 2. Net asset yield calculated based on average stat investment yield on bonds and mortgages disclosed in annual U.S. life insurance statutory fillings. Stat investment yield reduced for each company’s respective investment fees and expenses approximated by taking annual GAAP investment expenses divided by average GAAP invested assets. Athene’s stat investment yield was adjusted to include assets in Bermuda entities and separate accounts backing pension risk transfer transactions, and to back out the impact of the larger Lincoln and Jackson National block trades during their respective 12 months deployment periods, as well as the impact of PRT transactions >$750mm that closed in December on yields in the year that they closed. • Strong ROE generation drove a 17% CAGR1 in Athene’s adj. book value per share since inception • ~30 bps of asset outperformance generated, net of fees2 PAID FOR PERFORMANCE FAIRLY PRICED EXTERNALLY VALIDATED • In addition to direct asset management, Apollo provides M&A transaction diligence & structuring, capital markets support, advisory and operational support, AUM management, etc. • Third-party capital vehicle (ADIP) pays the same fee rate Athene pays, plus a fronting fee to Athene for its sourcing capabilities • >$7B of high-grade alpha AUM in separately managed accounts for third-party insurance clients Athene’s fees are in-line with the market for scope of services provided ATHENE MERGER DID NOT CHANGE CHARACTERISTICS OF FEE EARNINGS STREAM TO APOLLO Market reception of strategic capital sidecar validates our strategy Athene has generated strong net profitability due to its active asset management partnership with Apollo
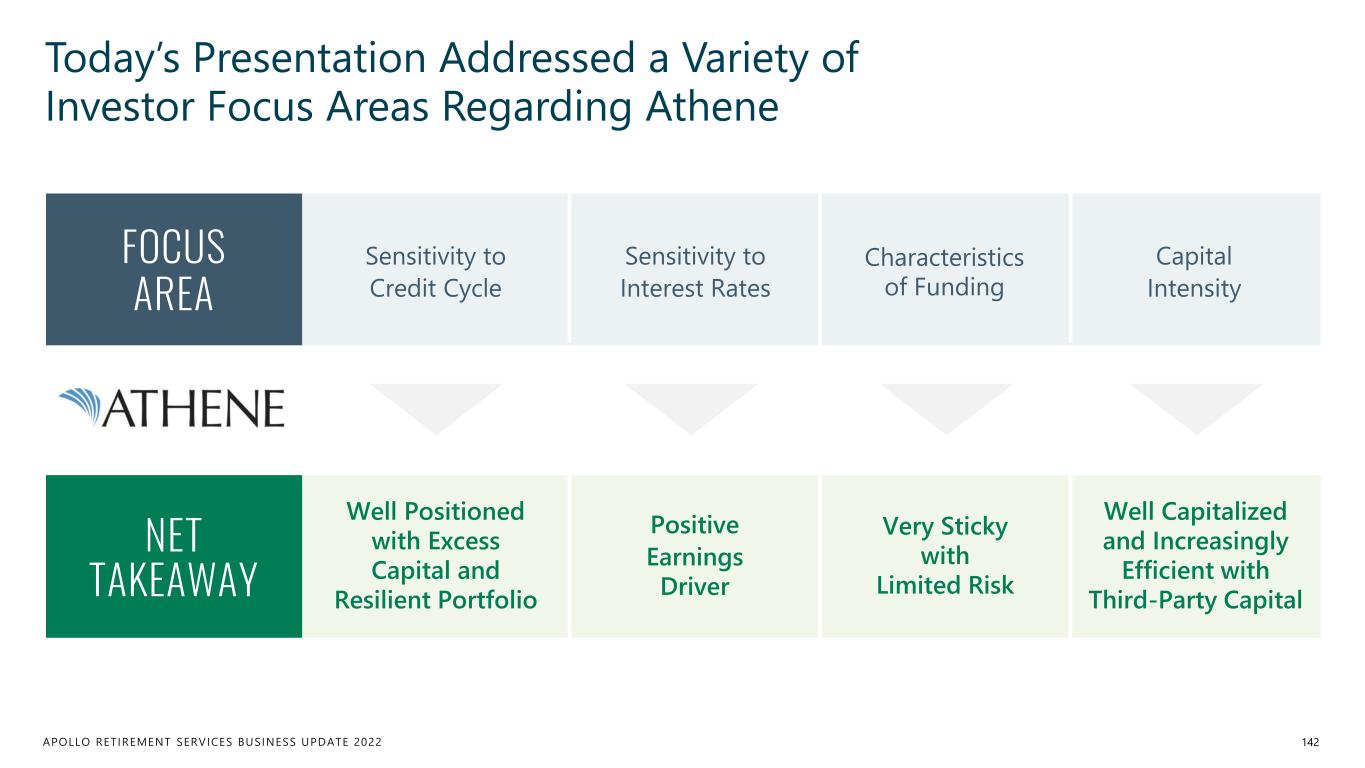
APOLLO RETIREMENT SERVICES BUSINESS UPDATE 2022 Today’s Presentation Addressed a Variety of Investor Focus Areas Regarding Athene 142 FOCUS AREA Sensitivity to Credit Cycle Sensitivity to Interest Rates Characteristics of Funding Capital Intensity NET TAKEAWAY Well Positioned with Excess Capital and Resilient Portfolio Positive Earnings Driver Very Sticky with Limited Risk Well Capitalized and Increasingly Efficient with Third-Party Capital
Reconciliation of GAAP to Non-GAAP Measures
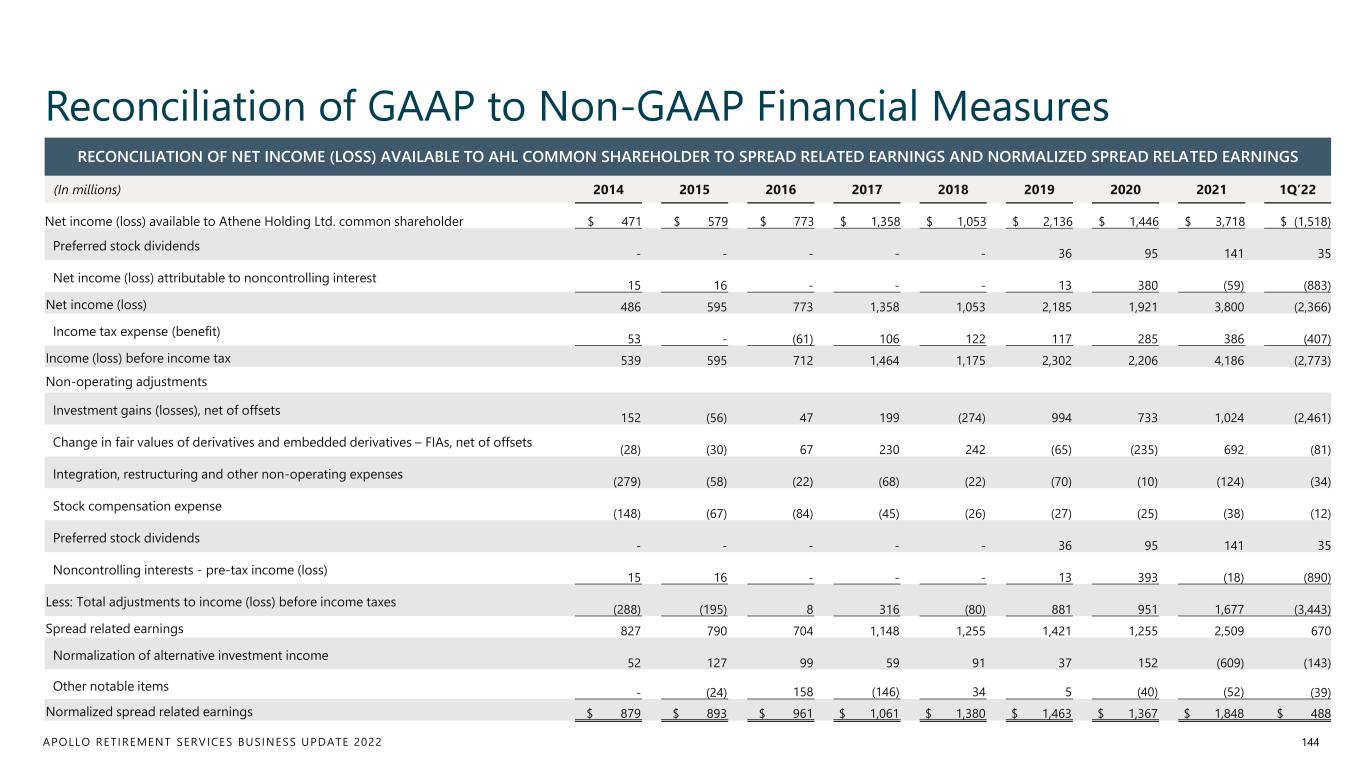
APOLLO RETIREMENT SERVICES BUSINESS UPDATE 2022 Reconciliation of GAAP to Non-GAAP Financial Measures 144 RECONCILIATION OF NET INCOME (LOSS) AVAILABLE TO AHL COMMON SHAREHOLDER TO SPREAD RELATED EARNINGS AND NORMALIZED SPREAD RELATED EARNINGS (In millions) 2014 2015 2016 2017 2018 2019 2020 2021 1Q’22 Net income (loss) available to Athene Holding Ltd. common shareholder $ 471 $ 579 $ 773 $ 1,358 $ 1,053 $ 2,136 $ 1,446 $ 3,718 $ (1,518) Preferred stock dividends - - - - - 36 95 141 35 Net income (loss) attributable to noncontrolling interest 15 16 - - - 13 380 (59) (883) Net income (loss) 486 595 773 1,358 1,053 2,185 1,921 3,800 (2,366) Income tax expense (benefit) 53 - (61) 106 122 117 285 386 (407) Income (loss) before income tax 539 595 712 1,464 1,175 2,302 2,206 4,186 (2,773) Non-operating adjustments Investment gains (losses), net of offsets 152 (56) 47 199 (274) 994 733 1,024 (2,461) Change in fair values of derivatives and embedded derivatives – FIAs, net of offsets (28) (30) 67 230 242 (65) (235) 692 (81) Integration, restructuring and other non-operating expenses (279) (58) (22) (68) (22) (70) (10) (124) (34) Stock compensation expense (148) (67) (84) (45) (26) (27) (25) (38) (12) Preferred stock dividends - - - - - 36 95 141 35 Noncontrolling interests - pre-tax income (loss) 15 16 - - - 13 393 (18) (890) Less: Total adjustments to income (loss) before income taxes (288) (195) 8 316 (80) 881 951 1,677 (3,443) Spread related earnings 827 790 704 1,148 1,255 1,421 1,255 2,509 670 Normalization of alternative investment income 52 127 99 59 91 37 152 (609) (143) Other notable items - (24) 158 (146) 34 5 (40) (52) (39) Normalized spread related earnings $ 879 $ 893 $ 961 $ 1,061 $ 1,380 $ 1,463 $ 1,367 $ 1,848 $ 488
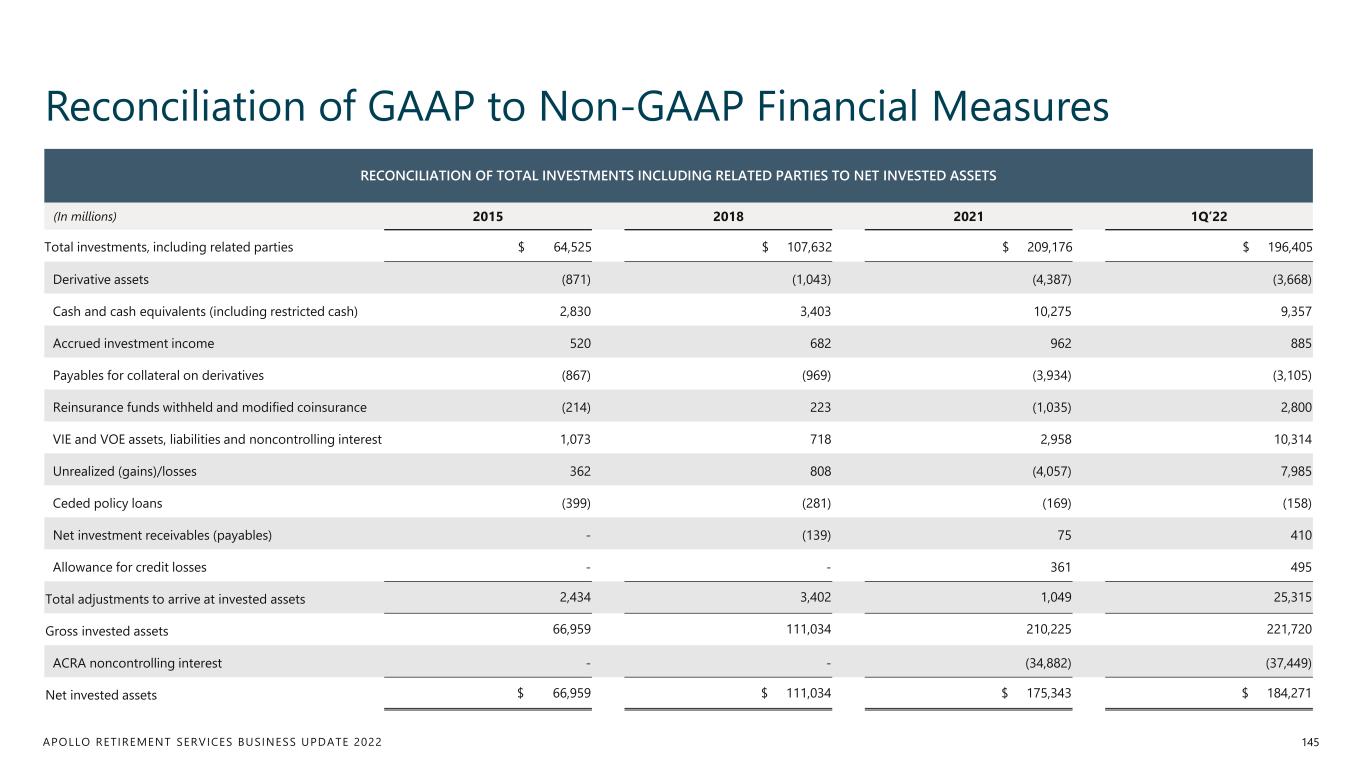
APOLLO RETIREMENT SERVICES BUSINESS UPDATE 2022 Reconciliation of GAAP to Non-GAAP Financial Measures 145 RECONCILIATION OF TOTAL INVESTMENTS INCLUDING RELATED PARTIES TO NET INVESTED ASSETS (In millions) 2015 2018 2021 1Q’22 Total investments, including related parties $ 64,525 $ 107,632 $ 209,176 $ 196,405 Derivative assets (871) (1,043) (4,387) (3,668) Cash and cash equivalents (including restricted cash) 2,830 3,403 10,275 9,357 Accrued investment income 520 682 962 885 Payables for collateral on derivatives (867) (969) (3,934) (3,105) Reinsurance funds withheld and modified coinsurance (214) 223 (1,035) 2,800 VIE and VOE assets, liabilities and noncontrolling interest 1,073 718 2,958 10,314 Unrealized (gains)/losses 362 808 (4,057) 7,985 Ceded policy loans (399) (281) (169) (158) Net investment receivables (payables) - (139) 75 410 Allowance for credit losses - - 361 495 Total adjustments to arrive at invested assets 2,434 3,402 1,049 25,315 Gross invested assets 66,959 111,034 210,225 221,720 ACRA noncontrolling interest - - (34,882) (37,449) Net invested assets $ 66,959 $ 111,034 $ 175,343 $ 184,271
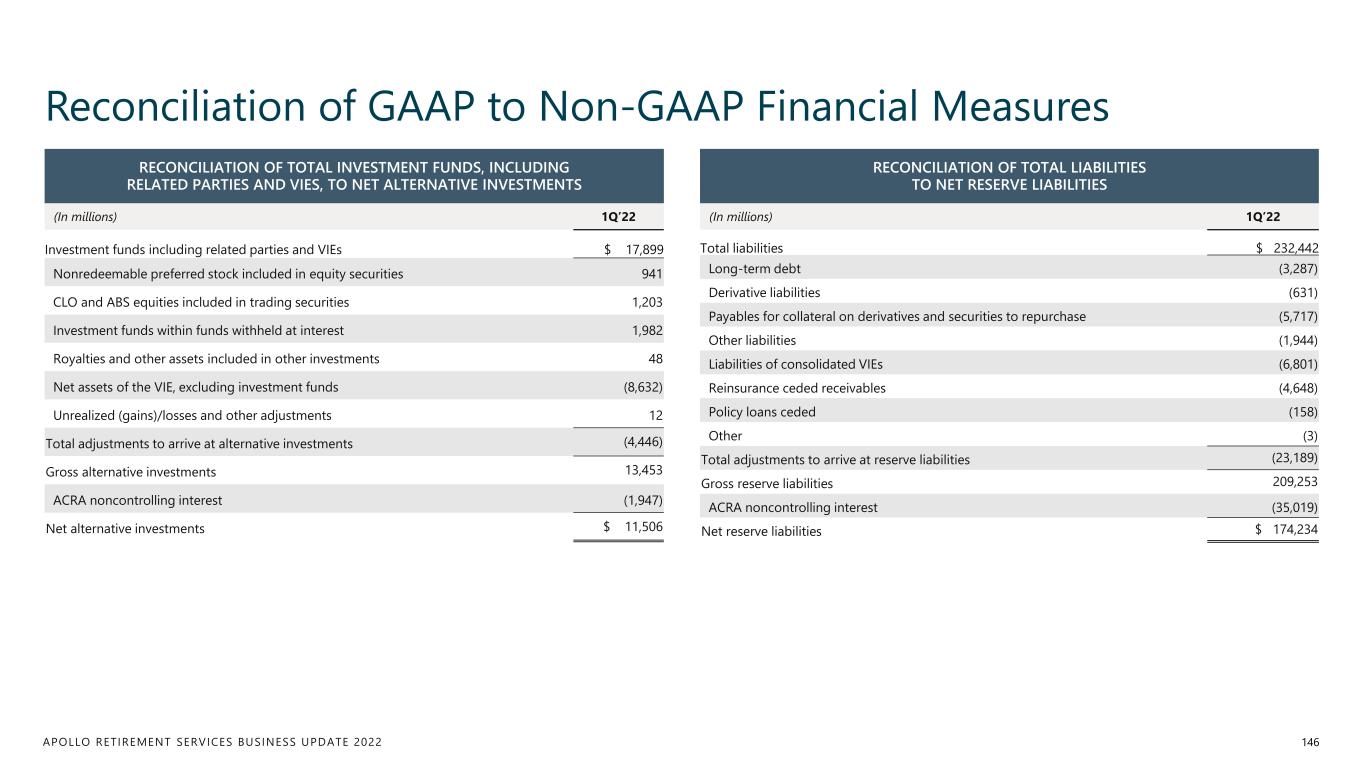
APOLLO RETIREMENT SERVICES BUSINESS UPDATE 2022 Reconciliation of GAAP to Non-GAAP Financial Measures 146 RECONCILIATION OF TOTAL INVESTMENT FUNDS, INCLUDING RELATED PARTIES AND VIES, TO NET ALTERNATIVE INVESTMENTS (In millions) 1Q’22 Investment funds including related parties and VIEs $ 17,899 Nonredeemable preferred stock included in equity securities 941 CLO and ABS equities included in trading securities 1,203 Investment funds within funds withheld at interest 1,982 Royalties and other assets included in other investments 48 Net assets of the VIE, excluding investment funds (8,632) Unrealized (gains)/losses and other adjustments 12 Total adjustments to arrive at alternative investments (4,446) Gross alternative investments 13,453 ACRA noncontrolling interest (1,947) Net alternative investments $ 11,506 RECONCILIATION OF TOTAL LIABILITIES TO NET RESERVE LIABILITIES (In millions) 1Q’22 Total liabilities $ 232,442 Long-term debt (3,287) Derivative liabilities (631) Payables for collateral on derivatives and securities to repurchase (5,717) Other liabilities (1,944) Liabilities of consolidated VIEs (6,801) Reinsurance ceded receivables (4,648) Policy loans ceded (158) Other (3) Total adjustments to arrive at reserve liabilities (23,189) Gross reserve liabilities 209,253 ACRA noncontrolling interest (35,019) Net reserve liabilities $ 174,234
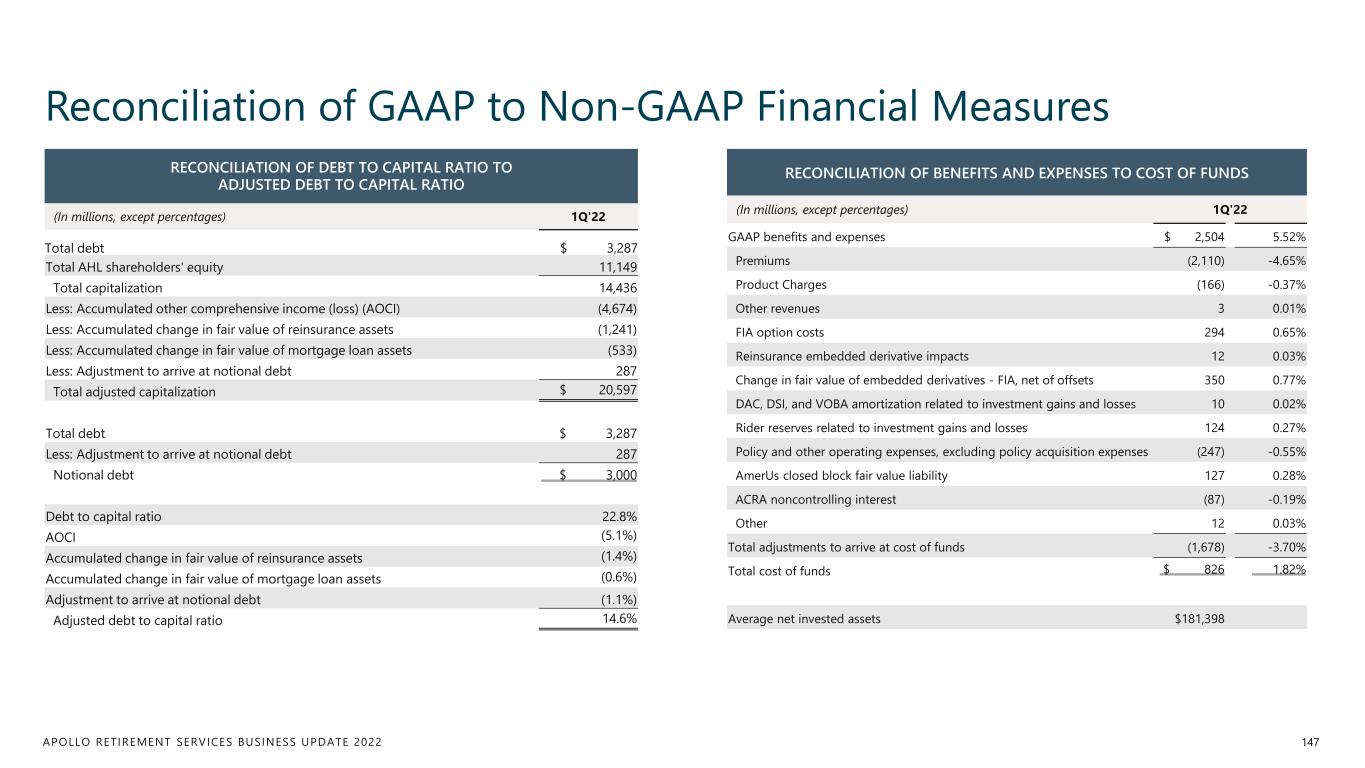
APOLLO RETIREMENT SERVICES BUSINESS UPDATE 2022 Reconciliation of GAAP to Non-GAAP Financial Measures 147 RECONCILIATION OF DEBT TO CAPITAL RATIO TO ADJUSTED DEBT TO CAPITAL RATIO (In millions, except percentages) 1Q'22 Total debt $ 3,287 Total AHL shareholders' equity 11,149 Total capitalization 14,436 Less: Accumulated other comprehensive income (loss) (AOCI) (4,674) Less: Accumulated change in fair value of reinsurance assets (1,241) Less: Accumulated change in fair value of mortgage loan assets (533) Less: Adjustment to arrive at notional debt 287 Total adjusted capitalization $ 20,597 Total debt $ 3,287 Less: Adjustment to arrive at notional debt 287 Notional debt $ 3,000 Debt to capital ratio 22.8% AOCI (5.1%) Accumulated change in fair value of reinsurance assets (1.4%) Accumulated change in fair value of mortgage loan assets (0.6%) Adjustment to arrive at notional debt (1.1%) Adjusted debt to capital ratio 14.6% RECONCILIATION OF BENEFITS AND EXPENSES TO COST OF FUNDS (In millions, except percentages) 1Q'22 GAAP benefits and expenses $ 2,504 5.52% Premiums (2,110) -4.65% Product Charges (166) -0.37% Other revenues 3 0.01% FIA option costs 294 0.65% Reinsurance embedded derivative impacts 12 0.03% Change in fair value of embedded derivatives - FIA, net of offsets 350 0.77% DAC, DSI, and VOBA amortization related to investment gains and losses 10 0.02% Rider reserves related to investment gains and losses 124 0.27% Policy and other operating expenses, excluding policy acquisition expenses (247) -0.55% AmerUs closed block fair value liability 127 0.28% ACRA noncontrolling interest (87) -0.19% Other 12 0.03% Total adjustments to arrive at cost of funds (1,678) -3.70% Total cost of funds $ 826 1.82% Average net invested assets $181,398
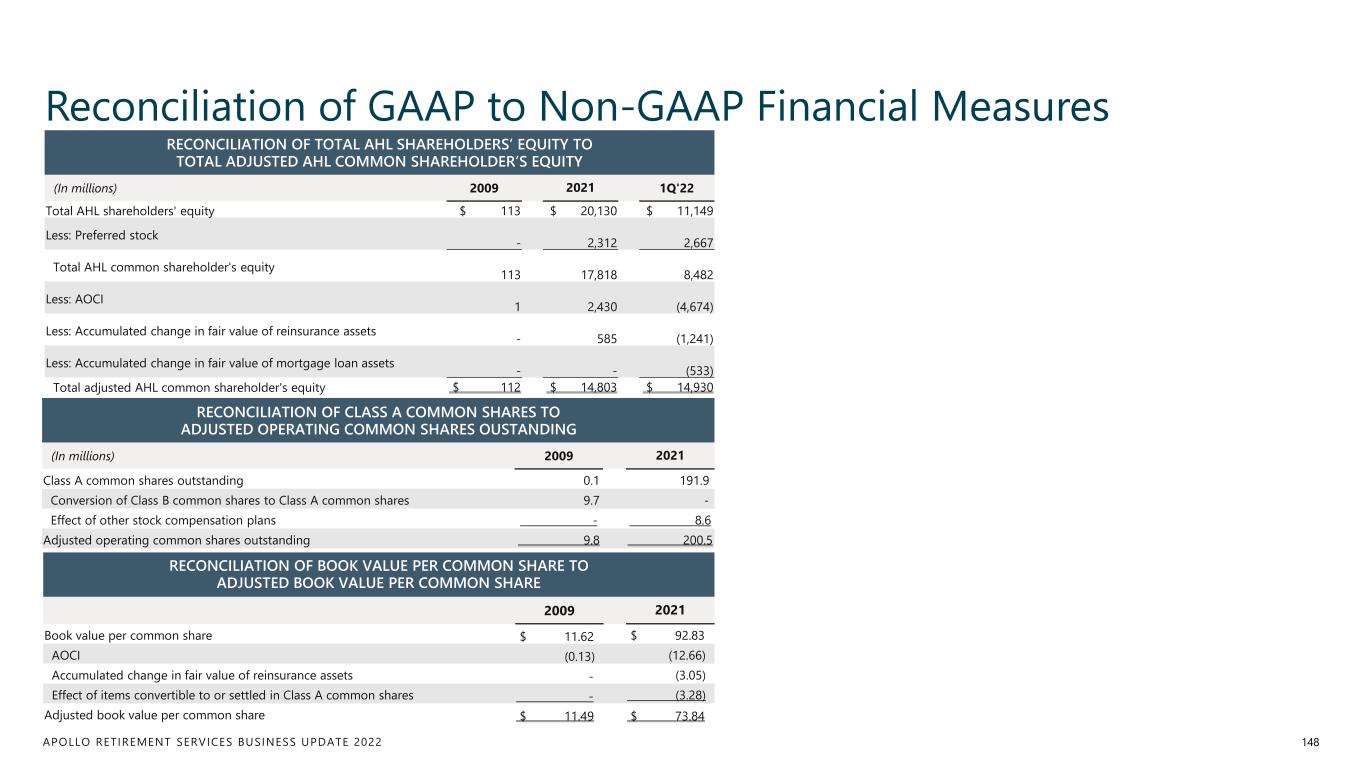
APOLLO RETIREMENT SERVICES BUSINESS UPDATE 2022 Reconciliation of GAAP to Non-GAAP Financial Measures 148 RECONCILIATION OF TOTAL AHL SHAREHOLDERS’ EQUITY TO TOTAL ADJUSTED AHL COMMON SHAREHOLDER’S EQUITY (In millions) 2009 2021 1Q'22 Total AHL shareholders' equity $ 113 $ 20,130 $ 11,149 Less: Preferred stock - 2,312 2,667 Total AHL common shareholder's equity 113 17,818 8,482 Less: AOCI 1 2,430 (4,674) Less: Accumulated change in fair value of reinsurance assets - 585 (1,241) Less: Accumulated change in fair value of mortgage loan assets - - (533) Total adjusted AHL common shareholder's equity $ 112 $ 14,803 $ 14,930 RECONCILIATION OF CLASS A COMMON SHARES TO ADJUSTED OPERATING COMMON SHARES OUSTANDING (In millions) 2009 2021 Class A common shares outstanding 0.1 191.9 Conversion of Class B common shares to Class A common shares 9.7 - Effect of other stock compensation plans - 8.6 Adjusted operating common shares outstanding 9.8 200.5 RECONCILIATION OF BOOK VALUE PER COMMON SHARE TO ADJUSTED BOOK VALUE PER COMMON SHARE 2009 2021 Book value per common share $ 11.62 $ 92.83 AOCI (0.13) (12.66) Accumulated change in fair value of reinsurance assets - (3.05) Effect of items convertible to or settled in Class A common shares - (3.28) Adjusted book value per common share $ 11.49 $ 73.84

Important Information & Definitions
APOLLO RETIREMENT SERVICES BUSINESS UPDATE 2022 Important Information 150 Estimates and Assumptions This presentation includes certain unaudited financial and business projections and goals on Apollo’s future outlook, include Athene (the “Estimates”). Apollo does not regularly provide future guidance or publicly disclose forecasts or projections as to future performance, earnings or other results due to the inherent unpredictability of projections and their underlying assumptions and estimates. The Estimates were not prepared with a view toward public disclosure and, accordingly, do not necessarily comply with published guidelines of the SEC or the guidelines established by the American Institute of Certified Public Accountants for preparation and presentation of financial forecasts or GAAP. Neither Apollo’s independent registered public accounting firm, nor any other independent accountants, have audited, reviewed, compiled or performed any procedures with respect to the Estimates or expressed any opinion or any form of assurance related thereto. Additionally, the Estimates are not intended to be pro forma financial information prepared in compliance with Article 11 of Regulation S-X. The Estimates reflect the internal financial model that Apollo uses in connection with its strategic planning. The Estimates are illustrative and are included in this presentation solely to give Apollo’s investors access to these financial projections. The Estimates were based on numerous variables and assumptions made by Apollo’s management with respect to industry performance, general business, economic, regulatory, market and financial conditions and other future events, as well as matters specific to Apollo’s businesses, all of which are difficult or impossible to predict accurately and many of which are beyond the control of Apollo’s management. Because the Estimates cover multiple years, by their nature, they also become subject to greater uncertainty and are less reliable with each successive year. The Estimates reflect subjective judgment in many respects and thus are susceptible to multiple interpretations and periodic revisions based on actual experience and business developments. As such, the Estimates constitute forward-looking information and are subject to many risks and uncertainties that could cause actual results to differ materially from the results forecasted in these projections. There can be no assurance that the Estimates will be realized or that actual results will not be significantly higher or lower than forecast. The Estimates may be affected by Apollo’s and Athene’s ability to achieve strategic goals, objectives and targets over the applicable period. Please consider carefully the section above titled “Forward-Looking Statements and Important Disclosures”. Accordingly, there can be no assurance that the Estimates will be realized, and actual results may vary materially from those shown. The Estimates cannot, therefore, be considered a guarantee of future operating results, and this information should not be relied on as such. The inclusion of the Estimates in this presentation should not be regarded as an indication that Apollo or any of its affiliates, advisors, officers, directors or representatives considered or considers the Estimates to be necessarily predictive of actual future events, and the Estimates should not be relied upon as such. The inclusion of the Estimates herein should not be deemed an admission or representation by Apollo that its management views the Estimates as material information. Neither Apollo or any of its affiliates, advisors, officers, directors or representatives has made or makes any representation to any of Apollo’s stockholders or any other person regarding the ultimate performance of Apollo compared to the information contained in the Estimates or can give any assurance that actual results will not differ materially from the Estimates, and none of them undertakes any obligation to update or otherwise revise or reconcile the Estimates to reflect circumstances existing after the date the Estimates were generated or to reflect the occurrence of future events even in the event that any or all of the assumptions underlying the Estimates are shown to be in error. Certain of the projected financial information set forth herein may be considered non-GAAP financial measures. There are limitations inherent in non-GAAP financial measures, because they exclude charges and credits that are required to be included in a GAAP presentation. Non-GAAP financial measures should not be considered in isolation from, or as a substitute for, financial information presented in compliance with GAAP, and non-GAAP financial measures as used by Apollo may not be comparable to similarly titled amounts used by other companies. No reconciliation of non-GAAP financial measures in the Estimates to GAAP measures was created or used in connection with preparing the Estimates. In light of the foregoing factors and the uncertainties inherent in the Estimates, stockholders are cautioned not to place undue reliance on the Estimates. Without limiting the statements made in the prior paragraphs, please take note of the following additional important information.
APOLLO RETIREMENT SERVICES BUSINESS UPDATE 2022 Important Information 151 Fee Related Earnings (“FRE”), Spread Related Earnings (“SRE”) and Principal Investing Income (“PII”) The estimates and expectations about Apollo’s fees, FRE, SRE and PII in the future depend on many assumptions about future events and circumstances, including but not limited to (i) the assumptions about future fundraising and AUM, (ii) the actual terms and conditions of the Apollo Funds to be raised in the future, including management fee rates paid, (iii) the investment and transaction activity of Apollo entities, (iv) the ability to generate liability growth, realize target returns and target net spreads on Athene’s investment portfolio, (v) the variability and level of our operating expenses, and (vi) the timing and amounts generated by the monetization of investments held by Apollo entities. The value of unrealized investment gains and unrealized carried interest may be volatile and subject to material change, and the actual realized value of currently unrealized investments will depend on, among other factors, the value of the investments and market conditions at the time of disposition, legal and contractual restrictions, transaction costs, and the timing and manner of sale, all of which may differ from the assumptions used for this presentation. Accordingly, the actual realized values of unrealized investments and carried interest may differ materially from the values assumed by Apollo for purposes of this presentation. The actual realized returns and net spreads on Athene’s investments can be highly dependent on future interest rates. There are many factors that could delay, impede or prohibit Apollo’s ability to generate the future fees, FRE, SRE and PII that Apollo currently expects, including but not limited to market disruption, loss of key personnel, lack of investor or third party interest, negotiations by investors or other third parties, unexpected expenses, and other events or circumstances that we may or may not be able to predict, manage or control (including but not limited to the matters discussed in the section “Forward-Looking Statements and Important Disclosures” above). Business Growth All statements relating to the potential for future business growth are inherently uncertain and are based on current market conditions, which can change at any time, and various assumptions about the ability to capitalize on growth opportunities and future business performance. No inference should be made that Apollo (including Athene) can or will grow any of its businesses materially or sufficiently to meet or approach the size of any market or sector leader disclosed in this presentation. See the section “Forward-Looking Statements and Important Disclosures” above. APOLLO DOES NOT INTEND TO UPDATE OR OTHERWISE REVISE THE ABOVE ESTIMATES TO REFLECT CIRCUMSTANCES EXISTING AFTER THE DATE WHEN MADE OR TO REFLECT THE OCCURRENCE OF FUTURE EVENTS, EVEN IN THE EVENT THAT ANY OR ALL OF THE ASSUMPTIONS UNDERLYING SUCH ESTIMATES ARE NO LONGER APPROPRIATE OR ARE SHOWN TO BE IN ERROR, EXCEPT AS MAY BE REQUIRED BY APPLICABLE LAW. Performance Information Past performance is not necessarily indicative of future results and there can be no assurance that Apollo, Athene or any Apollo Fund or strategy will achieve comparable results, or that any investments made by Apollo in the future will be profitable. Actual realized value of currently unrealized investments will depend on, among other factors, future operating results, the value of the assets and market conditions at the time of disposition, any related transaction costs and the timing and manner of sale, all of which may differ from the assumptions and circumstances on which the current unrealized valuations are based. Accordingly, the actual realized values of unrealized investments may differ materially from the values indicated herein. Information contained herein may include information with respect to prior investment performance of one or more Apollo funds or investments, including gross and/or net internal rates of return (“IRR”). Information with respect to prior performance, while a useful tool in evaluating investment activities, is not necessarily indicative of actual results that may be achieved for unrealized investments. The realization of such performance is dependent upon many factors, many of which are beyond the control of Apollo. Track Record Track record provided herein is for illustrative purposes only. None of the examples included in the track records is necessarily indicative of all of Apollo’s investment strategies or prior investment performance. While Apollo believes that the performance information herein includes applicable historical investments, there can be no assurance as to the validity, thoroughness or accuracy of Apollo’s determination methodology. Moreover, while certain members of the applicable investment committee were involved in the consummation of certain of the historical representative transactions described in the track records, the sourcing of these investments and the decisions to consummate these investments were not all necessarily made by the same group of professionals, some of which may no longer be employed by Apollo, nor were such investments approved by the same investment committee. Past performance is not indicative nor a guarantee of future results. There can be no assurance that any Apollo Fund will be able to implement its investment strategy or investment approach to achieve comparable results or that it will be successful. Moreover, there can be no assurance that any similar investment opportunities will be available or pursued by the Apollo Fund in the future. Non-GAAP Financial Measures This presentation contains information regarding Apollo’s financial results that is calculated and presented on the basis of methodologies other than in accordance with accounting principles generally accepted in the United States (“non-GAAP measures”). The non-GAAP measures presented herein include “Adjusted Net Income” or “ANI”, Fee Related Earnings, or “FRE”, Spread Related Earnings, or “SRE”, and Principal Investing Income, or “PII”, among others. Refer to the Definitions pages for the definitions of the non-GAAP measures presented herein, as well as Reconciliation of GAAP to Non-GAAP Financial Measures pages for reconciliations of the most comparable GAAP measures to the non-GAAP measures.
APOLLO RETIREMENT SERVICES BUSINESS UPDATE 2022 Important Information 152 Target Returns Target returns including Target IRR are presented solely for providing insight into an investment’s objectives and detailing anticipated risk and reward characteristics in order to facilitate comparisons with other investments and for establishing a benchmark for future evaluation of the investment’s performance. Target returns are not predictions, projections or guarantees of future performance. Target returns are based upon estimates and assumptions that a potential investment will yield a return equal to or greater than the target. There can be no assurance that Apollo will be successful in finding investment opportunities that meet these anticipated return parameters. Apollo’s target of potential returns from an investment is not a guarantee as to the quality of the investment or a representation as to the adequacy of Apollo’s methodology for estimating returns. Target returns should not be used as a primary basis for an investor’s decision to make an investment. Unless otherwise indicated, target returns are presented gross and do not reflect the effect of applicable fees, incentive compensation, certain expenses and taxes. Index Comparisons Index performance and yield data are shown for illustrative purposes only and have limitations when used for comparison or for other purposes due to, among other matters, volatility, credit or other factors (such as number of investments, recycling or reinvestment of distributions, and types of assets). It may not be possible to directly invest in one or more of these indices and the holdings of any strategy may differ markedly from the holdings of any such index in terms of levels of diversification, types of securities or assets represented and other significant factors. Indices are unmanaged, do not charge any fees or expenses, assume reinvestment of income and do not employ special investment techniques such as leveraging or short selling. No such index is indicative of the future results of any strategy or Apollo Fund. Models Models that may be contained herein (the “Models”) are being provided for illustrative and discussion purposes only and are not intended to forecast or predict future events. Information provided in the Models may not reflect the most current data and is subject to change. The Models are based on estimates and assumptions that are also subject to change and may be subject to significant business, economic and competitive uncertainties, including numerous uncontrollable market and event driven situations. There is no guarantee that the information presented in the Models is accurate. Actual results may differ materially from those reflected and contemplated in such hypothetical, forward-looking information. Undue reliance should not be placed on such information and investors should not use the Models to make investment decisions. Apollo has no duty to update the Models in the future. Products and Investments that Have Not Yet Launched/Closed Certain products, strategies, etc. referenced herein may not have launched or closed, and there can be no guarantee or assurance that they will launch or close in the future. In addition, certain transactions referenced herein, have not closed, and are subject to closing conditions. There can be no guarantee or assurance that these transactions will close. References to Certain Investments Specific references to investments have been provided on a non-performance based criteria for information purposes only. Apollo makes no guarantee that similar investments would be available in the future or, if available, would be profitable. Ratings Information Apollo, its affiliates, and third parties that provide information to Apollo, such as rating agencies, do not guarantee the accuracy, completeness, timeliness or availability of any information, including ratings, and are not responsible for any errors or omissions (negligent or otherwise), regardless of the cause, or the results obtained from the use of such content. Apollo, its affiliates and third party content providers give no express or implied warranties, including, but not limited to, any warranties of merchantability or fitness for a particular purpose or use, and they expressly disclaim any responsibility or liability for direct, indirect, incidental, exemplary, compensatory, punitive, special or consequential damages, costs expenses, legal fees or losses (including lost income or profits and opportunity costs) in connection with the use of the information herein. Credit ratings are statements of opinions and not statements of facts or recommendations to purchase, hold or sell securities. They do not address the suitability of securities for investment purposes and should not be relied on as investment advice. Neither Apollo nor any of its respective affiliates have any responsibility to update any of the information provided in this summary document. Please see the Forward-Looking Statements and Important Disclosures pages and Definitions pages for additional important disclosures and definitions. Historical definitions of certain terms used herein may differ from current definitions. In addition, information about factors affecting Apollo, including a description of risks that should be considered when making a decision to purchase or sell any securities of Apollo, can be found in its public filings with the SEC that are available at http://www.sec.gov.
APOLLO RETIREMENT SERVICES BUSINESS UPDATE 2022 Non-GAAP Financial Information & Definitions 153 Apollo discloses the following financial measures that are calculated and presented on the basis of methodologies other than in accordance with generally accepted accounting principles in the United States of America (“Non-GAAP”): • “Adjusted Segment Income”, or “ASI”, is the key performance measure used by management in evaluating the performance of the asset management, retirement services, and principal investing segments. Management uses Adjusted Segment Income to make key operating decisions such as the following: – decisions related to the allocation of resources such as staffing decisions including hiring and locations for deployment of the new hires; – decisions related to capital deployment such as providing capital to facilitate growth for the business and/or to facilitate expansion into new businesses; – decisions related to expenses, such as determining annual discretionary bonuses and equity-based compensation awards to its employees. With respect to compensation, management seeks to align the interests of certain professionals and selected other individuals with those of the investors in the funds and those of Apollo’s stockholders by providing such individuals a profit sharing interest in the performance fees earned in relation to the funds. To achieve that objective, a certain amount of compensation is based on Apollo’s performance and growth for the year; and – decisions related to the amount of earnings available for dividends to Common Stockholders and holders of RSUs that participate in dividends. Adjusted Segment Income is the sum of (i) Fee Related Earnings, (ii) Spread Related Earnings, and (iii) Principal Investing Income. Adjusted Segment Income excludes the effects of the consolidation of any of the related funds and SPACs, HoldCo interest and other financing costs not attributable to any specific segment, Taxes and Related Payables, transaction-related charges and any acquisitions. Transaction-related charges includes equity-based compensation charges, the amortization of intangible assets, contingent consideration, and certain other charges associated with acquisitions, and restructuring charges. In addition, Adjusted Segment Income excludes non-cash revenue and expense related to equity awards granted by unconsolidated related parties to employees of the Company, compensation and administrative related expense reimbursements, as well as the assets, liabilities and operating results of the funds and VIEs that are included in the consolidated financial statements. • “Adjusted Net Income” or “ANI” represents Adjusted Segment Income less HoldCo interest and other financing costs and estimated income taxes. Income taxes on FRE and PII represents the total current corporate, local, and non-U.S. taxes as well as the current payable under Apollo’s tax receivable agreement. Income taxes on FRE and PII excludes the impacts of deferred taxes and the remeasurement of the tax receivable agreement, which arise from changes in estimated future tax rates. For purposes of calculating the Adjusted Net Income tax rate, Adjusted Segment Income is reduced by HoldCo interest and financing costs. Certain assumptions and methodologies that impact the implied FRE and PII income tax provision are similar to those used under U.S. GAAP. Specifically, certain deductions considered in the income tax provision under U.S. GAAP relating to transaction related charges, equity-based compensation, and tax deductible interest expense are taken into account for the implied tax provision. Income Taxes on SRE represent the total current and deferred tax expense or benefit on income before taxes adjusted to eliminate the impact of the tax expense or benefit associated with the non-operating adjustments. Management believes the methodologies used to compute income taxes on FRE, SRE, and PII are meaningful to each segment and increases comparability of income taxes between periods. • “Fee Related Earnings”, or “FRE”, is a component of Adjusted Segment Income that is used to assess the performance of the Asset Management segment. FRE is the sum of (i) management fees, (ii) advisory and transaction fees, (iii) fee-related performance fees from indefinite term vehicles, that are measured and received on a recurring basis and not dependent on realization events of the underlying investments and (iv) other income, net, less (a) fee-related compensation, excluding equity- based compensation, (b) non-compensation expenses incurred in the normal course of business, (c) placement fees and (d) non-controlling interests in the management companies of certain funds the Company manages. • “Spread Related Earnings”, or “SRE” is a component of Adjusted Segment Income that is used to assess the performance of the Retirement Services segment, excluding certain market volatility and certain expenses related to integration, restructuring, equity-based compensation, and other expenses. For the Retirement Services segment, SRE equals the sum of (i) the net investment earnings on Athene’s net invested assets and (ii) management fees earned on the ADIP share of ACRA assets, less (x) cost of funds, (y) operating expenses excluding equity-based compensation and (z) financing costs including interest expense and preferred dividends, if any, paid to Athene preferred stockholders. • “Principal Investing Income”, or “PII” is a component of Adjusted Segment Income that is used to assess the performance of the Principal Investing segment. For the Principal Investing segment, PII is the sum of (i) realized performance fees, excluding realizations received in the form of shares, (ii) realized investment income, less (x) realized principal investing compensation expense, excluding expense related to equity-based compensation, and (y) certain corporate compensation and non- compensation expenses.
APOLLO RETIREMENT SERVICES BUSINESS UPDATE 2022 Non-GAAP Financial Information & Definitions 154 • “ACRA” refers to Athene Co-Invest Reinsurance Affiliate Holding Ltd. • “ADIP” refers to Apollo/Athene Dedicated Investment Program, a fund managed by Apollo including third-party capital that invests alongside Athene in certain investments. • “Assets Under Management”, or “AUM”, refers to the assets of the funds, partnerships and accounts to which Apollo provides investment management, advisory, or certain other investment-related services, including, without limitation, capital that such funds, partnerships and accounts have the right to call from investors pursuant to capital commitments. AUM equals the sum of: 1. the net asset value (“NAV”), plus used or available leverage and/or capital commitments, or gross assets plus capital commitments, of the yield and certain hybrid funds, partnerships and accounts for which we provide investment management or advisory services, other than certain collateralized loan obligations (“CLOs”), collateralized debt obligations (“CDOs”), and certain perpetual capital vehicles, which have a fee-generating basis other than the mark-to-market value of the underlying assets; for certain perpetual capital vehicles in yield, gross asset value plus available financing capacity; 2. the fair value of the investments of equity and certain hybrid funds, partnerships and accounts Apollo manages or advise, plus the capital that such funds, partnerships and accounts are entitled to call from investors pursuant to capital commitments, plus portfolio level financings; 3. the gross asset value associated with the reinsurance investments of the portfolio company assets Apollo manages or advises; and 4. the fair value of any other assets that Apollo manages or advises for the funds, partnerships and accounts to which Apollo provides investment management, advisory, or certain other investment-related services, plus unused credit facilities, including capital commitments to such funds, partnerships and accounts for investments that may require pre-qualification or other conditions before investment plus any other capital commitments to such funds, partnerships and accounts available for investment that are not otherwise included in the clauses above. Apollo’s AUM measure includes Assets Under Management for which Apollo charges either nominal or zero fees. Apollo’s AUM measure also includes assets for which Apollo does not have investment discretion, including certain assets for which Apollo earns only investment-related service fees, rather than management or advisory fees. Apollo’s definition of AUM is not based on any definition of Assets Under Management contained in its governing documents or in any of Apollo Fund management agreements. Apollo considers multiple factors for determining what should be included in its definition of AUM. Such factors include but are not limited to (1) Apollo’s ability to influence the investment decisions for existing and available assets; (2) Apollo’s ability to generate income from the underlying assets in its funds; and (3) the AUM measures that Apollo uses internally or believe are used by other investment managers. Given the differences in the investment strategies and structures among other alternative investment managers, Apollo’s calculation of AUM may differ from the calculations employed by other investment managers and, as a result, this measure may not be directly comparable to similar measures presented by other investment managers. Apollo’s calculation also differs from the manner in which its affiliates registered with the SEC report “Regulatory Assets Under Management” on Form ADV and Form PF in various ways. Apollo uses AUM, Gross capital deployed and Dry powder as performance measurements of its investment activities, as well as to monitor fund size in relation to professional resource and infrastructure needs. • “Athene” refers to Athene Holding Ltd. (together with its subsidiaries, “Athene”), a subsidiary of the Company and a leading retirement services company that issues, reinsures and acquires retirement savings products designed for the increasing number of individuals and institutions seeking to fund retirement needs, and to which Apollo, through its consolidated subsidiary Apollo Insurance Solutions Group LP (formerly known as Athene Asset Management LLC) (“ISG”), provides asset management and advisory services. • “Athora” refers to a strategic platform that acquires or reinsures blocks of insurance business in the German and broader European life insurance market (collectively, the “Athora Accounts”). • “NRSRO” Means nationally recognized statistical rating organization
APOLLO RETIREMENT SERVICES BUSINESS UPDATE 2022 Non-GAAP Financial Information & Definitions (Athene) 155 In addition to our results presented in accordance with GAAP, we present certain financial information that includes non-GAAP measures. Management believes the use of these non-GAAP measures, together with the relevant GAAP measures, provides information that may enhance an investor’s understanding of our results of operations and the underlying profitability drivers of our business. The majority of these non-GAAP measures are intended to remove from the results of operations the impact of market volatility (other than with respect to alternative investments) as well as integration, restructuring and certain other expenses which are not part of our underlying profitability drivers, as such items fluctuate from period to period in a manner inconsistent with these drivers. These measures should be considered supplementary to our results in accordance with GAAP and should not be viewed as a substitute for the corresponding GAAP measures. Spread Related Earnings (SRE) Spread related earnings is a pre-tax non-GAAP measure used to evaluate our financial performance excluding market volatility and expenses related to integration, restructuring, stock compensation and other expenses. Our spread related earnings equals net income (loss) available to AHL common shareholder adjusted to eliminate the impact of the following: • Investment Gains (Losses), Net of Offsets—Consists of the realized gains and losses on the sale of AFS securities, the change in fair value of reinsurance assets, unrealized gains and losses, changes in the credit loss allowance, and other investment gains and losses. Unrealized, allowances and other investment gains and losses are comprised of the fair value adjustments of trading securities (other than CLOs) and mortgage loans, investments held under the fair value option and our investment in Apollo, derivative gains and losses not hedging FIA index credits, and the change in credit loss allowances recognized in operations net of the change in AmerUs Closed Block fair value reserve related to the corresponding change in fair value of investments. Investment gains and losses are net of offsets related to DAC and DSI amortization and changes to guaranteed lifetime withdrawal benefit (GLWB) and guaranteed minimum death benefit (GMDB) reserves (together, GLWB and GMDB reserves represent rider reserves) as well as the market value adjustments (MVA) associated with surrenders or terminations of contracts. • Change in Fair Values of Derivatives and Embedded Derivatives – FIAs, Net of Offsets—Consists of impacts related to the fair value accounting for derivatives hedging the FIA index credits and the related embedded derivative liability fluctuations from period to period. The index reserve is measured at fair value for the current period and all periods beyond the current policyholder index term. However, the FIA hedging derivatives are purchased to hedge only the current index period. Upon policyholder renewal at the end of the period, new FIA hedging derivatives are purchased to align with the new term. The difference in duration between the FIA hedging derivatives and the index credit reserves creates a timing difference in earnings. This timing difference of the FIA hedging derivatives and index credit reserves is included as a non-operating adjustment, net of offsets related to DAC and DSI amortization and changes to rider reserves. We primarily hedge with options that align with the index terms of our FIA products (typically 1–2 years). On an economic basis, we believe this is suitable because policyholder accounts are credited with index performance at the end of each index term. However, because the term of an embedded derivative in an FIA contract is longer-dated, there is a duration mismatch which may lead to mismatches for accounting purposes. • Integration, Restructuring, and Other Non-operating Expenses—Consists of restructuring and integration expenses related to acquisitions and block reinsurance costs as well as certain other expenses, which are not predictable or related to our underlying profitability drivers. • Stock Compensation Expense—Consists of stock compensation expenses associated with our share incentive plans, including long-term incentive expenses, which are not related to our underlying profitability drivers and fluctuate from time to time due to the structure of our plans. • Income Tax (Expense) Benefit —Consists of the income tax effect of all income statement adjustments, including our Apollo investment, and is computed by applying the appropriate jurisdiction’s tax rate to all adjustments subject to income tax. We consider these adjustments to be meaningful adjustments to net income (loss) available to AHL common shareholder for the reasons discussed in greater detail above. Accordingly, we believe using a measure which excludes the impact of these items is useful in analyzing our business performance and the trends in our results of operations. Together with net income (loss) available to AHL common shareholder, we believe spread related earnings provides a meaningful financial metric that helps investors understand our underlying results and profitability. Spread related earnings should not be used as a substitute for net income (loss) available to AHL common shareholder. Net Spread Net spread is a non-GAAP measure used to evaluate our financial performance and profitability. Net spread is computed using our spread related earnings divided by average net invested assets for the relevant period. To enhance the ability to analyze this measure across periods, interim periods are annualized. While we believe this metric is a meaningful financial metric and enhances our understanding of the underlying profitability drivers of our business, it should not be used as a substitute for ROA presented under GAAP.
APOLLO RETIREMENT SERVICES BUSINESS UPDATE 2022 Non-GAAP Financial Information & Definitions (Athene) 156 Adjusted Debt to Capital Ratio Adjusted debt to capital ratio is a non-GAAP measure used to evaluate our capital structure excluding the impacts of AOCI and the cumulative changes in fair value of funds withheld and modco reinsurance assets as well as mortgage loan assets, net of DAC, DSI, rider reserve and tax offsets. Adjusted debt to capital ratio is calculated as total long-term and short-term debt at notional value divided by adjusted capitalization. Adjusted capitalization includes our adjusted AHL common shareholder’s equity, preferred stock and the notional value of our debt. Adjusted AHL common shareholder’s equity is calculated as the ending AHL shareholders’ equity excluding AOCI, the cumulative changes in fair value of funds withheld and modco reinsurance assets and mortgage loan assets as well as preferred stock. These adjustments fluctuate period to period in a manner inconsistent with our underlying profitability drivers as the majority of such fluctuation is related to the market volatility of the unrealized gains and losses associated with our AFS securities. Except with respect to reinvestment activity relating to acquired blocks of businesses, we typically buy and hold AFS investments to maturity throughout the duration of market fluctuations, therefore, the period-over-period impacts in unrealized gains and losses are not necessarily indicative of current operating fundamentals or future performance. Accordingly, we believe using measures which exclude AOCI and the cumulative changes in fair value of funds withheld and modco reinsurance assets as well as mortgage loan assets are useful in analyzing trends in our operating results. Adjusted debt to capital ratio should not be used as a substitute for the debt to capital ratio. However, we believe the adjustments to shareholders’ equity are significant to gaining an understanding of our capitalization, debt utilization and debt capacity. Net Investment Spread and Other Operating Expenses Net investment spread is a key measure of profitability. Net investment spread measures our investment performance plus our strategic capital management fees from ACRA, less our total cost of funds. Net investment earned rate is a key measure of our investment performance while cost of funds is a key measure of the cost of our policyholder benefits and liabilities. Net investment earned rate is a non-GAAP measure we use to evaluate the performance of our net invested assets that does not correspond to GAAP net investment income. Net investment earned rate is computed as the income from our net invested assets divided by the average net invested assets, for the relevant period. To enhance the ability to analyze these measures across periods, interim periods are annualized. The adjustments to net investment income to arrive at our net investment earned rate add (a) alternative investment gains and losses, (b) gains and losses related to trading securities for CLOs, (c) net VIE impacts (revenues, expenses and noncontrolling interest), (d) forward points gains and losses on foreign exchange derivative hedges and (e) the change in fair value of reinsurance assets, and removes the proportionate share of the ACRA net investment income associated with the ACRA noncontrolling interest. We include the income and assets supporting our change in fair value of reinsurance assets by evaluating the underlying investments of the funds withheld at interest receivables and we include the net investment income from those underlying investments which does not correspond to the GAAP presentation of change in fair value of reinsurance assets. We exclude the income and assets supporting business that we have exited through ceded reinsurance including funds withheld agreements. We believe the adjustments for reinsurance provide a net investment earned rate on the assets for which we have economic exposure. Cost of funds includes liability costs related to cost of crediting on both deferred annuities and institutional products as well as other liability costs, but does not include the proportionate share of the ACRA cost of funds associated with the noncontrolling interest. Cost of crediting on deferred annuities is the interest credited to the policyholders on our fixed strategies as well as the option costs on the indexed annuity strategies. With respect to FIAs, the cost of providing index credits includes the expenses incurred to fund the annual index credits, and where applicable, minimum guaranteed interest credited. Cost of crediting on institutional products is comprised of (i) pension group annuity costs, including interest credited, benefit payments and other reserve changes, net of premiums received when issued, and (ii) funding agreement costs, including the interest payments and other reserve changes. Other liability costs include DAC, DSI and VOBA amortization, change in rider reserves, the cost of liabilities on products other than deferred annuities and institutional products, premiums, product charges and other revenues. Cost of funds is computed as the total liability costs divided by the average net invested assets, for the relevant period. To enhance the ability to analyze these measures across periods, interim periods are annualized. We believe a measure like cost of funds is useful in analyzing the trends of our core business operations and profitability. While we believe cost of funds is a meaningful financial metric and enhances our understanding of the underlying profitability drivers of our business, it should not be used as a substitute for total benefits and expenses presented under GAAP. Net investment earned rate, cost of funds, and net investment spread are non-GAAP measures we use to evaluate the profitability of our business. We believe these metrics are useful in analyzing the trends of our business operations, profitability and pricing discipline. While we believe each of these metrics are meaningful financial metrics and enhance our understanding of the underlying profitability drivers of our business, they should not be used as a substitute for net investment income, interest sensitive contract benefits or total benefits and expenses presented under GAAP. Other operating expenses excludes integration, restructuring and other non-operating expenses, stock compensation and long-term incentive plan expenses, interest expense and policy acquisition expenses. We believe a measure like other operating expenses is useful in analyzing the trends of our core business operations and profitability. While we believe other operating expenses is a meaningful financial metric and enhances our understanding of the underlying profitability drivers of our business, it should not be used as a substitute for policy and other operating expenses presented under GAAP.
APOLLO RETIREMENT SERVICES BUSINESS UPDATE 2022 Non-GAAP Financial Information & Definitions (Athene) 157 Invested Assets In managing our business, we analyze net invested assets, which does not correspond to total investments, including investments in related parties, as disclosed in our consolidated financial statements and notes thereto. Net invested assets represents the investments that directly back our net reserve liabilities as well as surplus assets. Net invested assets is used in the computation of net investment earned rate, which allows us to analyze the profitability of our investment portfolio. Net invested assets includes (a) total investments on the consolidated balance sheets with AFS securities at cost or amortized cost, excluding derivatives, (b) cash and cash equivalents and restricted cash, (c) investments in related parties, (d) accrued investment income, (e) VIE assets, liabilities and noncontrolling interest adjustments, (f) net investment payables and receivables, (g) policy loans ceded (which offset the direct policy loans in total investments) and (h) an allowance for credit losses. Net invested assets also excludes assets associated with funds withheld liabilities related to business exited through reinsurance agreements and derivative collateral (offsetting the related cash positions). We include the underlying investments supporting our assumed funds withheld and modco agreements in our net invested assets calculation in order to match the assets with the income received. We believe the adjustments for reinsurance provide a view of the assets for which we have economic exposure. Net invested assets includes our proportionate share of ACRA investments, based on our economic ownership, but does not include the proportionate share of investments associated with the noncontrolling interest. Net invested assets also includes our investment in Apollo for prior periods. Our net invested assets are averaged over the number of quarters in the relevant period to compute our net investment earned rate for such period. While we believe net invested assets is a meaningful financial metric and enhances our understanding of the underlying drivers of our investment portfolio, it should not be used as a substitute for total investments, including related parties, presented under GAAP. Reserve Liabilities In managing our business, we also analyze net reserve liabilities, which does not correspond to total liabilities as disclosed in our consolidated financial statements and notes thereto. Net reserve liabilities represent our policyholder liability obligations net of reinsurance and is used to analyze the costs of our liabilities. Net reserve liabilities include (a) interest sensitive contract liabilities, (b) future policy benefits, (c) dividends payable to policyholders, and (d) other policy claims and benefits, offset by reinsurance recoverable, excluding policy loans ceded. Net reserve liabilities include our proportionate share of ACRA reserve liabilities, based on our economic ownership, but does not include the proportionate share of reserve liabilities associated with the noncontrolling interest. Net reserve liabilities is net of the ceded liabilities to third-party reinsurers as the costs of the liabilities are passed to such reinsurers and, therefore, we have no net economic exposure to such liabilities, assuming our reinsurance counterparties perform under our agreements. The majority of our ceded reinsurance is a result of reinsuring large blocks of life business following acquisitions. For such transactions, GAAP requires the ceded liabilities and related reinsurance recoverables to continue to be recorded in our consolidated financial statements despite the transfer of economic risk to the counterparty in connection with the reinsurance transaction. While we believe net reserve liabilities is a meaningful financial metric and enhances our understanding of the underlying profitability drivers of our business, it should not be used as a substitute for total liabilities presented under GAAP. Sales Sales statistics do not correspond to revenues under GAAP but are used as relevant measures to understand our business performance as it relates to inflows generated during a specific period of time. Our sales statistics include inflows for fixed rate annuities and FIAs and align with the LIMRA definition of all money paid into an individual annuity, including money paid into new contracts with initial purchase occurring in the specified period and existing contracts with initial purchase occurring prior to the specified period (excluding internal transfers). While we believe sales is a meaningful metric and enhances our understanding of our business performance, it should not be used as a substitute for premiums presented under GAAP. Organic Growth Rate Organic growth rate is calculated as the net organic flows divided by average gross invested assets. Net organic flows are comprised of gross organic inflows less gross outflows. Gross organic inflows are the deposits generated from our organic channels, which include retail, flow reinsurance and institutional. Gross outflows are total liability outflows, including full and partial withdrawals on our deferred annuities, death benefits, pension group annuity benefit payments, payments on payout annuities and maturities of our funding agreements. To enhance the ability to analyze these measures across periods, interim periods are annualized. We believe organic growth rate provides a meaningful financial metric that enables investors to assess our growth from the channels that provide recurring inflows. Management uses the organic growth rate to monitor our business performance and the underlying profitability drivers of our business.