EX-99.1
Published on October 19, 2021

Exhibit 99.1 Athene Balance Sheet Tutorial: Asset Portfolio Risk & Stress Considerations October 2021Exhibit 99.1 Athene Balance Sheet Tutorial: Asset Portfolio Risk & Stress Considerations October 2021
Disclaimer This presentation does not constitute an offer to sell, or the solicitation of an offer to buy, any security of Athene Holding Ltd. (“Athene”). Certain information contained herein and certain oral statements made in reference thereto may be “forward-looking” in nature. These statements include, but are not limited to, discussions related to the benefits to be derived from the Athene Co-Invest Reinsurance Affiliate ( ACRA ) capital raise; benefits to be derived from Athene's capital allocation decisions, including the repurchase of its common shares; the benefits to be derived from the redeployment of excess cash holdings and the assets backing the obligations reinsured from Jackson National Life Insurance Company ( Jackson ); the magnitude of potential future growth in invested assets; expected future operating results; Athene's liquidity and capital resources and the other non-historical statements. These forward-looking statements are based on management's beliefs, as well as assumptions made by, and information currently available to, management. When used in this presentation, the words “believe,” “anticipate,” “estimate,” “expect,” “intend,” will, should, and similar expressions are intended to identify forward-looking statements. Although management believes that the expectations reflected in these forward-looking statements are reasonable, it can give no assurance that these expectations will prove to be correct. These statements are subject to certain risks, uncertainties and assumptions, including Athene's failure to recognize the benefits expected to be derived from the transactions with Jackson and the delay or failure to complete or realize the expected benefits from the proposed merger with Apollo Global Management, Inc., the closing of which is subject to, among other things, the expiration or termination of the applicable antitrust waiting periods, other antitrust and regulatory approvals, stockholder approvals, and other customary closing conditions. For a discussion of the other risks and uncertainties related to Athene's forward-looking statements, see its annual report on Form 10-K for the year ended December 31, 2020, quarterly report on Form 10-Q for the period ended June 30, 2021, and its other SEC filings, which can be found at the SEC’s website www.sec.gov. Due to these various risks, uncertainties and assumptions, actual events or results or Athene's actual performance may differ materially from that reflected or contemplated in such forward-looking statements. Athene undertakes no obligation to publicly update or review any forward-looking statements, whether as a result of new information, future developments or otherwise. Information contained herein may include information respecting prior performance of Athene. Information respecting prior performance, while a useful tool, is not necessarily indicative of actual results to be achieved in the future, which is dependent upon many factors, many of which are beyond Athene's control. The information contained herein is not a guarantee of future performance by Athene, and actual outcomes and results may differ materially from any historic, pro forma or projected financial results indicated herein. Certain of the financial information contained herein is unaudited or based on the application of non-GAAP financial measures. These non-GAAP financial measures should be considered in addition to and not as a substitute for, or superior to, financial measures presented in accordance with GAAP. Furthermore, certain financial information is based on estimates of management. These estimates, which are based on the reasonable expectations of management, are subject to change and there can be no assurance that they will prove to be correct. The information contained herein does not purport to be all-inclusive or contain all information that an evaluator may require in order to properly evaluate the business, prospects or value of Athene. Athene does not have any obligation to update this presentation and the information may change at any time without notice. Models that may be contained herein (the “Models”) are being provided for illustrative and discussion purposes only and are not intended to forecast or predict future events. Information provided in the Models may not reflect the most current data and is subject to change. The Models are based on estimates and assumptions that are also subject to change and may be subject to significant business, economic and competitive uncertainties, including numerous uncontrollable market and event driven situations. There is no guarantee that the information presented in the Models is accurate. Actual results may differ materially from those reflected and contemplated in such hypothetical, forward-looking information. Undue reliance should not be placed on such information and investors should not use the Models to make investment decisions. Athene has no duty to update the Models in the future. Certain of the information used in preparing this presentation was obtained from third parties or public sources. No representation or warranty, express or implied, is made or given by or on behalf of Athene or any other person as to the accuracy, completeness or fairness of such information, and no responsibility or liability is accepted for any such information. This document is not intended to be, nor should it be construed or used as, financial, legal, tax, insurance or investment advice. There can be no assurance that Athene will achieve its objectives. Past performance is not indicative of future success. All information is as of the dates indicated herein. 2Disclaimer This presentation does not constitute an offer to sell, or the solicitation of an offer to buy, any security of Athene Holding Ltd. (“Athene”). Certain information contained herein and certain oral statements made in reference thereto may be “forward-looking” in nature. These statements include, but are not limited to, discussions related to the benefits to be derived from the Athene Co-Invest Reinsurance Affiliate ( ACRA ) capital raise; benefits to be derived from Athene's capital allocation decisions, including the repurchase of its common shares; the benefits to be derived from the redeployment of excess cash holdings and the assets backing the obligations reinsured from Jackson National Life Insurance Company ( Jackson ); the magnitude of potential future growth in invested assets; expected future operating results; Athene's liquidity and capital resources and the other non-historical statements. These forward-looking statements are based on management's beliefs, as well as assumptions made by, and information currently available to, management. When used in this presentation, the words “believe,” “anticipate,” “estimate,” “expect,” “intend,” will, should, and similar expressions are intended to identify forward-looking statements. Although management believes that the expectations reflected in these forward-looking statements are reasonable, it can give no assurance that these expectations will prove to be correct. These statements are subject to certain risks, uncertainties and assumptions, including Athene's failure to recognize the benefits expected to be derived from the transactions with Jackson and the delay or failure to complete or realize the expected benefits from the proposed merger with Apollo Global Management, Inc., the closing of which is subject to, among other things, the expiration or termination of the applicable antitrust waiting periods, other antitrust and regulatory approvals, stockholder approvals, and other customary closing conditions. For a discussion of the other risks and uncertainties related to Athene's forward-looking statements, see its annual report on Form 10-K for the year ended December 31, 2020, quarterly report on Form 10-Q for the period ended June 30, 2021, and its other SEC filings, which can be found at the SEC’s website www.sec.gov. Due to these various risks, uncertainties and assumptions, actual events or results or Athene's actual performance may differ materially from that reflected or contemplated in such forward-looking statements. Athene undertakes no obligation to publicly update or review any forward-looking statements, whether as a result of new information, future developments or otherwise. Information contained herein may include information respecting prior performance of Athene. Information respecting prior performance, while a useful tool, is not necessarily indicative of actual results to be achieved in the future, which is dependent upon many factors, many of which are beyond Athene's control. The information contained herein is not a guarantee of future performance by Athene, and actual outcomes and results may differ materially from any historic, pro forma or projected financial results indicated herein. Certain of the financial information contained herein is unaudited or based on the application of non-GAAP financial measures. These non-GAAP financial measures should be considered in addition to and not as a substitute for, or superior to, financial measures presented in accordance with GAAP. Furthermore, certain financial information is based on estimates of management. These estimates, which are based on the reasonable expectations of management, are subject to change and there can be no assurance that they will prove to be correct. The information contained herein does not purport to be all-inclusive or contain all information that an evaluator may require in order to properly evaluate the business, prospects or value of Athene. Athene does not have any obligation to update this presentation and the information may change at any time without notice. Models that may be contained herein (the “Models”) are being provided for illustrative and discussion purposes only and are not intended to forecast or predict future events. Information provided in the Models may not reflect the most current data and is subject to change. The Models are based on estimates and assumptions that are also subject to change and may be subject to significant business, economic and competitive uncertainties, including numerous uncontrollable market and event driven situations. There is no guarantee that the information presented in the Models is accurate. Actual results may differ materially from those reflected and contemplated in such hypothetical, forward-looking information. Undue reliance should not be placed on such information and investors should not use the Models to make investment decisions. Athene has no duty to update the Models in the future. Certain of the information used in preparing this presentation was obtained from third parties or public sources. No representation or warranty, express or implied, is made or given by or on behalf of Athene or any other person as to the accuracy, completeness or fairness of such information, and no responsibility or liability is accepted for any such information. This document is not intended to be, nor should it be construed or used as, financial, legal, tax, insurance or investment advice. There can be no assurance that Athene will achieve its objectives. Past performance is not indicative of future success. All information is as of the dates indicated herein. 2
What Happened Since Our Last Asset Risk Update 3What Happened Since Our Last Asset Risk Update 3
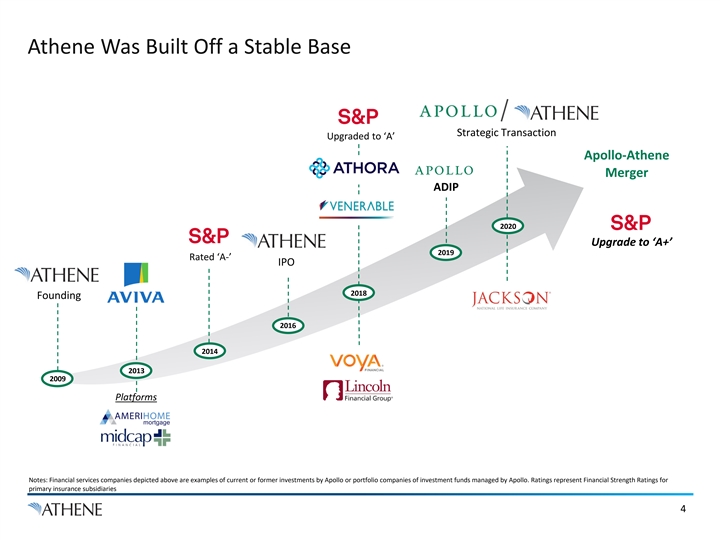
Athene Was Built Off a Stable Base Strategic Transaction Upgraded to ‘A’ Apollo-Athene Merger ADIP 2020 Upgrade to ‘A+’ 2019 Rated ‘A-’ IPO 2018 Founding 2016 2014 2013 2009 Platforms Notes: Financial services companies depicted above are examples of current or former investments by Apollo or portfolio companies of investment funds managed by Apollo. Ratings represent Financial Strength Ratings for primary insurance subsidiaries 4Athene Was Built Off a Stable Base Strategic Transaction Upgraded to ‘A’ Apollo-Athene Merger ADIP 2020 Upgrade to ‘A+’ 2019 Rated ‘A-’ IPO 2018 Founding 2016 2014 2013 2009 Platforms Notes: Financial services companies depicted above are examples of current or former investments by Apollo or portfolio companies of investment funds managed by Apollo. Ratings represent Financial Strength Ratings for primary insurance subsidiaries 4
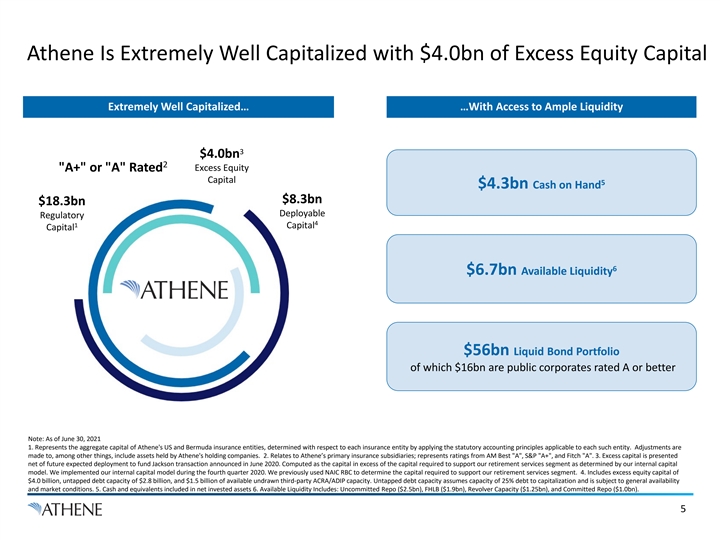
Athene Is Extremely Well Capitalized with $4.0bn of Excess Equity Capital Extremely Well Capitalized… …With Access to Ample Liquidity 3 $4.0bn 2 Excess Equity A+ or A Rated Capital 5 $4.3bn Cash on Hand $8.3bn $18.3bn Deployable Regulatory 4 1 Capital Capital 6 $6.7bn Available Liquidity $56bn Liquid Bond Portfolio of which $16bn are public corporates rated A or better Note: As of June 30, 2021 1. Represents the aggregate capital of Athene's US and Bermuda insurance entities, determined with respect to each insurance entity by applying the statutory accounting principles applicable to each such entity. Adjustments are made to, among other things, include assets held by Athene's holding companies. 2. Relates to Athene’s primary insurance subsidiaries; represents ratings from AM Best A , S&P A+ , and Fitch A . 3. Excess capital is presented net of future expected deployment to fund Jackson transaction announced in June 2020. Computed as the capital in excess of the capital required to support our retirement services segment as determined by our internal capital model. We implemented our internal capital model during the fourth quarter 2020. We previously used NAIC RBC to determine the capital required to support our retirement services segment. 4. Includes excess equity capital of $4.0 billion, untapped debt capacity of $2.8 billion, and $1.5 billion of available undrawn third-party ACRA/ADIP capacity. Untapped debt capacity assumes capacity of 25% debt to capitalization and is subject to general availability and market conditions. 5. Cash and equivalents included in net invested assets 6. Available Liquidity Includes: Uncommitted Repo ($2.5bn), FHLB ($1.9bn), Revolver Capacity ($1.25bn), and Committed Repo ($1.0bn). 5Athene Is Extremely Well Capitalized with $4.0bn of Excess Equity Capital Extremely Well Capitalized… …With Access to Ample Liquidity 3 $4.0bn 2 Excess Equity A+ or A Rated Capital 5 $4.3bn Cash on Hand $8.3bn $18.3bn Deployable Regulatory 4 1 Capital Capital 6 $6.7bn Available Liquidity $56bn Liquid Bond Portfolio of which $16bn are public corporates rated A or better Note: As of June 30, 2021 1. Represents the aggregate capital of Athene's US and Bermuda insurance entities, determined with respect to each insurance entity by applying the statutory accounting principles applicable to each such entity. Adjustments are made to, among other things, include assets held by Athene's holding companies. 2. Relates to Athene’s primary insurance subsidiaries; represents ratings from AM Best A , S&P A+ , and Fitch A . 3. Excess capital is presented net of future expected deployment to fund Jackson transaction announced in June 2020. Computed as the capital in excess of the capital required to support our retirement services segment as determined by our internal capital model. We implemented our internal capital model during the fourth quarter 2020. We previously used NAIC RBC to determine the capital required to support our retirement services segment. 4. Includes excess equity capital of $4.0 billion, untapped debt capacity of $2.8 billion, and $1.5 billion of available undrawn third-party ACRA/ADIP capacity. Untapped debt capacity assumes capacity of 25% debt to capitalization and is subject to general availability and market conditions. 5. Cash and equivalents included in net invested assets 6. Available Liquidity Includes: Uncommitted Repo ($2.5bn), FHLB ($1.9bn), Revolver Capacity ($1.25bn), and Committed Repo ($1.0bn). 5
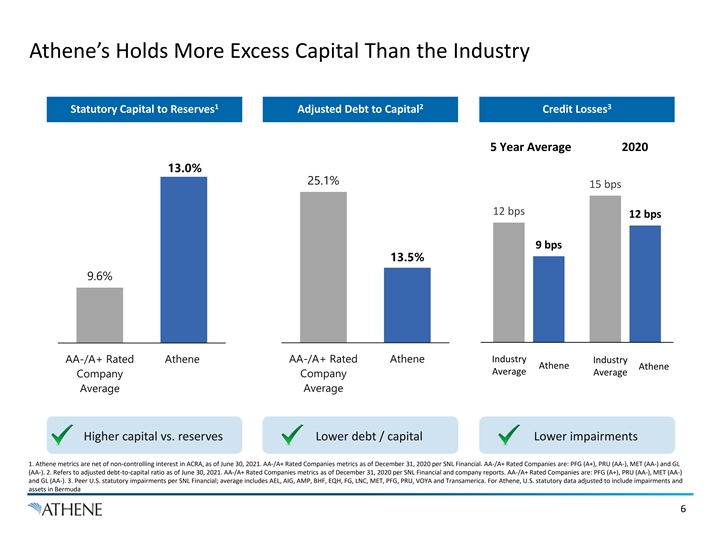
Athene’s Holds More Excess Capital Than the Industry 1 2 3 Statutory Capital to Reserves Adjusted Debt to Capital Credit Losses 5 Year Average 2020 13.0% 25.1% 15 bps 12 bps 12 bps 9 bps 13.5% 9.6% 5 Year Average 2020 Industry AA-/A+ Rated Athene AA-/A+ Rated Athene Industry Athene Athene Average Average Company Company Average Average Higher capital vs. reserves Lower debt / capital Lower impairments 1. Athene metrics are net of non-controlling interest in ACRA, as of June 30, 2021. AA-/A+ Rated Companies metrics as of December 31, 2020 per SNL Financial. AA-/A+ Rated Companies are: PFG (A+), PRU (AA-), MET (AA-) and GL (AA-). 2. Refers to adjusted debt-to-capital ratio as of June 30, 2021. AA-/A+ Rated Companies metrics as of December 31, 2020 per SNL Financial and company reports. AA-/A+ Rated Companies are: PFG (A+), PRU (AA-), MET (AA-) and GL (AA-). 3. Peer U.S. statutory impairments per SNL Financial; average includes AEL, AIG, AMP, BHF, EQH, FG, LNC, MET, PFG, PRU, VOYA and Transamerica. For Athene, U.S. statutory data adjusted to include impairments and assets in Bermuda 6Athene’s Holds More Excess Capital Than the Industry 1 2 3 Statutory Capital to Reserves Adjusted Debt to Capital Credit Losses 5 Year Average 2020 13.0% 25.1% 15 bps 12 bps 12 bps 9 bps 13.5% 9.6% 5 Year Average 2020 Industry AA-/A+ Rated Athene AA-/A+ Rated Athene Industry Athene Athene Average Average Company Company Average Average Higher capital vs. reserves Lower debt / capital Lower impairments 1. Athene metrics are net of non-controlling interest in ACRA, as of June 30, 2021. AA-/A+ Rated Companies metrics as of December 31, 2020 per SNL Financial. AA-/A+ Rated Companies are: PFG (A+), PRU (AA-), MET (AA-) and GL (AA-). 2. Refers to adjusted debt-to-capital ratio as of June 30, 2021. AA-/A+ Rated Companies metrics as of December 31, 2020 per SNL Financial and company reports. AA-/A+ Rated Companies are: PFG (A+), PRU (AA-), MET (AA-) and GL (AA-). 3. Peer U.S. statutory impairments per SNL Financial; average includes AEL, AIG, AMP, BHF, EQH, FG, LNC, MET, PFG, PRU, VOYA and Transamerica. For Athene, U.S. statutory data adjusted to include impairments and assets in Bermuda 6
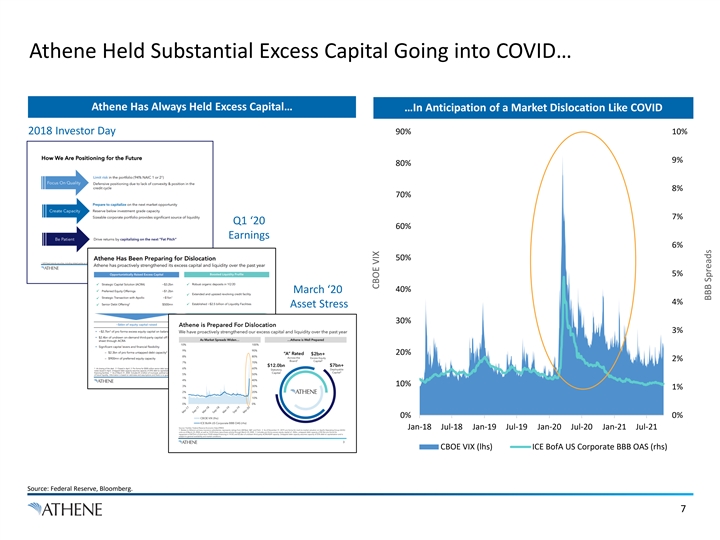
Athene Held Substantial Excess Capital Going into COVID… Athene Has Always Held Excess Capital… …In Anticipation of a Market Dislocation Like COVID 2018 Investor Day 90% 10% 9% 80% 8% 70% 7% Q1 ‘20 60% Earnings 6% 50% 5% 40% March ‘20 4% Asset Stress 30% 3% 20% 2% 10% 1% 0% 0% Jan-18 Jul-18 Jan-19 Jul-19 Jan-20 Jul-20 Jan-21 Jul-21 CBOE VIX (lhs) ICE BofA US Corporate BBB OAS (rhs) Source: Federal Reserve, Bloomberg. 7 CBOE VIX BBB SpreadsAthene Held Substantial Excess Capital Going into COVID… Athene Has Always Held Excess Capital… …In Anticipation of a Market Dislocation Like COVID 2018 Investor Day 90% 10% 9% 80% 8% 70% 7% Q1 ‘20 60% Earnings 6% 50% 5% 40% March ‘20 4% Asset Stress 30% 3% 20% 2% 10% 1% 0% 0% Jan-18 Jul-18 Jan-19 Jul-19 Jan-20 Jul-20 Jan-21 Jul-21 CBOE VIX (lhs) ICE BofA US Corporate BBB OAS (rhs) Source: Federal Reserve, Bloomberg. 7 CBOE VIX BBB Spreads
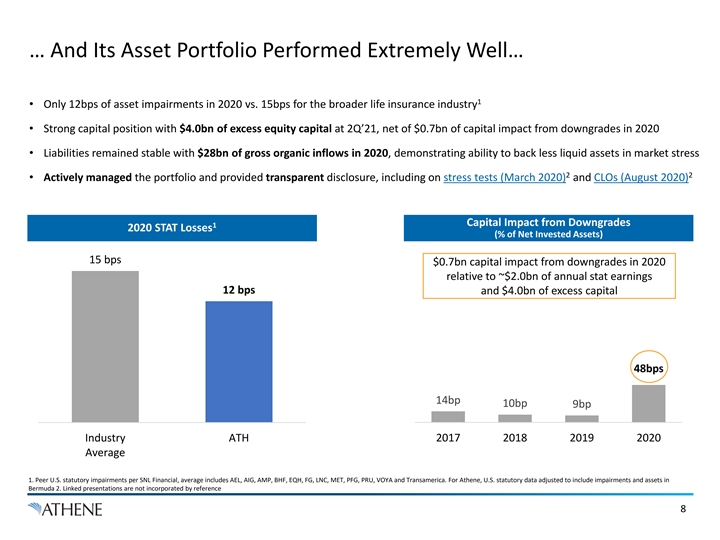
… And Its Asset Portfolio Performed Extremely Well… 1 • Only 12bps of asset impairments in 2020 vs. 15bps for the broader life insurance industry • Strong capital position with $4.0bn of excess equity capital at 2Q’21, net of $0.7bn of capital impact from downgrades in 2020 • Liabilities remained stable with $28bn of gross organic inflows in 2020, demonstrating ability to back less liquid assets in market stress 2 2 • Actively managed the portfolio and provided transparent disclosure, including on stress tests (March 2020) and CLOs (August 2020) Capital Impact from Downgrades 1 2020 STAT Losses (% of Net Invested Assets) 15 bps $0.7bn capital impact from downgrades in 2020 relative to ~$2.0bn of annual stat earnings 12 bps and $4.0bn of excess capital 48bps 14bp 10bp 9bp Industry ATH 2017 2018 2019 2020 Average 1. Peer U.S. statutory impairments per SNL Financial, average includes AEL, AIG, AMP, BHF, EQH, FG, LNC, MET, PFG, PRU, VOYA and Transamerica. For Athene, U.S. statutory data adjusted to include impairments and assets in Bermuda 2. Linked presentations are not incorporated by reference 8
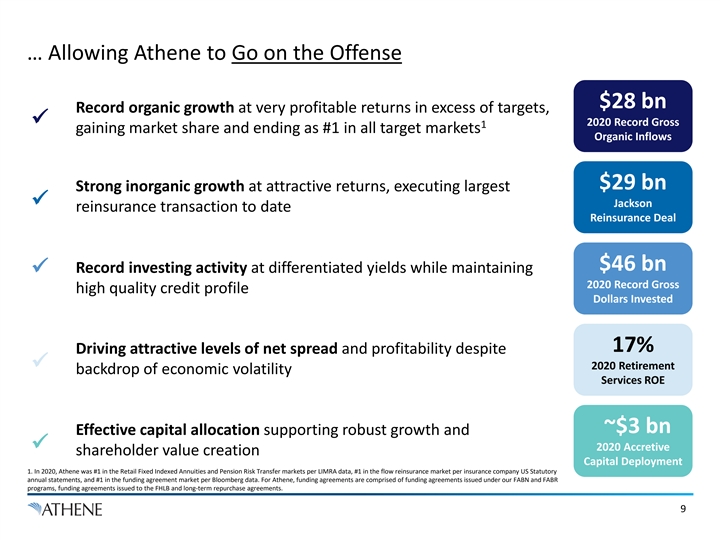
… Allowing Athene to Go on the Offense $28 bn Record organic growth at very profitable returns in excess of targets, ü 2020 Record Gross 1 gaining market share and ending as #1 in all target markets Organic Inflows $29 bn Strong inorganic growth at attractive returns, executing largest ü Jackson reinsurance transaction to date Reinsurance Deal $46 bn Record investing activity at differentiated yields while maintaining ü 2020 Record Gross high quality credit profile Dollars Invested 17% Driving attractive levels of net spread and profitability despite ü 2020 Retirement backdrop of economic volatility Services ROE ~$3 bn Effective capital allocation supporting robust growth and ü 2020 Accretive shareholder value creation Capital Deployment 1. In 2020, Athene was #1 in the Retail Fixed Indexed Annuities and Pension Risk Transfer markets per LIMRA data, #1 in the flow reinsurance market per insurance company US Statutory annual statements, and #1 in the funding agreement market per Bloomberg data. For Athene, funding agreements are comprised of funding agreements issued under our FABN and FABR programs, funding agreements issued to the FHLB and long-term repurchase agreements. 9… Allowing Athene to Go on the Offense $28 bn Record organic growth at very profitable returns in excess of targets, ü 2020 Record Gross 1 gaining market share and ending as #1 in all target markets Organic Inflows $29 bn Strong inorganic growth at attractive returns, executing largest ü Jackson reinsurance transaction to date Reinsurance Deal $46 bn Record investing activity at differentiated yields while maintaining ü 2020 Record Gross high quality credit profile Dollars Invested 17% Driving attractive levels of net spread and profitability despite ü 2020 Retirement backdrop of economic volatility Services ROE ~$3 bn Effective capital allocation supporting robust growth and ü 2020 Accretive shareholder value creation Capital Deployment 1. In 2020, Athene was #1 in the Retail Fixed Indexed Annuities and Pension Risk Transfer markets per LIMRA data, #1 in the flow reinsurance market per insurance company US Statutory annual statements, and #1 in the funding agreement market per Bloomberg data. For Athene, funding agreements are comprised of funding agreements issued under our FABN and FABR programs, funding agreements issued to the FHLB and long-term repurchase agreements. 9

Athene’s Success Was Recognized - S&P Upgraded to ‘A+’ Rating Agency FSR Rating / Outlook Commentary “During the height of the COVID-19 pandemic and the related economic crisis, Athene continued to grow its businesses while maintaining capital strength ‘A+’ S&P Global ‘A+’ at the “AA” level per our capital model…Our raising of Athene’s financial Stable strength and issuer credit ratings reflects the group’s capital strength and balance sheet growth….” –S&P, May 2021 “… Athene has moved into a leading market position in key business lines…[Athene] produced strong returns on capital in 2020 and into 2021 despite headwinds associated with the ongoing pandemic… The company's ‘A’ portfolio has performed well over the last 18 months with minimal reported ‘A’ Positive and modest credit migration…. Fitch believes Athene is well positioned to manage interest rate risk going forward…” –Fitch, August 2021 “The ratings reflect Athene’s balance sheet strength, which AM Best categorizes as very strong, as well as its strong operating performance, ‘A’ A.M Best favorable business profile and appropriate enterprise risk management…” ‘A’ Stable –A.M. Best, April 2021 Note: Ratings represent financial strength ratings for primary insurance subsidiaries 10Athene’s Success Was Recognized - S&P Upgraded to ‘A+’ Rating Agency FSR Rating / Outlook Commentary “During the height of the COVID-19 pandemic and the related economic crisis, Athene continued to grow its businesses while maintaining capital strength ‘A+’ S&P Global ‘A+’ at the “AA” level per our capital model…Our raising of Athene’s financial Stable strength and issuer credit ratings reflects the group’s capital strength and balance sheet growth….” –S&P, May 2021 “… Athene has moved into a leading market position in key business lines…[Athene] produced strong returns on capital in 2020 and into 2021 despite headwinds associated with the ongoing pandemic… The company's ‘A’ portfolio has performed well over the last 18 months with minimal reported ‘A’ Positive and modest credit migration…. Fitch believes Athene is well positioned to manage interest rate risk going forward…” –Fitch, August 2021 “The ratings reflect Athene’s balance sheet strength, which AM Best categorizes as very strong, as well as its strong operating performance, ‘A’ A.M Best favorable business profile and appropriate enterprise risk management…” ‘A’ Stable –A.M. Best, April 2021 Note: Ratings represent financial strength ratings for primary insurance subsidiaries 10
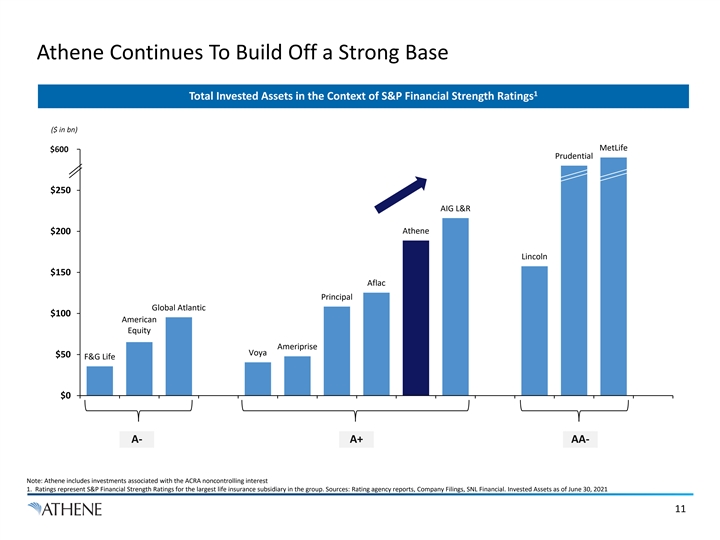
Athene Continues To Build Off a Strong Base 1 Total Invested Assets in the Context of S&P Financial Strength Ratings ($ in bn) MetLife $600 $300 Prudential $250 AIG L&R $200 Athene Lincoln $150 Aflac Principal Global Atlantic $100 American Equity Ameriprise Voya $50 F&G Life $0 A- A+ AA- Note: Athene includes investments associated with the ACRA noncontrolling interest 1. Ratings represent S&P Financial Strength Ratings for the largest life insurance subsidiary in the group. Sources: Rating agency reports, Company Filings, SNL Financial. Invested Assets as of June 30, 2021 11Athene Continues To Build Off a Strong Base 1 Total Invested Assets in the Context of S&P Financial Strength Ratings ($ in bn) MetLife $600 $300 Prudential $250 AIG L&R $200 Athene Lincoln $150 Aflac Principal Global Atlantic $100 American Equity Ameriprise Voya $50 F&G Life $0 A- A+ AA- Note: Athene includes investments associated with the ACRA noncontrolling interest 1. Ratings represent S&P Financial Strength Ratings for the largest life insurance subsidiary in the group. Sources: Rating agency reports, Company Filings, SNL Financial. Invested Assets as of June 30, 2021 11
Athene’s Investment Philosophy 12Athene’s Investment Philosophy 12
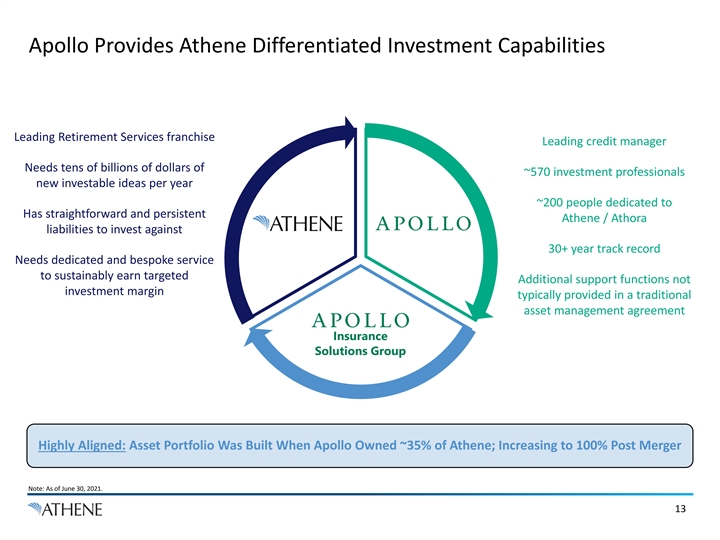
Apollo Provides Athene Differentiated Investment Capabilities Leading Retirement Services franchise Leading credit manager Needs tens of billions of dollars of ~570 investment professionals new investable ideas per year ~200 people dedicated to Has straightforward and persistent Athene / Athora liabilities to invest against 30+ year track record Needs dedicated and bespoke service to sustainably earn targeted Additional support functions not investment margin typically provided in a traditional asset management agreement Insurance Solutions Group Highly Aligned: Asset Portfolio Was Built When Apollo Owned ~35% of Athene; Increasing to 100% Post Merger Note: As of June 30, 2021. 13Apollo Provides Athene Differentiated Investment Capabilities Leading Retirement Services franchise Leading credit manager Needs tens of billions of dollars of ~570 investment professionals new investable ideas per year ~200 people dedicated to Has straightforward and persistent Athene / Athora liabilities to invest against 30+ year track record Needs dedicated and bespoke service to sustainably earn targeted Additional support functions not investment margin typically provided in a traditional asset management agreement Insurance Solutions Group Highly Aligned: Asset Portfolio Was Built When Apollo Owned ~35% of Athene; Increasing to 100% Post Merger Note: As of June 30, 2021. 13
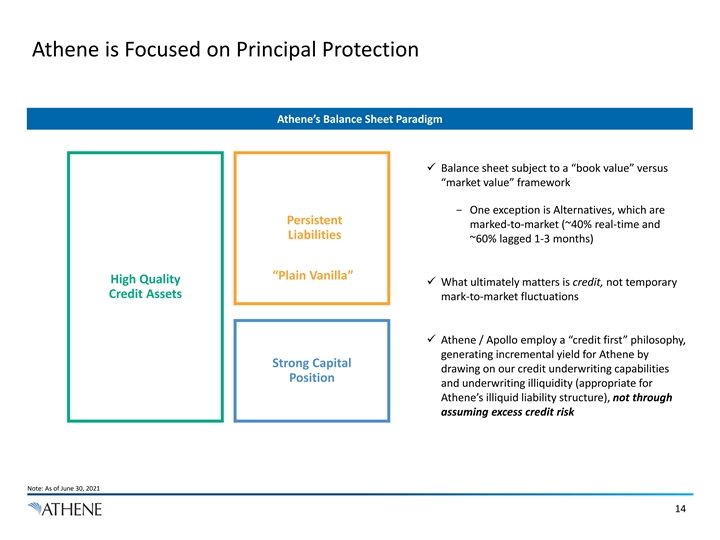
Athene is Focused on Principal Protection Athene’s Balance Sheet Paradigm ü Balance sheet subject to a “book value” versus “market value” framework - One exception is Alternatives, which are Persistent marked-to-market (~40% real-time and Liabilities ~60% lagged 1-3 months) “Plain Vanilla” High Quality ü What ultimately matters is credit, not temporary Credit Assets mark-to-market fluctuations ü Athene / Apollo employ a “credit first” philosophy, generating incremental yield for Athene by Strong Capital drawing on our credit underwriting capabilities Position and underwriting illiquidity (appropriate for Athene’s illiquid liability structure), not through assuming excess credit risk Note: As of June 30, 2021 14Athene is Focused on Principal Protection Athene’s Balance Sheet Paradigm ü Balance sheet subject to a “book value” versus “market value” framework - One exception is Alternatives, which are Persistent marked-to-market (~40% real-time and Liabilities ~60% lagged 1-3 months) “Plain Vanilla” High Quality ü What ultimately matters is credit, not temporary Credit Assets mark-to-market fluctuations ü Athene / Apollo employ a “credit first” philosophy, generating incremental yield for Athene by Strong Capital drawing on our credit underwriting capabilities Position and underwriting illiquidity (appropriate for Athene’s illiquid liability structure), not through assuming excess credit risk Note: As of June 30, 2021 14
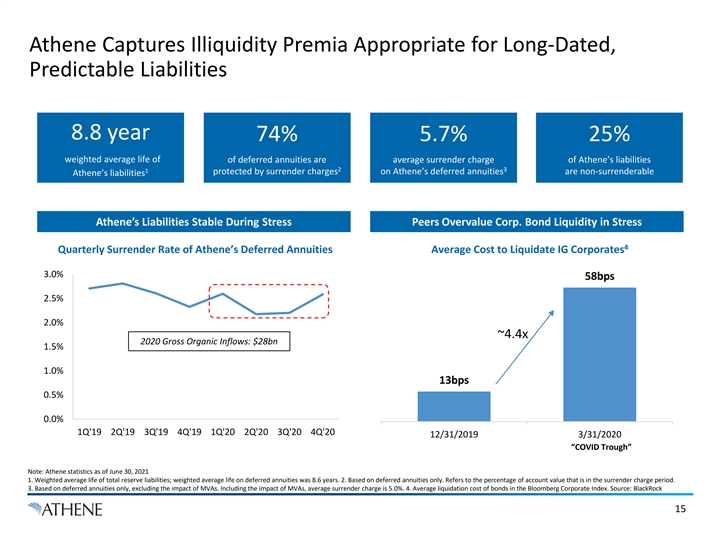
Athene Captures Illiquidity Premia Appropriate for Long-Dated, Predictable Liabilities 8.8 year 74% 5.7% 25% weighted average life of of deferred annuities are average surrender charge of Athene’s liabilities 2 3 1 protected by surrender charges on Athene’s deferred annuities are non-surrenderable Athene’s liabilities Athene’s Liabilities Stable During Stress Peers Overvalue Corp. Bond Liquidity in Stress 4 Quarterly Surrender Rate of Athene’s Deferred Annuities Average Cost to Liquidate IG Corporates 3.0% 58bps 2.5% 2.0% ~4.4x 2020 Gross Organic Inflows: $28bn 1.5% 1.0% 13bps 0.5% 0.0% 1Q'19 2Q'19 3Q'19 4Q'19 1Q'20 2Q'20 3Q'20 4Q'20 12/31/2019 3/31/2020 “COVID Trough” Note: Athene statistics as of June 30, 2021 1. Weighted average life of total reserve liabilities; weighted average life on deferred annuities was 8.6 years. 2. Based on deferred annuities only. Refers to the percentage of account value that is in the surrender charge period. 3. Based on deferred annuities only, excluding the impact of MVAs. Including the impact of MVAs, average surrender charge is 5.0%. 4. Average liquidation cost of bonds in the Bloomberg Corporate Index. Source: BlackRock 15Athene Captures Illiquidity Premia Appropriate for Long-Dated, Predictable Liabilities 8.8 year 74% 5.7% 25% weighted average life of of deferred annuities are average surrender charge of Athene’s liabilities 2 3 1 protected by surrender charges on Athene’s deferred annuities are non-surrenderable Athene’s liabilities Athene’s Liabilities Stable During Stress Peers Overvalue Corp. Bond Liquidity in Stress 4 Quarterly Surrender Rate of Athene’s Deferred Annuities Average Cost to Liquidate IG Corporates 3.0% 58bps 2.5% 2.0% ~4.4x 2020 Gross Organic Inflows: $28bn 1.5% 1.0% 13bps 0.5% 0.0% 1Q'19 2Q'19 3Q'19 4Q'19 1Q'20 2Q'20 3Q'20 4Q'20 12/31/2019 3/31/2020 “COVID Trough” Note: Athene statistics as of June 30, 2021 1. Weighted average life of total reserve liabilities; weighted average life on deferred annuities was 8.6 years. 2. Based on deferred annuities only. Refers to the percentage of account value that is in the surrender charge period. 3. Based on deferred annuities only, excluding the impact of MVAs. Including the impact of MVAs, average surrender charge is 5.0%. 4. Average liquidation cost of bonds in the Bloomberg Corporate Index. Source: BlackRock 15
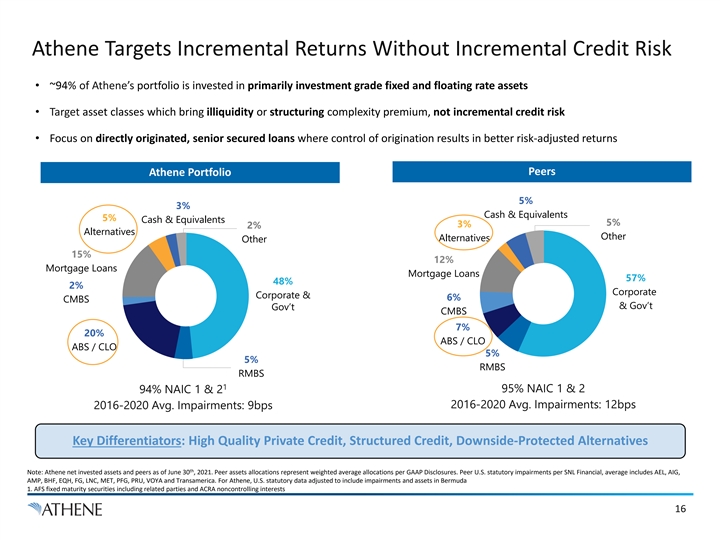
Athene Targets Incremental Returns Without Incremental Credit Risk • ~94% of Athene’s portfolio is invested in primarily investment grade fixed and floating rate assets • Target asset classes which bring illiquidity or structuring complexity premium, not incremental credit risk • Focus on directly originated, senior secured loans where control of origination results in better risk-adjusted returns Peers Athene Portfolio 5% 3% Cash & Equivalents 5% Cash & Equivalents 5% 3% 2% Alternatives Other Alternatives Other 15% 12% Mortgage Loans Mortgage Loans 57% 48% 2% Corporate Corporate & 6% CMBS & Gov’t Gov’t CMBS 7% 20% ABS / CLO ABS / CLO 5% 5% RMBS RMBS 1 95% NAIC 1 & 2 94% NAIC 1 & 2 2016-2020 Avg. Impairments: 12bps 2016-2020 Avg. Impairments: 9bps Key Differentiators: High Quality Private Credit, Structured Credit, Downside-Protected Alternatives th Note: Athene net invested assets and peers as of June 30 , 2021. Peer assets allocations represent weighted average allocations per GAAP Disclosures. Peer U.S. statutory impairments per SNL Financial, average includes AEL, AIG, AMP, BHF, EQH, FG, LNC, MET, PFG, PRU, VOYA and Transamerica. For Athene, U.S. statutory data adjusted to include impairments and assets in Bermuda 1. AFS fixed maturity securities including related parties and ACRA noncontrolling interests 16
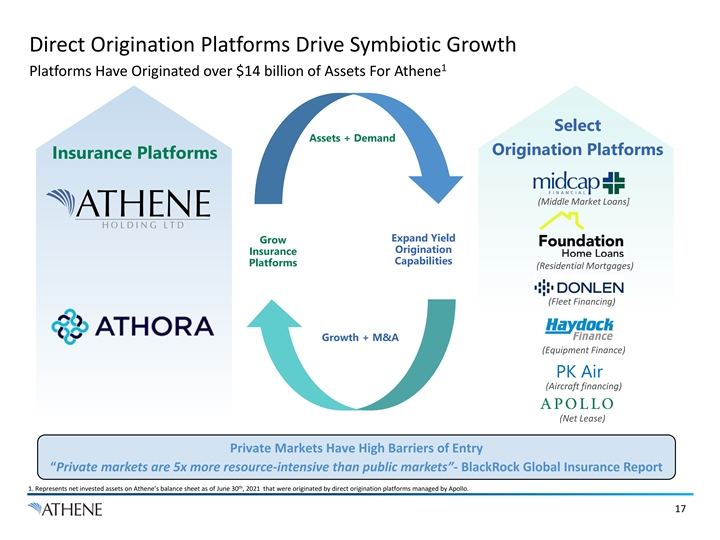
Direct Origination Platforms Drive Symbiotic Growth 1 Platforms Have Originated over $14 billion of Assets For Athene Select Assets + Demand Origination Platforms Insurance Platforms (Middle Market Loans] Expand Yield Grow Origination Insurance Capabilities Platforms (Residential Mortgages) (Fleet Financing) Growth + M&A (Equipment Finance) PK Air (Aircraft financing) (Net Lease) Private Markets Have High Barriers of Entry “Private markets are 5x more resource-intensive than public markets”- BlackRock Global Insurance Report th 1. Represents net invested assets on Athene’s balance sheet as of June 30 , 2021 that were originated by direct origination platforms managed by Apollo. 17Direct Origination Platforms Drive Symbiotic Growth 1 Platforms Have Originated over $14 billion of Assets For Athene Select Assets + Demand Origination Platforms Insurance Platforms (Middle Market Loans] Expand Yield Grow Origination Insurance Capabilities Platforms (Residential Mortgages) (Fleet Financing) Growth + M&A (Equipment Finance) PK Air (Aircraft financing) (Net Lease) Private Markets Have High Barriers of Entry “Private markets are 5x more resource-intensive than public markets”- BlackRock Global Insurance Report th 1. Represents net invested assets on Athene’s balance sheet as of June 30 , 2021 that were originated by direct origination platforms managed by Apollo. 17
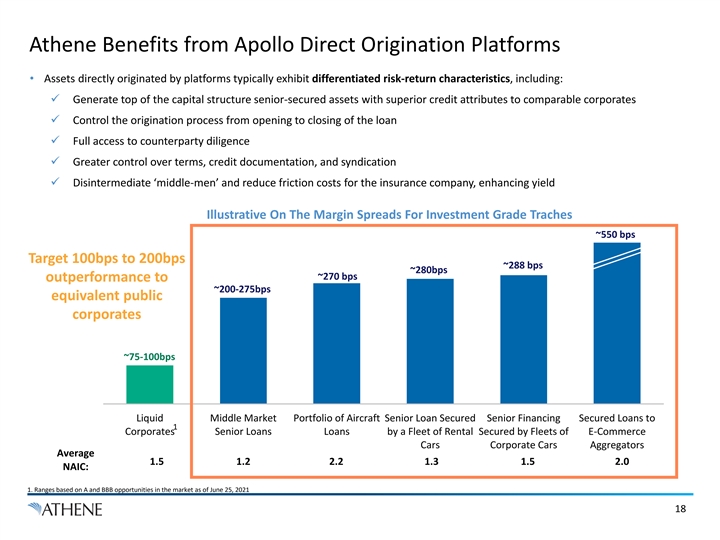
Athene Benefits from Apollo Direct Origination Platforms • Assets directly originated by platforms typically exhibit differentiated risk-return characteristics, including: ü Generate top of the capital structure senior-secured assets with superior credit attributes to comparable corporates ü Control the origination process from opening to closing of the loan ü Full access to counterparty diligence ü Greater control over terms, credit documentation, and syndication ü Disintermediate ‘middle-men’ and reduce friction costs for the insurance company, enhancing yield Illustrative On The Margin Spreads For Investment Grade Traches ~550 bps Target 100bps to 200bps ~288 bps ~280bps ~270 bps outperformance to ~200-275bps equivalent public corporates ~75-100bps Liquid Middle Market Portfolio of Aircraft Senior Loan Secured Senior Financing Secured Loans to 1 Corporates Senior Loans Loans by a Fleet of Rental Secured by Fleets of E-Commerce Cars Corporate Cars Aggregators Average 1.5 1.2 2.2 1.3 1.5 2.0 NAIC: 1. Ranges based on A and BBB opportunities in the market as of June 25, 2021 18Athene Benefits from Apollo Direct Origination Platforms • Assets directly originated by platforms typically exhibit differentiated risk-return characteristics, including: ü Generate top of the capital structure senior-secured assets with superior credit attributes to comparable corporates ü Control the origination process from opening to closing of the loan ü Full access to counterparty diligence ü Greater control over terms, credit documentation, and syndication ü Disintermediate ‘middle-men’ and reduce friction costs for the insurance company, enhancing yield Illustrative On The Margin Spreads For Investment Grade Traches ~550 bps Target 100bps to 200bps ~288 bps ~280bps ~270 bps outperformance to ~200-275bps equivalent public corporates ~75-100bps Liquid Middle Market Portfolio of Aircraft Senior Loan Secured Senior Financing Secured Loans to 1 Corporates Senior Loans Loans by a Fleet of Rental Secured by Fleets of E-Commerce Cars Corporate Cars Aggregators Average 1.5 1.2 2.2 1.3 1.5 2.0 NAIC: 1. Ranges based on A and BBB opportunities in the market as of June 25, 2021 18
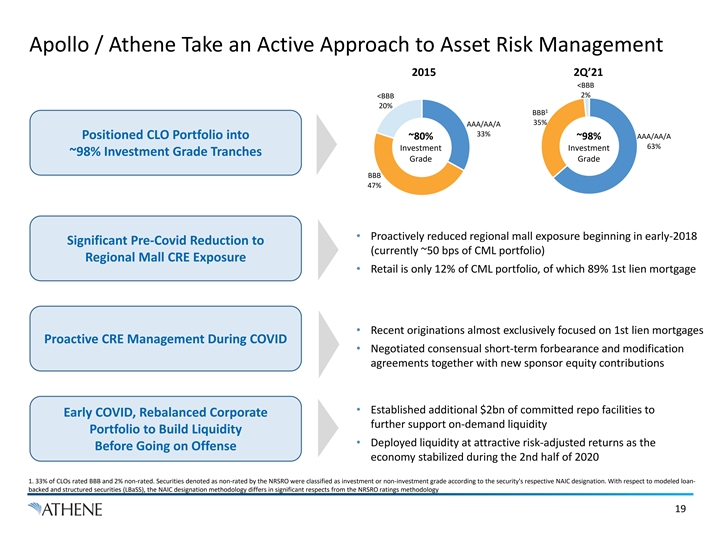
Apollo / Athene Take an Active Approach to Asset Risk Management 2015 2Q’21 <BBB <BBB 2% 20% 1 BBB 35% AAA/AA/A 33% Positioned CLO Portfolio into AAA/AA/A ~80% ~98% 63% Investment Investment ~98% Investment Grade Tranches Grade Grade BBB 47% • Proactively reduced regional mall exposure beginning in early-2018 Significant Pre-Covid Reduction to (currently ~50 bps of CML portfolio) Regional Mall CRE Exposure • Retail is only 12% of CML portfolio, of which 89% 1st lien mortgage • Recent originations almost exclusively focused on 1st lien mortgages Proactive CRE Management During COVID • Negotiated consensual short-term forbearance and modification agreements together with new sponsor equity contributions • Established additional $2bn of committed repo facilities to Early COVID, Rebalanced Corporate further support on-demand liquidity Portfolio to Build Liquidity • Deployed liquidity at attractive risk-adjusted returns as the Before Going on Offense economy stabilized during the 2nd half of 2020 1. 33% of CLOs rated BBB and 2% non-rated. Securities denoted as non-rated by the NRSRO were classified as investment or non-investment grade according to the security's respective NAIC designation. With respect to modeled loan- backed and structured securities (LBaSS), the NAIC designation methodology differs in significant respects from the NRSRO ratings methodology 19Apollo / Athene Take an Active Approach to Asset Risk Management 2015 2Q’21 <BBB <BBB 2% 20% 1 BBB 35% AAA/AA/A 33% Positioned CLO Portfolio into AAA/AA/A ~80% ~98% 63% Investment Investment ~98% Investment Grade Tranches Grade Grade BBB 47% • Proactively reduced regional mall exposure beginning in early-2018 Significant Pre-Covid Reduction to (currently ~50 bps of CML portfolio) Regional Mall CRE Exposure • Retail is only 12% of CML portfolio, of which 89% 1st lien mortgage • Recent originations almost exclusively focused on 1st lien mortgages Proactive CRE Management During COVID • Negotiated consensual short-term forbearance and modification agreements together with new sponsor equity contributions • Established additional $2bn of committed repo facilities to Early COVID, Rebalanced Corporate further support on-demand liquidity Portfolio to Build Liquidity • Deployed liquidity at attractive risk-adjusted returns as the Before Going on Offense economy stabilized during the 2nd half of 2020 1. 33% of CLOs rated BBB and 2% non-rated. Securities denoted as non-rated by the NRSRO were classified as investment or non-investment grade according to the security's respective NAIC designation. With respect to modeled loan- backed and structured securities (LBaSS), the NAIC designation methodology differs in significant respects from the NRSRO ratings methodology 19
Risk Management Overview 20Risk Management Overview 20
Risk Management is Embedded in Everything We Do Manage Athene’s Risks So That It Can Grow Profitably Across Various Markets • Robust risk management framework and procedures • Risk appetite is to avoid ratings downgrades in a typical “recession” scenario, and maintain investment grade ratings in a “deep recession” scenario more severe than 2008/2009 • Risk strategy, investment, ALM and liquidity compliance policies at the board and management levels • Engage in active management of the asset portfolio • Stress testing plays a key role in defining risk appetite • Stress tests are performed on both sides of the balance sheet • Risk team plays a key role in assessing inorganic opportunities 21Risk Management is Embedded in Everything We Do Manage Athene’s Risks So That It Can Grow Profitably Across Various Markets • Robust risk management framework and procedures • Risk appetite is to avoid ratings downgrades in a typical “recession” scenario, and maintain investment grade ratings in a “deep recession” scenario more severe than 2008/2009 • Risk strategy, investment, ALM and liquidity compliance policies at the board and management levels • Engage in active management of the asset portfolio • Stress testing plays a key role in defining risk appetite • Stress tests are performed on both sides of the balance sheet • Risk team plays a key role in assessing inorganic opportunities 21
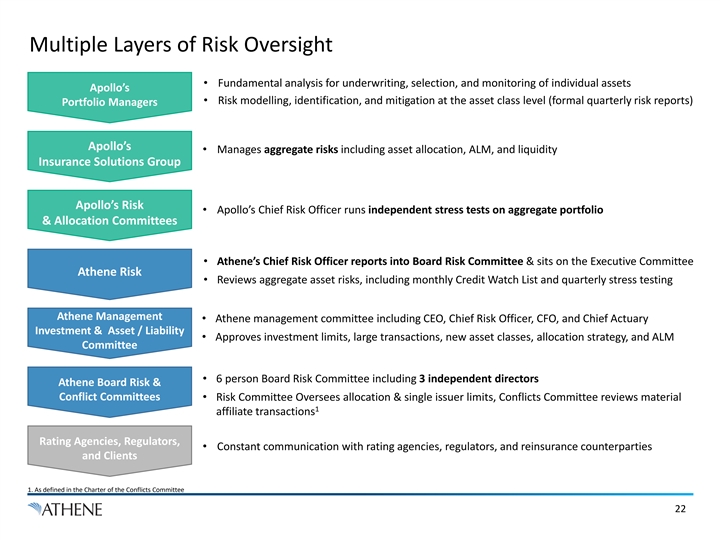
Multiple Layers of Risk Oversight • Fundamental analysis for underwriting, selection, and monitoring of individual assets Apollo’s • Risk modelling, identification, and mitigation at the asset class level (formal quarterly risk reports) Portfolio Managers Apollo’s • Manages aggregate risks including asset allocation, ALM, and liquidity Insurance Solutions Group Apollo’s Risk • Apollo’s Chief Risk Officer runs independent stress tests on aggregate portfolio & Allocation Committees • Athene’s Chief Risk Officer reports into Board Risk Committee & sits on the Executive Committee Athene Risk • Reviews aggregate asset risks, including monthly Credit Watch List and quarterly stress testing Athene Management • Athene management committee including CEO, Chief Risk Officer, CFO, and Chief Actuary Investment & Asset / Liability • Approves investment limits, large transactions, new asset classes, allocation strategy, and ALM Committee • 6 person Board Risk Committee including 3 independent directors Athene Board Risk & Conflict Committees • Risk Committee Oversees allocation & single issuer limits, Conflicts Committee reviews material 1 affiliate transactions Rating Agencies, Regulators, • Constant communication with rating agencies, regulators, and reinsurance counterparties and Clients 1. As defined in the Charter of the Conflicts Committee 22Multiple Layers of Risk Oversight • Fundamental analysis for underwriting, selection, and monitoring of individual assets Apollo’s • Risk modelling, identification, and mitigation at the asset class level (formal quarterly risk reports) Portfolio Managers Apollo’s • Manages aggregate risks including asset allocation, ALM, and liquidity Insurance Solutions Group Apollo’s Risk • Apollo’s Chief Risk Officer runs independent stress tests on aggregate portfolio & Allocation Committees • Athene’s Chief Risk Officer reports into Board Risk Committee & sits on the Executive Committee Athene Risk • Reviews aggregate asset risks, including monthly Credit Watch List and quarterly stress testing Athene Management • Athene management committee including CEO, Chief Risk Officer, CFO, and Chief Actuary Investment & Asset / Liability • Approves investment limits, large transactions, new asset classes, allocation strategy, and ALM Committee • 6 person Board Risk Committee including 3 independent directors Athene Board Risk & Conflict Committees • Risk Committee Oversees allocation & single issuer limits, Conflicts Committee reviews material 1 affiliate transactions Rating Agencies, Regulators, • Constant communication with rating agencies, regulators, and reinsurance counterparties and Clients 1. As defined in the Charter of the Conflicts Committee 22
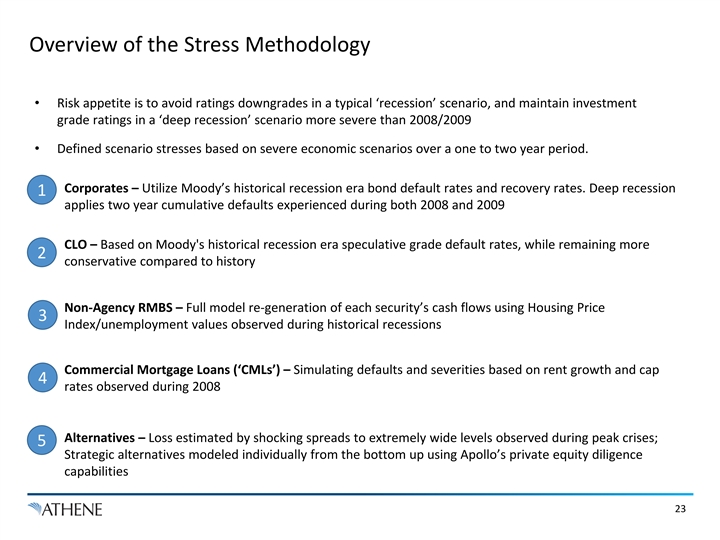
Overview of the Stress Methodology • Risk appetite is to avoid ratings downgrades in a typical ‘recession’ scenario, and maintain investment grade ratings in a ‘deep recession’ scenario more severe than 2008/2009 • Defined scenario stresses based on severe economic scenarios over a one to two year period. Corporates – Utilize Moody’s historical recession era bond default rates and recovery rates. Deep recession 1 applies two year cumulative defaults experienced during both 2008 and 2009 CLO – Based on Moody's historical recession era speculative grade default rates, while remaining more 2 conservative compared to history Non-Agency RMBS – Full model re-generation of each security’s cash flows using Housing Price 3 Index/unemployment values observed during historical recessions Commercial Mortgage Loans (‘CMLs’) – Simulating defaults and severities based on rent growth and cap 4 rates observed during 2008 Alternatives – Loss estimated by shocking spreads to extremely wide levels observed during peak crises; 5 Strategic alternatives modeled individually from the bottom up using Apollo’s private equity diligence capabilities 23Overview of the Stress Methodology • Risk appetite is to avoid ratings downgrades in a typical ‘recession’ scenario, and maintain investment grade ratings in a ‘deep recession’ scenario more severe than 2008/2009 • Defined scenario stresses based on severe economic scenarios over a one to two year period. Corporates – Utilize Moody’s historical recession era bond default rates and recovery rates. Deep recession 1 applies two year cumulative defaults experienced during both 2008 and 2009 CLO – Based on Moody's historical recession era speculative grade default rates, while remaining more 2 conservative compared to history Non-Agency RMBS – Full model re-generation of each security’s cash flows using Housing Price 3 Index/unemployment values observed during historical recessions Commercial Mortgage Loans (‘CMLs’) – Simulating defaults and severities based on rent growth and cap 4 rates observed during 2008 Alternatives – Loss estimated by shocking spreads to extremely wide levels observed during peak crises; 5 Strategic alternatives modeled individually from the bottom up using Apollo’s private equity diligence capabilities 23

Stress Assumptions in Historical Context Athene Assumptions Sample Historical Recession Data Baseline Deep 1 Recession Recession 1990 2001 2008 Euro 2016 COVID 2020 Scenario Scenario 10 Yr US Down 60% Down 83% 2 Treasury Up 4% Down 21% Down 43% Down 84% Down 68% (e.g. ~70bps) (e.g. ~120bps) Yield Absolute 279bps / 636bps / 240bps / 318bps / 642bps / 317bps / 474bps / Spreads 3 3 802bps 1,789bps NA 1,083bps 1,913bps 876bps 1139bps (BBB / B) Equity (34%) (49%) (20%) (30%) (49%) (12%) (34%) 4 Markets Fixed Income 0.7% / 1.4% / 0.3% / 1.0% / 0.9% / 0.0% / 0.1% / Defaults 12.9% 13.7% 13.7% 9.2% 7.1% 2.4% 6.2% (BBB / B) Housing Price (Peak to (3%) (27%) (3%) No Decline (33%) No Decline No Decline Trough) Source: Spread –JPMorgan US Liquid Index (JULI) BBB Spread (Libor) for BBB and JPMorgan Domestic HY Spread to Worst for B, except for 1990 and Euro 2016. For 1990: Federal Reserve Bank of St. Louis, Moody's Seasoned Baa Corporate Bond Yield Relative to Yield on 10-Year Treasury Constant Maturity BAA10Y as JP Morgan indices were not available. For Euro 2016: JPMorgan US Liquid Index (JULI) BBB Spread (Treasury) on Feb 10th 2016 for BBB and JPMorgan Developed Market Single B HY Spread to Worst on Feb 9th, 2016 for B. FI Default – For COVID 2020: Moody’s Monthly Default Report from Moody’s Investor Services. For historical experiences: Moody’s Annual Default Study, Corporate Default and Recovery Rates. There is no guarantee that Athene will be able to replicate actual historical recession experience under current market conditions or during future recessions. 1. 10yr US Treasury Yield: Feb 19, 2020 to COVID trough on Aug 4, 2020; Spreads: peak daily absolute spreads during 2020; Equity Markets: SPX pre-COVID peak on Feb 19, 2020 to COVID trough on Mar 23, 2021; FI defaults: peak TTM BBB and B US bond default rates during 2020; Housing price: No decline in TTM Corelogic National HPI index during 2020. 2. German 10-year bund yield. 3. Indicative levels, actual absolute spreads determined formulaically based on prevailing market spreads, predetermined spread multipliers and ceilings. 4. Primarily for representative purposes. Stress scenarios apply customized stresses as relevant for Alternatives sub-categories. Adjusted equities recession shock to reflect worst peak to trough drop, in place of average, during recession years (1990-1991, 2001-2002) 24 Key Levers Driving Losses
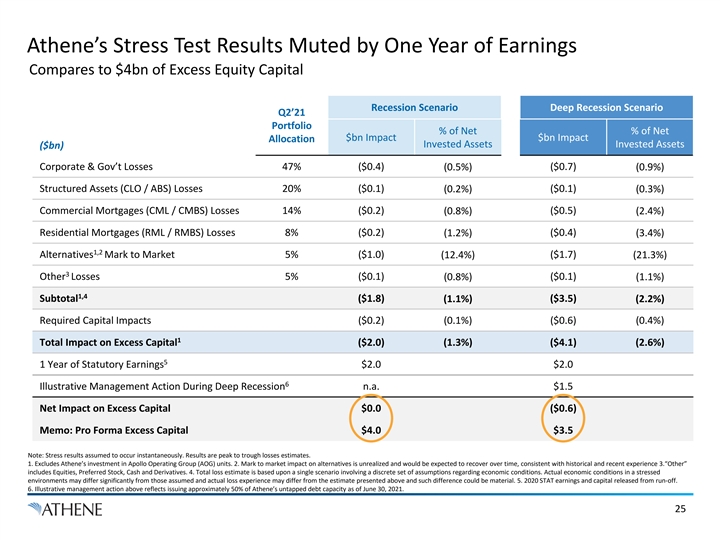
Athene’s Stress Test Results Muted by One Year of Earnings Compares to $4bn of Excess Equity Capital Recession Scenario Deep Recession Scenario Q2’21 Portfolio % of Net % of Net $bn Impact $bn Impact Allocation Invested Assets Invested Assets ($bn) Corporate & Gov’t Losses 47% ($0.4) (0.5%) ($0.7) (0.9%) Structured Assets (CLO / ABS) Losses 20% ($0.1) (0.2%) ($0.1) (0.3%) Commercial Mortgages (CML / CMBS) Losses 14% ($0.2) (0.8%) ($0.5) (2.4%) Residential Mortgages (RML / RMBS) Losses 8% ($0.2) (1.2%) ($0.4) (3.4%) 1,2 Alternatives Mark to Market 5% ($1.0) (12.4%) ($1.7) (21.3%) 3 Other Losses 5% ($0.1) (0.8%) ($0.1) (1.1%) 1,4 Subtotal ($1.8) (1.1%) ($3.5) (2.2%) Required Capital Impacts ($0.2) (0.1%) ($0.6) (0.4%) 1 Total Impact on Excess Capital ($2.0) (1.3%) ($4.1) (2.6%) 5 1 Year of Statutory Earnings $2.0 $2.0 6 Illustrative Management Action During Deep Recession n.a. $1.5 Net Impact on Excess Capital $0.0 ($0.6) Memo: Pro Forma Excess Capital $4.0 $3.5 Note: Stress results assumed to occur instantaneously. Results are peak to trough losses estimates. 1. Excludes Athene’s investment in Apollo Operating Group (AOG) units. 2. Mark to market impact on alternatives is unrealized and would be expected to recover over time, consistent with historical and recent experience 3.“Other” includes Equities, Preferred Stock, Cash and Derivatives. 4. Total loss estimate is based upon a single scenario involving a discrete set of assumptions regarding economic conditions. Actual economic conditions in a stressed environments may differ significantly from those assumed and actual loss experience may differ from the estimate presented above and such difference could be material. 5. 2020 STAT earnings and capital released from run-off. 6. Illustrative management action above reflects issuing approximately 50% of Athene’s untapped debt capacity as of June 30, 2021. 25Athene’s Stress Test Results Muted by One Year of Earnings Compares to $4bn of Excess Equity Capital Recession Scenario Deep Recession Scenario Q2’21 Portfolio % of Net % of Net $bn Impact $bn Impact Allocation Invested Assets Invested Assets ($bn) Corporate & Gov’t Losses 47% ($0.4) (0.5%) ($0.7) (0.9%) Structured Assets (CLO / ABS) Losses 20% ($0.1) (0.2%) ($0.1) (0.3%) Commercial Mortgages (CML / CMBS) Losses 14% ($0.2) (0.8%) ($0.5) (2.4%) Residential Mortgages (RML / RMBS) Losses 8% ($0.2) (1.2%) ($0.4) (3.4%) 1,2 Alternatives Mark to Market 5% ($1.0) (12.4%) ($1.7) (21.3%) 3 Other Losses 5% ($0.1) (0.8%) ($0.1) (1.1%) 1,4 Subtotal ($1.8) (1.1%) ($3.5) (2.2%) Required Capital Impacts ($0.2) (0.1%) ($0.6) (0.4%) 1 Total Impact on Excess Capital ($2.0) (1.3%) ($4.1) (2.6%) 5 1 Year of Statutory Earnings $2.0 $2.0 6 Illustrative Management Action During Deep Recession n.a. $1.5 Net Impact on Excess Capital $0.0 ($0.6) Memo: Pro Forma Excess Capital $4.0 $3.5 Note: Stress results assumed to occur instantaneously. Results are peak to trough losses estimates. 1. Excludes Athene’s investment in Apollo Operating Group (AOG) units. 2. Mark to market impact on alternatives is unrealized and would be expected to recover over time, consistent with historical and recent experience 3.“Other” includes Equities, Preferred Stock, Cash and Derivatives. 4. Total loss estimate is based upon a single scenario involving a discrete set of assumptions regarding economic conditions. Actual economic conditions in a stressed environments may differ significantly from those assumed and actual loss experience may differ from the estimate presented above and such difference could be material. 5. 2020 STAT earnings and capital released from run-off. 6. Illustrative management action above reflects issuing approximately 50% of Athene’s untapped debt capacity as of June 30, 2021. 25
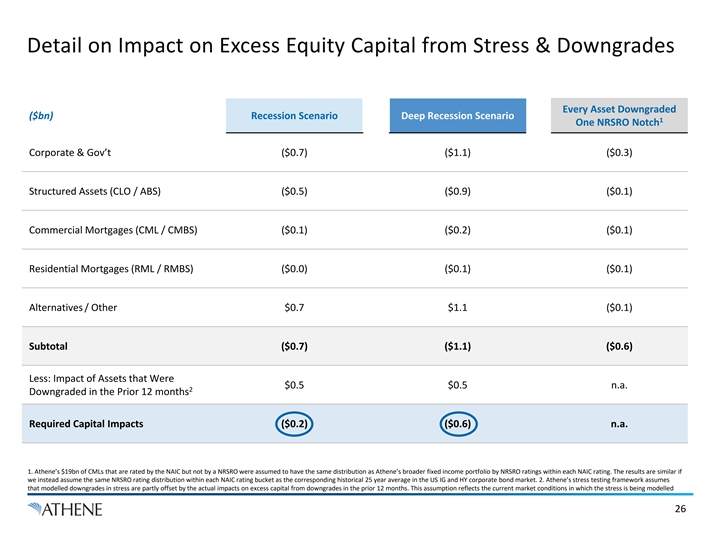
Detail on Impact on Excess Equity Capital from Stress & Downgrades Every Asset Downgraded ($bn) Recession Scenario Deep Recession Scenario 1 One NRSRO Notch Corporate & Gov’t ($0.7) ($1.1) ($0.3) Structured Assets (CLO / ABS) ($0.5) ($0.9) ($0.1) Commercial Mortgages (CML / CMBS) ($0.1) ($0.2) ($0.1) Residential Mortgages (RML / RMBS) ($0.0) ($0.1) ($0.1) Alternatives / Other $0.7 $1.1 ($0.1) Subtotal ($0.7) ($1.1) ($0.6) Less: Impact of Assets that Were $0.5 $0.5 n.a. 2 Downgraded in the Prior 12 months Required Capital Impacts ($0.2) ($0.6) n.a. 1. Athene’s $19bn of CMLs that are rated by the NAIC but not by a NRSRO were assumed to have the same distribution as Athene’s broader fixed income portfolio by NRSRO ratings within each NAIC rating. The results are similar if we instead assume the same NRSRO rating distribution within each NAIC rating bucket as the corresponding historical 25 year average in the US IG and HY corporate bond market. 2. Athene’s stress testing framework assumes that modelled downgrades in stress are partly offset by the actual impacts on excess capital from downgrades in the prior 12 months. This assumption reflects the current market conditions in which the stress is being modelled 26Detail on Impact on Excess Equity Capital from Stress & Downgrades Every Asset Downgraded ($bn) Recession Scenario Deep Recession Scenario 1 One NRSRO Notch Corporate & Gov’t ($0.7) ($1.1) ($0.3) Structured Assets (CLO / ABS) ($0.5) ($0.9) ($0.1) Commercial Mortgages (CML / CMBS) ($0.1) ($0.2) ($0.1) Residential Mortgages (RML / RMBS) ($0.0) ($0.1) ($0.1) Alternatives / Other $0.7 $1.1 ($0.1) Subtotal ($0.7) ($1.1) ($0.6) Less: Impact of Assets that Were $0.5 $0.5 n.a. 2 Downgraded in the Prior 12 months Required Capital Impacts ($0.2) ($0.6) n.a. 1. Athene’s $19bn of CMLs that are rated by the NAIC but not by a NRSRO were assumed to have the same distribution as Athene’s broader fixed income portfolio by NRSRO ratings within each NAIC rating. The results are similar if we instead assume the same NRSRO rating distribution within each NAIC rating bucket as the corresponding historical 25 year average in the US IG and HY corporate bond market. 2. Athene’s stress testing framework assumes that modelled downgrades in stress are partly offset by the actual impacts on excess capital from downgrades in the prior 12 months. This assumption reflects the current market conditions in which the stress is being modelled 26
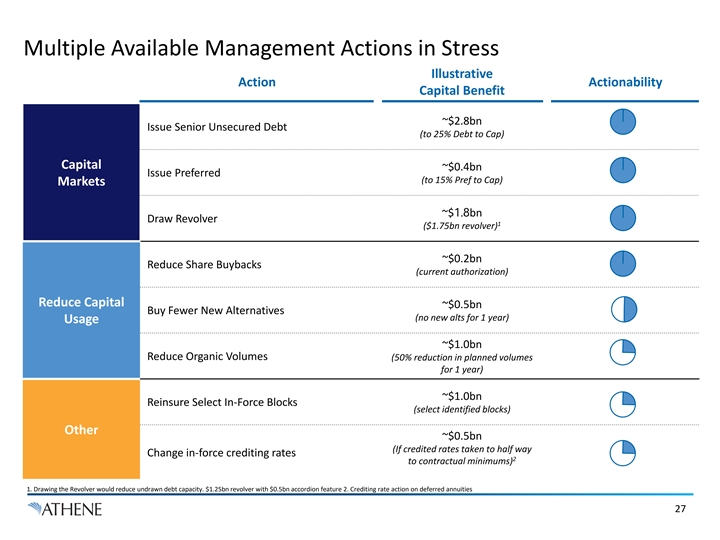
Multiple Available Management Actions in Stress Illustrative Action Actionability Capital Benefit ~$2.8bn Issue Senior Unsecured Debt (to 25% Debt to Cap) Capital ~$0.4bn Issue Preferred (to 15% Pref to Cap) Markets ~$1.8bn Draw Revolver 1 ($1.75bn revolver) ~$0.2bn Reduce Share Buybacks (current authorization) Reduce Capital ~$0.5bn Buy Fewer New Alternatives (no new alts for 1 year) Usage ~$1.0bn Reduce Organic Volumes (50% reduction in planned volumes for 1 year) ~$1.0bn Reinsure Select In-Force Blocks (select identified blocks) Other ~$0.5bn (If credited rates taken to half way Change in-force crediting rates 2 to contractual minimums) 1. Drawing the Revolver would reduce undrawn debt capacity. $1.25bn revolver with $0.5bn accordion feature 2. Crediting rate action on deferred annuities 27Multiple Available Management Actions in Stress Illustrative Action Actionability Capital Benefit ~$2.8bn Issue Senior Unsecured Debt (to 25% Debt to Cap) Capital ~$0.4bn Issue Preferred (to 15% Pref to Cap) Markets ~$1.8bn Draw Revolver 1 ($1.75bn revolver) ~$0.2bn Reduce Share Buybacks (current authorization) Reduce Capital ~$0.5bn Buy Fewer New Alternatives (no new alts for 1 year) Usage ~$1.0bn Reduce Organic Volumes (50% reduction in planned volumes for 1 year) ~$1.0bn Reinsure Select In-Force Blocks (select identified blocks) Other ~$0.5bn (If credited rates taken to half way Change in-force crediting rates 2 to contractual minimums) 1. Drawing the Revolver would reduce undrawn debt capacity. $1.25bn revolver with $0.5bn accordion feature 2. Crediting rate action on deferred annuities 27
Select Asset Class Deep Dives 28Select Asset Class Deep Dives 28
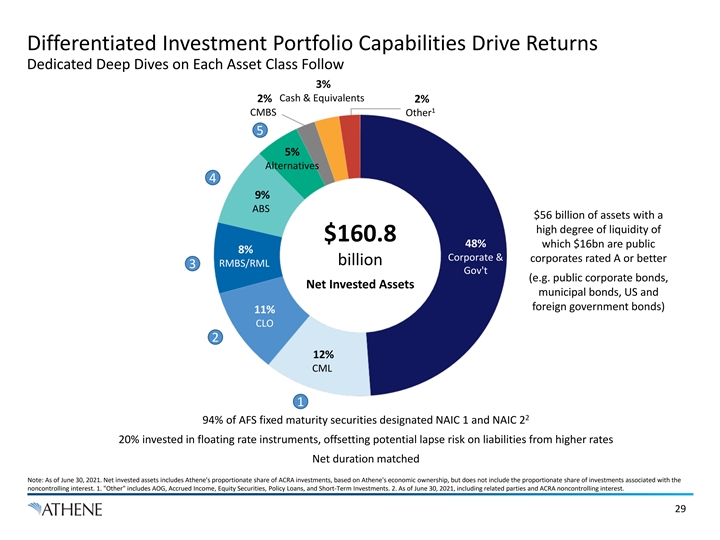
Differentiated Investment Portfolio Capabilities Drive Returns Dedicated Deep Dives on Each Asset Class Follow 3% Cash & Equivalents 2% 2% 1 CMBS Other 5 5% Alternatives 4 9% ABS $56 billion of assets with a high degree of liquidity of $160.8 48% which $16bn are public 8% Corporate & corporates rated A or better billion RMBS/RML 3 Gov't (e.g. public corporate bonds, Net Invested Assets municipal bonds, US and foreign government bonds) 11% CLO 2 12% CML 1 2 94% of AFS fixed maturity securities designated NAIC 1 and NAIC 2 20% invested in floating rate instruments, offsetting potential lapse risk on liabilities from higher rates Net duration matched Note: As of June 30, 2021. Net invested assets includes Athene's proportionate share of ACRA investments, based on Athene's economic ownership, but does not include the proportionate share of investments associated with the noncontrolling interest. 1. Other includes AOG, Accrued Income, Equity Securities, Policy Loans, and Short-Term Investments. 2. As of June 30, 2021, including related parties and ACRA noncontrolling interest. 29Differentiated Investment Portfolio Capabilities Drive Returns Dedicated Deep Dives on Each Asset Class Follow 3% Cash & Equivalents 2% 2% 1 CMBS Other 5 5% Alternatives 4 9% ABS $56 billion of assets with a high degree of liquidity of $160.8 48% which $16bn are public 8% Corporate & corporates rated A or better billion RMBS/RML 3 Gov't (e.g. public corporate bonds, Net Invested Assets municipal bonds, US and foreign government bonds) 11% CLO 2 12% CML 1 2 94% of AFS fixed maturity securities designated NAIC 1 and NAIC 2 20% invested in floating rate instruments, offsetting potential lapse risk on liabilities from higher rates Net duration matched Note: As of June 30, 2021. Net invested assets includes Athene's proportionate share of ACRA investments, based on Athene's economic ownership, but does not include the proportionate share of investments associated with the noncontrolling interest. 1. Other includes AOG, Accrued Income, Equity Securities, Policy Loans, and Short-Term Investments. 2. As of June 30, 2021, including related parties and ACRA noncontrolling interest. 29
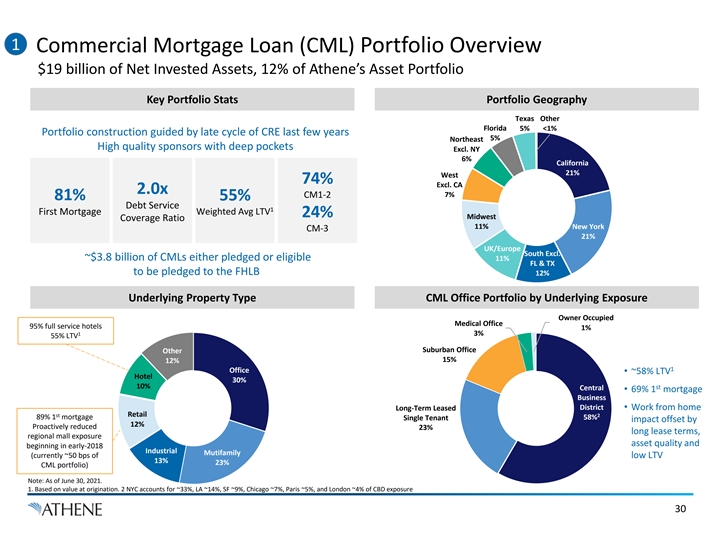
1 Commercial Mortgage Loan (CML) Portfolio Overview $19 billion of Net Invested Assets, 12% of Athene’s Asset Portfolio Key Portfolio Stats Portfolio Geography Texas Other Florida 5% <1% Portfolio construction guided by late cycle of CRE last few years 5% Northeast High quality sponsors with deep pockets Excl. NY 6% California 21% West 74% Excl. CA 2.0x 7% CM1-2 81% 55% Debt Service 1 First Mortgage Weighted Avg LTV 24% Midwest Coverage Ratio 11% New York CM-3 21% UK/Europe South Excl. ~$3.8 billion of CMLs either pledged or eligible 11% FL & TX to be pledged to the FHLB 12% Underlying Property Type CML Office Portfolio by Underlying Exposure Owner Occupied Medical Office 95% full service hotels 1% 1 3% 55% LTV Suburban Office Other 15% 12% 1 Office • ~58% LTV Hotel 30% 10% st Central • 69% 1 mortgage Business District • Work from home Long-Term Leased st Retail 2 89% 1 mortgage Single Tenant 58% impact offset by 12% Proactively reduced 23% long lease terms, regional mall exposure asset quality and beginning in early-2018 Industrial Mutifamily (currently ~50 bps of low LTV 13% 23% CML portfolio) Note: As of June 30, 2021. 1. Based on value at origination. 2 NYC accounts for ~33%, LA ~14%, SF ~9%, Chicago ~7%, Paris ~5%, and London ~4% of CBD exposure 301 Commercial Mortgage Loan (CML) Portfolio Overview $19 billion of Net Invested Assets, 12% of Athene’s Asset Portfolio Key Portfolio Stats Portfolio Geography Texas Other Florida 5% <1% Portfolio construction guided by late cycle of CRE last few years 5% Northeast High quality sponsors with deep pockets Excl. NY 6% California 21% West 74% Excl. CA 2.0x 7% CM1-2 81% 55% Debt Service 1 First Mortgage Weighted Avg LTV 24% Midwest Coverage Ratio 11% New York CM-3 21% UK/Europe South Excl. ~$3.8 billion of CMLs either pledged or eligible 11% FL & TX to be pledged to the FHLB 12% Underlying Property Type CML Office Portfolio by Underlying Exposure Owner Occupied Medical Office 95% full service hotels 1% 1 3% 55% LTV Suburban Office Other 15% 12% 1 Office • ~58% LTV Hotel 30% 10% st Central • 69% 1 mortgage Business District • Work from home Long-Term Leased st Retail 2 89% 1 mortgage Single Tenant 58% impact offset by 12% Proactively reduced 23% long lease terms, regional mall exposure asset quality and beginning in early-2018 Industrial Mutifamily (currently ~50 bps of low LTV 13% 23% CML portfolio) Note: As of June 30, 2021. 1. Based on value at origination. 2 NYC accounts for ~33%, LA ~14%, SF ~9%, Chicago ~7%, Paris ~5%, and London ~4% of CBD exposure 30
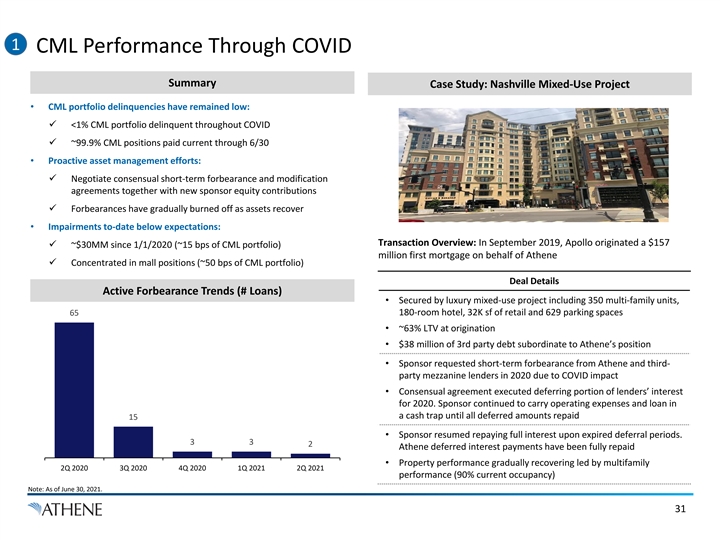
1 CML Performance Through COVID Summary Case Study: Nashville Mixed-Use Project • CML portfolio delinquencies have remained low: ü <1% CML portfolio delinquent throughout COVID ü ~99.9% CML positions paid current through 6/30 • Proactive asset management efforts: ü Negotiate consensual short-term forbearance and modification agreements together with new sponsor equity contributions ü Forbearances have gradually burned off as assets recover • Impairments to-date below expectations: Transaction Overview: In September 2019, Apollo originated a $157 ü ~$30MM since 1/1/2020 (~15 bps of CML portfolio) million first mortgage on behalf of Athene ü Concentrated in mall positions (~50 bps of CML portfolio) Deal Details Active Forbearance Trends (# Loans) • Secured by luxury mixed-use project including 350 multi-family units, 180-room hotel, 32K sf of retail and 629 parking spaces 65 • ~63% LTV at origination • $38 million of 3rd party debt subordinate to Athene’s position • Sponsor requested short-term forbearance from Athene and third- party mezzanine lenders in 2020 due to COVID impact • Consensual agreement executed deferring portion of lenders’ interest for 2020. Sponsor continued to carry operating expenses and loan in a cash trap until all deferred amounts repaid 15 • Sponsor resumed repaying full interest upon expired deferral periods. 3 3 2 Athene deferred interest payments have been fully repaid • Property performance gradually recovering led by multifamily 2Q 2020 3Q 2020 4Q 2020 1Q 2021 2Q 2021 performance (90% current occupancy) Note: As of June 30, 2021. 31
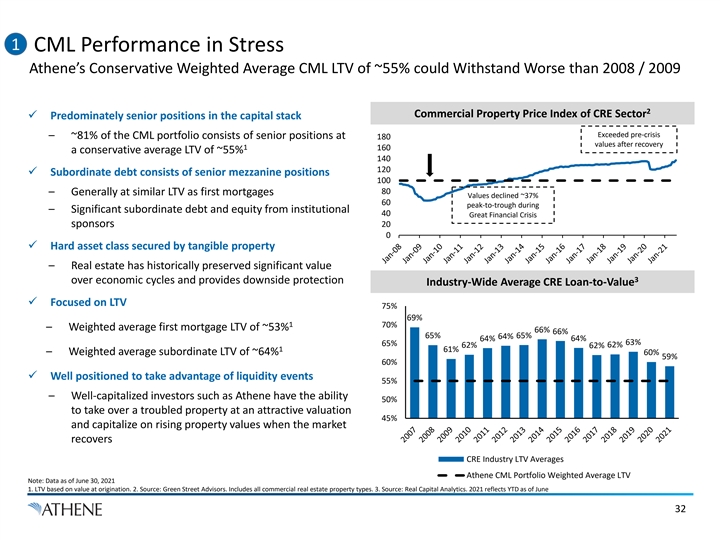
1 CML Performance in Stress Athene’s Conservative Weighted Average CML LTV of ~55% could Withstand Worse than 2008 / 2009 2 Commercial Property Price Index of CRE Sector ü Predominately senior positions in the capital stack Exceeded pre-crisis – ~81% of the CML portfolio consists of senior positions at 180 values after recovery 1 160 a conservative average LTV of ~55% 140 120 ü Subordinate debt consists of senior mezzanine positions 100 80 – Generally at similar LTV as first mortgages Values declined ~37% 60 peak-to-trough during – Significant subordinate debt and equity from institutional 40 Great Financial Crisis sponsors 20 0 ü Hard asset class secured by tangible property – Real estate has historically preserved significant value 3 over economic cycles and provides downside protection Industry-Wide Average CRE Loan-to-Value ü Focused on LTV 75% 69% 1 70% – Weighted average first mortgage LTV of ~53% 66% 66% 65% 65% 64% 64% 64% 63% 65% 62% 62% 62% 1 61% – Weighted average subordinate LTV of ~64% 60% 59% 60% ü Well positioned to take advantage of liquidity events 55% – Well-capitalized investors such as Athene have the ability 50% to take over a troubled property at an attractive valuation 45% and capitalize on rising property values when the market recovers CRE Industry LTV Averages Athene CML Portfolio Weighted Average LTV Note: Data as of June 30, 2021 1. LTV based on value at origination. 2. Source: Green Street Advisors. Includes all commercial real estate property types. 3. Source: Real Capital Analytics. 2021 reflects YTD as of June 321 CML Performance in Stress Athene’s Conservative Weighted Average CML LTV of ~55% could Withstand Worse than 2008 / 2009 2 Commercial Property Price Index of CRE Sector ü Predominately senior positions in the capital stack Exceeded pre-crisis – ~81% of the CML portfolio consists of senior positions at 180 values after recovery 1 160 a conservative average LTV of ~55% 140 120 ü Subordinate debt consists of senior mezzanine positions 100 80 – Generally at similar LTV as first mortgages Values declined ~37% 60 peak-to-trough during – Significant subordinate debt and equity from institutional 40 Great Financial Crisis sponsors 20 0 ü Hard asset class secured by tangible property – Real estate has historically preserved significant value 3 over economic cycles and provides downside protection Industry-Wide Average CRE Loan-to-Value ü Focused on LTV 75% 69% 1 70% – Weighted average first mortgage LTV of ~53% 66% 66% 65% 65% 64% 64% 64% 63% 65% 62% 62% 62% 1 61% – Weighted average subordinate LTV of ~64% 60% 59% 60% ü Well positioned to take advantage of liquidity events 55% – Well-capitalized investors such as Athene have the ability 50% to take over a troubled property at an attractive valuation 45% and capitalize on rising property values when the market recovers CRE Industry LTV Averages Athene CML Portfolio Weighted Average LTV Note: Data as of June 30, 2021 1. LTV based on value at origination. 2. Source: Green Street Advisors. Includes all commercial real estate property types. 3. Source: Real Capital Analytics. 2021 reflects YTD as of June 32
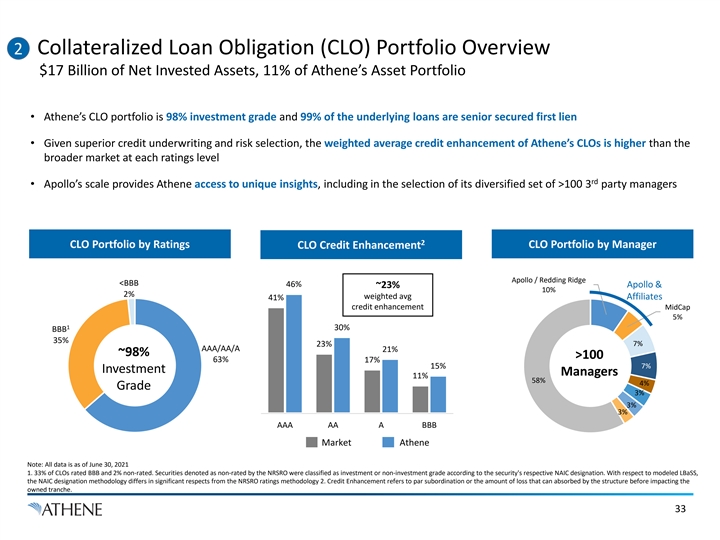
Collateralized Loan Obligation (CLO) Portfolio Overview 2 $17 Billion of Net Invested Assets, 11% of Athene’s Asset Portfolio • Athene’s CLO portfolio is 98% investment grade and 99% of the underlying loans are senior secured first lien • Given superior credit underwriting and risk selection, the weighted average credit enhancement of Athene’s CLOs is higher than the broader market at each ratings level rd • Apollo’s scale provides Athene access to unique insights, including in the selection of its diversified set of >100 3 party managers 2 CLO Portfolio by Ratings CLO Portfolio by Manager CLO Credit Enhancement Apollo / Redding Ridge <BBB 46% ~23% Apollo & 10% 2% weighted avg 41% Affiliates credit enhancement MidCap 5% 1 30% BBB 35% 7% 23% AAA/AA/A 21% ~98% >100 63% 17% 15% 7% Investment Managers 11% 58% 4% Grade 3% 3% 3% AAA AA A BBB Market Athene Note: All data is as of June 30, 2021 1. 33% of CLOs rated BBB and 2% non-rated. Securities denoted as non-rated by the NRSRO were classified as investment or non-investment grade according to the security's respective NAIC designation. With respect to modeled LBaSS, the NAIC designation methodology differs in significant respects from the NRSRO ratings methodology 2. Credit Enhancement refers to par subordination or the amount of loss that can absorbed by the structure before impacting the owned tranche. 33Collateralized Loan Obligation (CLO) Portfolio Overview 2 $17 Billion of Net Invested Assets, 11% of Athene’s Asset Portfolio • Athene’s CLO portfolio is 98% investment grade and 99% of the underlying loans are senior secured first lien • Given superior credit underwriting and risk selection, the weighted average credit enhancement of Athene’s CLOs is higher than the broader market at each ratings level rd • Apollo’s scale provides Athene access to unique insights, including in the selection of its diversified set of >100 3 party managers 2 CLO Portfolio by Ratings CLO Portfolio by Manager CLO Credit Enhancement Apollo / Redding Ridge <BBB 46% ~23% Apollo & 10% 2% weighted avg 41% Affiliates credit enhancement MidCap 5% 1 30% BBB 35% 7% 23% AAA/AA/A 21% ~98% >100 63% 17% 15% 7% Investment Managers 11% 58% 4% Grade 3% 3% 3% AAA AA A BBB Market Athene Note: All data is as of June 30, 2021 1. 33% of CLOs rated BBB and 2% non-rated. Securities denoted as non-rated by the NRSRO were classified as investment or non-investment grade according to the security's respective NAIC designation. With respect to modeled LBaSS, the NAIC designation methodology differs in significant respects from the NRSRO ratings methodology 2. Credit Enhancement refers to par subordination or the amount of loss that can absorbed by the structure before impacting the owned tranche. 33
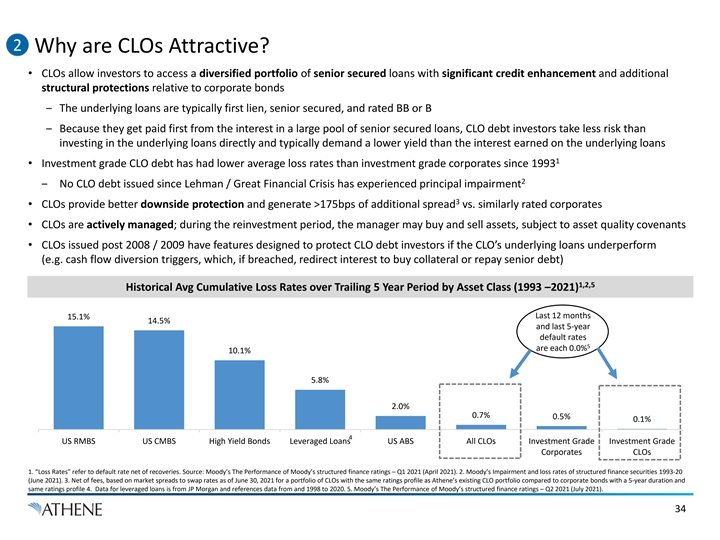
2 Why are CLOs Attractive? • CLOs allow investors to access a diversified portfolio of senior secured loans with significant credit enhancement and additional structural protections relative to corporate bonds ‒ The underlying loans are typically first lien, senior secured, and rated BB or B ‒ Because they get paid first from the interest in a large pool of senior secured loans, CLO debt investors take less risk than investing in the underlying loans directly and typically demand a lower yield than the interest earned on the underlying loans 1 • Investment grade CLO debt has had lower average loss rates than investment grade corporates since 1993 2 ‒ No CLO debt issued since Lehman / Great Financial Crisis has experienced principal impairment 3 • CLOs provide better downside protection and generate >175bps of additional spread vs. similarly rated corporates • CLOs are actively managed; during the reinvestment period, the manager may buy and sell assets, subject to asset quality covenants • CLOs issued post 2008 / 2009 have features designed to protect CLO debt investors if the CLO’s underlying loans underperform (e.g. cash flow diversion triggers, which, if breached, redirect interest to buy collateral or repay senior debt) 1,2,5 Historical Avg Cumulative Loss Rates over Trailing 5 Year Period by Asset Class (1993 –2021) Last 12 months 15.1% 14.5% and last 5-year default rates 5 are each 0.0% 10.1% 5.8% 2.0% 0.7% 0.5% 0.1% 4 US RMBS US CMBS High Yield Bonds Leveraged Loans US ABS All CLOs Investment Grade Investment Grade Corporates CLOs 1. “Loss Rates” refer to default rate net of recoveries. Source: Moody’s The Performance of Moody’s structured finance ratings – Q1 2021 (April 2021). 2. Moody’s Impairment and loss rates of structured finance securities 1993-20 (June 2021). 3. Net of fees, based on market spreads to swap rates as of June 30, 2021 for a portfolio of CLOs with the same ratings profile as Athene’s existing CLO portfolio compared to corporate bonds with a 5-year duration and same ratings profile 4. Data for leveraged loans is from JP Morgan and references data from and 1998 to 2020. 5. Moody’s The Performance of Moody’s structured finance ratings – Q2 2021 (July 2021). 342 Why are CLOs Attractive? • CLOs allow investors to access a diversified portfolio of senior secured loans with significant credit enhancement and additional structural protections relative to corporate bonds ‒ The underlying loans are typically first lien, senior secured, and rated BB or B ‒ Because they get paid first from the interest in a large pool of senior secured loans, CLO debt investors take less risk than investing in the underlying loans directly and typically demand a lower yield than the interest earned on the underlying loans 1 • Investment grade CLO debt has had lower average loss rates than investment grade corporates since 1993 2 ‒ No CLO debt issued since Lehman / Great Financial Crisis has experienced principal impairment 3 • CLOs provide better downside protection and generate >175bps of additional spread vs. similarly rated corporates • CLOs are actively managed; during the reinvestment period, the manager may buy and sell assets, subject to asset quality covenants • CLOs issued post 2008 / 2009 have features designed to protect CLO debt investors if the CLO’s underlying loans underperform (e.g. cash flow diversion triggers, which, if breached, redirect interest to buy collateral or repay senior debt) 1,2,5 Historical Avg Cumulative Loss Rates over Trailing 5 Year Period by Asset Class (1993 –2021) Last 12 months 15.1% 14.5% and last 5-year default rates 5 are each 0.0% 10.1% 5.8% 2.0% 0.7% 0.5% 0.1% 4 US RMBS US CMBS High Yield Bonds Leveraged Loans US ABS All CLOs Investment Grade Investment Grade Corporates CLOs 1. “Loss Rates” refer to default rate net of recoveries. Source: Moody’s The Performance of Moody’s structured finance ratings – Q1 2021 (April 2021). 2. Moody’s Impairment and loss rates of structured finance securities 1993-20 (June 2021). 3. Net of fees, based on market spreads to swap rates as of June 30, 2021 for a portfolio of CLOs with the same ratings profile as Athene’s existing CLO portfolio compared to corporate bonds with a 5-year duration and same ratings profile 4. Data for leveraged loans is from JP Morgan and references data from and 1998 to 2020. 5. Moody’s The Performance of Moody’s structured finance ratings – Q2 2021 (July 2021). 34
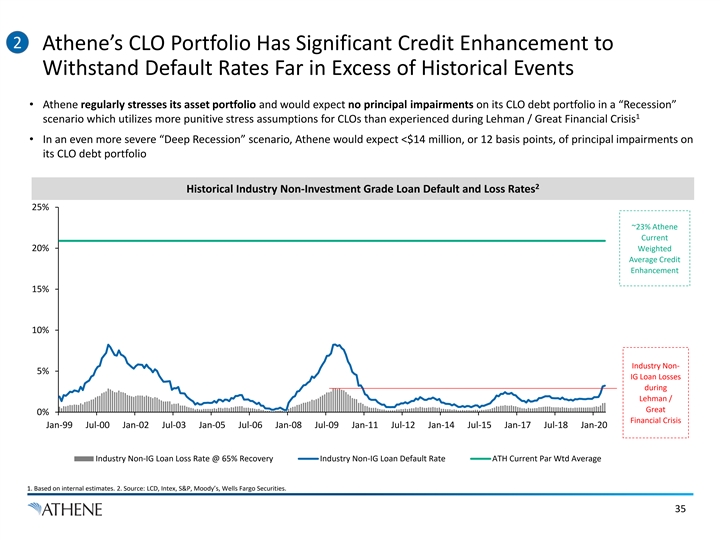
2 Athene’s CLO Portfolio Has Significant Credit Enhancement to Withstand Default Rates Far in Excess of Historical Events • Athene regularly stresses its asset portfolio and would expect no principal impairments on its CLO debt portfolio in a “Recession” 1 scenario which utilizes more punitive stress assumptions for CLOs than experienced during Lehman / Great Financial Crisis • In an even more severe “Deep Recession” scenario, Athene would expect <$14 million, or 12 basis points, of principal impairments on its CLO debt portfolio 2 Historical Industry Non-Investment Grade Loan Default and Loss Rates 25% ~23% Athene Current 20% Weighted Average Credit Enhancement 15% 10% Industry Non- 5% IG Loan Losses during Lehman / Great 0% Financial Crisis Jan-99 Jul-00 Jan-02 Jul-03 Jan-05 Jul-06 Jan-08 Jul-09 Jan-11 Jul-12 Jan-14 Jul-15 Jan-17 Jul-18 Jan-20 Industry Non-IG Loan Loss Rate @ 65% Recovery Industry Non-IG Loan Default Rate ATH Current Par Wtd Average 1. Based on internal estimates. 2. Source: LCD, Intex, S&P, Moody’s, Wells Fargo Securities. 352 Athene’s CLO Portfolio Has Significant Credit Enhancement to Withstand Default Rates Far in Excess of Historical Events • Athene regularly stresses its asset portfolio and would expect no principal impairments on its CLO debt portfolio in a “Recession” 1 scenario which utilizes more punitive stress assumptions for CLOs than experienced during Lehman / Great Financial Crisis • In an even more severe “Deep Recession” scenario, Athene would expect <$14 million, or 12 basis points, of principal impairments on its CLO debt portfolio 2 Historical Industry Non-Investment Grade Loan Default and Loss Rates 25% ~23% Athene Current 20% Weighted Average Credit Enhancement 15% 10% Industry Non- 5% IG Loan Losses during Lehman / Great 0% Financial Crisis Jan-99 Jul-00 Jan-02 Jul-03 Jan-05 Jul-06 Jan-08 Jul-09 Jan-11 Jul-12 Jan-14 Jul-15 Jan-17 Jul-18 Jan-20 Industry Non-IG Loan Loss Rate @ 65% Recovery Industry Non-IG Loan Default Rate ATH Current Par Wtd Average 1. Based on internal estimates. 2. Source: LCD, Intex, S&P, Moody’s, Wells Fargo Securities. 35
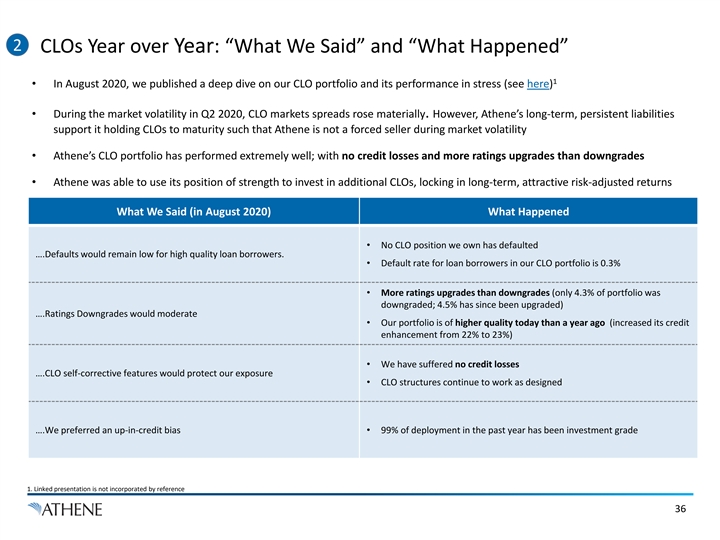
2 CLOs Year over Year: “What We Said” and “What Happened” 1 • In August 2020, we published a deep dive on our CLO portfolio and its performance in stress (see here) • During the market volatility in Q2 2020, CLO markets spreads rose materially. However, Athene’s long-term, persistent liabilities support it holding CLOs to maturity such that Athene is not a forced seller during market volatility • Athene’s CLO portfolio has performed extremely well; with no credit losses and more ratings upgrades than downgrades • Athene was able to use its position of strength to invest in additional CLOs, locking in long-term, attractive risk-adjusted returns What We Said (in August 2020) What Happened • No CLO position we own has defaulted ….Defaults would remain low for high quality loan borrowers. • Default rate for loan borrowers in our CLO portfolio is 0.3% • More ratings upgrades than downgrades (only 4.3% of portfolio was downgraded; 4.5% has since been upgraded) ….Ratings Downgrades would moderate • Our portfolio is of higher quality today than a year ago (increased its credit enhancement from 22% to 23%) • We have suffered no credit losses ….CLO self-corrective features would protect our exposure • CLO structures continue to work as designed ….We preferred an up-in-credit bias • 99% of deployment in the past year has been investment grade 1. Linked presentation is not incorporated by reference 362 CLOs Year over Year: “What We Said” and “What Happened” 1 • In August 2020, we published a deep dive on our CLO portfolio and its performance in stress (see here) • During the market volatility in Q2 2020, CLO markets spreads rose materially. However, Athene’s long-term, persistent liabilities support it holding CLOs to maturity such that Athene is not a forced seller during market volatility • Athene’s CLO portfolio has performed extremely well; with no credit losses and more ratings upgrades than downgrades • Athene was able to use its position of strength to invest in additional CLOs, locking in long-term, attractive risk-adjusted returns What We Said (in August 2020) What Happened • No CLO position we own has defaulted ….Defaults would remain low for high quality loan borrowers. • Default rate for loan borrowers in our CLO portfolio is 0.3% • More ratings upgrades than downgrades (only 4.3% of portfolio was downgraded; 4.5% has since been upgraded) ….Ratings Downgrades would moderate • Our portfolio is of higher quality today than a year ago (increased its credit enhancement from 22% to 23%) • We have suffered no credit losses ….CLO self-corrective features would protect our exposure • CLO structures continue to work as designed ….We preferred an up-in-credit bias • 99% of deployment in the past year has been investment grade 1. Linked presentation is not incorporated by reference 36

2 CLO Portfolio: Well Diversified Underlying Assets Top Industry Exposures Underlying Athene’s CLO Portfolio 2Q 2020 2Q 2021 2Q 2021 No. Name Portfolio Portfolio Cumulative Healthcare & Pharmaceuticals 1 13% 12% 12% ü Resilient top High Tech 2 10% 10% 23% exposures, with Services: Business 3 8% 7% 30% consistent diversity 4 Banking, Finance, Insurance & Real Estate 8% 9% 39% year over year Hotels, Gaming & Leisure 5 5% 4% 43% Media: Broadcasting & Subscription 6 4% 5% 48% Beverage, Food & Tobacco 7 4% 4% 52% 8 Telecommunications 4% 4% 56% 9 Chemicals, Plastics & Rubber 4% 4% 59% ü Diversified Portfolio: 10 Capital Equipment 3% 3% 63% 11 Containers, Packaging & Glass 3% 3% 66% Top 10 industries = 12 Retail 3% 2% 68% ~60% of portfolio 13 Automotive 3% 3% 71% 14 Services: Consumer 3% 3% 74% 15 Construction & Building 3% 3% 77% 16 Aerospace & Defense 3% 3% 80% ü Actively managed 17 Consumer Goods: Non-Durable 2% 2% 82% portfolio to deemphasize 18 Utilities: Electric 2% 2% 84% 19 Energy: Oil & Gas 2% 2% 86% energy, retail, and 20 Consumer Goods: Durable 2% 2% 88% consumer goods Note: As of June 30, 2021. Based on CLOs included in Athene’s net invested assets 372 CLO Portfolio: Well Diversified Underlying Assets Top Industry Exposures Underlying Athene’s CLO Portfolio 2Q 2020 2Q 2021 2Q 2021 No. Name Portfolio Portfolio Cumulative Healthcare & Pharmaceuticals 1 13% 12% 12% ü Resilient top High Tech 2 10% 10% 23% exposures, with Services: Business 3 8% 7% 30% consistent diversity 4 Banking, Finance, Insurance & Real Estate 8% 9% 39% year over year Hotels, Gaming & Leisure 5 5% 4% 43% Media: Broadcasting & Subscription 6 4% 5% 48% Beverage, Food & Tobacco 7 4% 4% 52% 8 Telecommunications 4% 4% 56% 9 Chemicals, Plastics & Rubber 4% 4% 59% ü Diversified Portfolio: 10 Capital Equipment 3% 3% 63% 11 Containers, Packaging & Glass 3% 3% 66% Top 10 industries = 12 Retail 3% 2% 68% ~60% of portfolio 13 Automotive 3% 3% 71% 14 Services: Consumer 3% 3% 74% 15 Construction & Building 3% 3% 77% 16 Aerospace & Defense 3% 3% 80% ü Actively managed 17 Consumer Goods: Non-Durable 2% 2% 82% portfolio to deemphasize 18 Utilities: Electric 2% 2% 84% 19 Energy: Oil & Gas 2% 2% 86% energy, retail, and 20 Consumer Goods: Durable 2% 2% 88% consumer goods Note: As of June 30, 2021. Based on CLOs included in Athene’s net invested assets 37
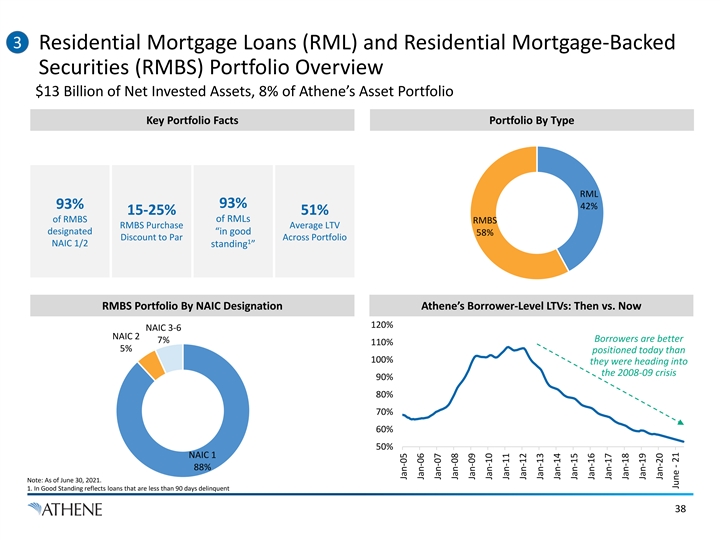
3 Residential Mortgage Loans (RML) and Residential Mortgage-Backed Securities (RMBS) Portfolio Overview $13 Billion of Net Invested Assets, 8% of Athene’s Asset Portfolio Key Portfolio Facts Portfolio By Type RML 93% 93% 42% 15-25% 51% of RMBS of RMLs RMBS RMBS Purchase Average LTV designated “in good 58% Discount to Par Across Portfolio 1 NAIC 1/2 standing ” RMBS Portfolio By NAIC Designation Athene’s Borrower-Level LTVs: Then vs. Now 120% NAIC 3-6 NAIC 2 Borrowers are better 7% 110% 5% positioned today than 100% they were heading into the 2008-09 crisis 90% 80% 70% 60% 50% NAIC 1 88% Note: As of June 30, 2021. 1. In Good Standing reflects loans that are less than 90 days delinquent 38 Jan-05 Jan-06 Jan-07 Jan-08 Jan-09 Jan-10 Jan-11 Jan-12 Jan-13 Jan-14 Jan-15 Jan-16 Jan-17 Jan-18 Jan-19 Jan-20 June - 21 Jan-213 Residential Mortgage Loans (RML) and Residential Mortgage-Backed Securities (RMBS) Portfolio Overview $13 Billion of Net Invested Assets, 8% of Athene’s Asset Portfolio Key Portfolio Facts Portfolio By Type RML 93% 93% 42% 15-25% 51% of RMBS of RMLs RMBS RMBS Purchase Average LTV designated “in good 58% Discount to Par Across Portfolio 1 NAIC 1/2 standing ” RMBS Portfolio By NAIC Designation Athene’s Borrower-Level LTVs: Then vs. Now 120% NAIC 3-6 NAIC 2 Borrowers are better 7% 110% 5% positioned today than 100% they were heading into the 2008-09 crisis 90% 80% 70% 60% 50% NAIC 1 88% Note: As of June 30, 2021. 1. In Good Standing reflects loans that are less than 90 days delinquent 38 Jan-05 Jan-06 Jan-07 Jan-08 Jan-09 Jan-10 Jan-11 Jan-12 Jan-13 Jan-14 Jan-15 Jan-16 Jan-17 Jan-18 Jan-19 Jan-20 June - 21 Jan-21
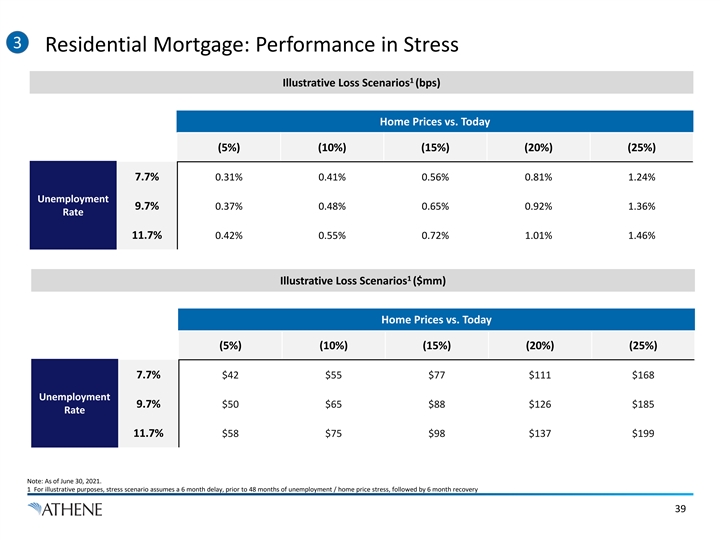
3 Residential Mortgage: Performance in Stress 1 Illustrative Loss Scenarios (bps) Home Prices vs. Today (5%) (10%) (15%) (20%) (25%) 7.7% 0.31% 0.41% 0.56% 0.81% 1.24% Unemployment 9.7% 0.37% 0.48% 0.65% 0.92% 1.36% Rate 11.7% 0.42% 0.55% 0.72% 1.01% 1.46% 1 Illustrative Loss Scenarios ($mm) Home Prices vs. Today (5%) (10%) (15%) (20%) (25%) 7.7% $42 $55 $77 $111 $168 Unemployment 9.7% $50 $65 $88 $126 $185 Rate 11.7% $58 $75 $98 $137 $199 Note: As of June 30, 2021. 1 For illustrative purposes, stress scenario assumes a 6 month delay, prior to 48 months of unemployment / home price stress, followed by 6 month recovery 393 Residential Mortgage: Performance in Stress 1 Illustrative Loss Scenarios (bps) Home Prices vs. Today (5%) (10%) (15%) (20%) (25%) 7.7% 0.31% 0.41% 0.56% 0.81% 1.24% Unemployment 9.7% 0.37% 0.48% 0.65% 0.92% 1.36% Rate 11.7% 0.42% 0.55% 0.72% 1.01% 1.46% 1 Illustrative Loss Scenarios ($mm) Home Prices vs. Today (5%) (10%) (15%) (20%) (25%) 7.7% $42 $55 $77 $111 $168 Unemployment 9.7% $50 $65 $88 $126 $185 Rate 11.7% $58 $75 $98 $137 $199 Note: As of June 30, 2021. 1 For illustrative purposes, stress scenario assumes a 6 month delay, prior to 48 months of unemployment / home price stress, followed by 6 month recovery 39
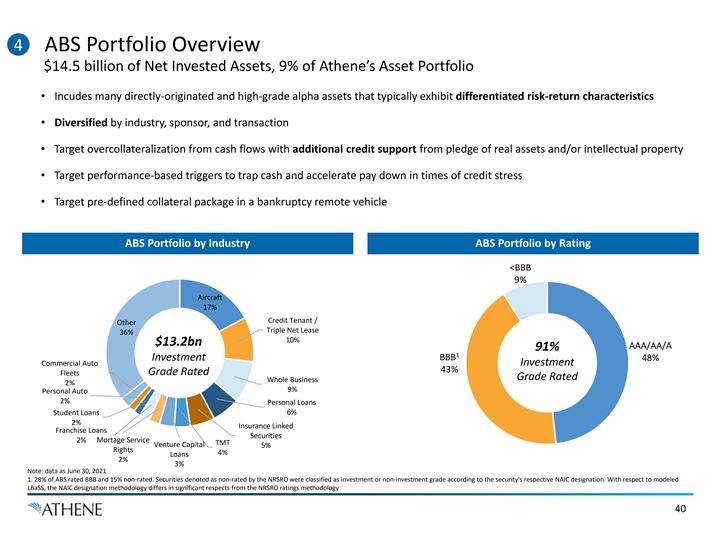
4 ABS Portfolio Overview $14.5 billion of Net Invested Assets, 9% of Athene’s Asset Portfolio • Incudes many directly-originated and high-grade alpha assets that typically exhibit differentiated risk-return characteristics • Diversified by industry, sponsor, and transaction • Target overcollateralization from cash flows with additional credit support from pledge of real assets and/or intellectual property • Target performance-based triggers to trap cash and accelerate pay down in times of credit stress • Target pre-defined collateral package in a bankruptcy remote vehicle ABS Portfolio by Industry ABS Portfolio by Rating <BBB 9% Aircraft 17% Credit Tenant / Other Triple Net Lease 36% 10% $13.2bn AAA/AA/A 91% 1 BBB Investment 48% Commercial Auto Investment 43% Grade Rated Fleets Grade Rated Whole Business 2% 9% Personal Auto 2% Personal Loans Student Loans 6% 2% Insurance Linked Franchise Loans Securities 2% Mortage Service TMT Venture Capital 5% Rights 4% Loans 2% 3% Note: data as June 30, 2021 1. 28% of ABS rated BBB and 15% non-rated. Securities denoted as non-rated by the NRSRO were classified as investment or non-investment grade according to the security's respective NAIC designation. With respect to modeled LBaSS, the NAIC designation methodology differs in significant respects from the NRSRO ratings methodology 40

4 ABS Case Study: P.K. AirFinance • In December 2019, Athene acquired the PK AirFinance $3.2bn portfolio of aircraft loans from General Electric (“GE”) – Transaction also provided Athene a forward flow of attractive assets with superior spread (+100bps) and loss track record (10bps avg. annual losses for past 20 years) vs. liquid investment grade CUSIPs • Instead of holding the loans directly, Athene utilized a CLO structure to enhance credit protection and liquidity • Only $9 million or 30bps of realized losses since the beginning of COVID, the most severe and prolonged stress in the aircraft market Loan-to-Value ~300 Loans Secured by Aircraft ($3.2bn) Underlying Aircraft ($5.8bn) CLO Securitization 1 vs. Aircraft Class A Loan Secured by Aircraft rd 2,3 3 Party Banks Lenders $2.6bn 37% L +1.25% Tranche Rated ‘BBB+’ $552mm Loan Secured by Aircraft 46% ~3% Tranche Rated ‘BBB-’ $458mm 54% ~3.8% Loan Secured by Aircraft Tranche Rated ‘BB-’ $344mm 58% ~4.7% Loan Secured by Aircraft Tranche Rated ‘B-’ $147mm 59% ~5.6% 65% Second Loss: Athene Equity $368mm Loan Secured by Aircraft Athene owns $1.8bn of First Loss Equity rated debt and $0.4bn 30 obligors across Third-Party Aircraft Owners of equity, with 35% of Loan Secured by Aircraft 90 Countries $2.2B asset impairment required before loss 1. Aircraft value and associated LTV based on third-party appraised values as of March 2021. Blended LTV is shown for indicative purposes; not all loans are cross-collateralized. 2. The capital structure includes a USD CLO and Euro CLO. For illustrative purposes, we show the USD CLO and Euro CLO together on a fully-funded basis. Individual tranche ratings reflective of USD denominated tranches. 3. Athene owns approximately $0.4bn class A. 414 ABS Case Study: P.K. AirFinance • In December 2019, Athene acquired the PK AirFinance $3.2bn portfolio of aircraft loans from General Electric (“GE”) – Transaction also provided Athene a forward flow of attractive assets with superior spread (+100bps) and loss track record (10bps avg. annual losses for past 20 years) vs. liquid investment grade CUSIPs • Instead of holding the loans directly, Athene utilized a CLO structure to enhance credit protection and liquidity • Only $9 million or 30bps of realized losses since the beginning of COVID, the most severe and prolonged stress in the aircraft market Loan-to-Value ~300 Loans Secured by Aircraft ($3.2bn) Underlying Aircraft ($5.8bn) CLO Securitization 1 vs. Aircraft Class A Loan Secured by Aircraft rd 2,3 3 Party Banks Lenders $2.6bn 37% L +1.25% Tranche Rated ‘BBB+’ $552mm Loan Secured by Aircraft 46% ~3% Tranche Rated ‘BBB-’ $458mm 54% ~3.8% Loan Secured by Aircraft Tranche Rated ‘BB-’ $344mm 58% ~4.7% Loan Secured by Aircraft Tranche Rated ‘B-’ $147mm 59% ~5.6% 65% Second Loss: Athene Equity $368mm Loan Secured by Aircraft Athene owns $1.8bn of First Loss Equity rated debt and $0.4bn 30 obligors across Third-Party Aircraft Owners of equity, with 35% of Loan Secured by Aircraft 90 Countries $2.2B asset impairment required before loss 1. Aircraft value and associated LTV based on third-party appraised values as of March 2021. Blended LTV is shown for indicative purposes; not all loans are cross-collateralized. 2. The capital structure includes a USD CLO and Euro CLO. For illustrative purposes, we show the USD CLO and Euro CLO together on a fully-funded basis. Individual tranche ratings reflective of USD denominated tranches. 3. Athene owns approximately $0.4bn class A. 41

4 ABS Case Study Continued: PK Air vs. Aircraft Leasing • PK AirFinance is a lender to airlines and lessors who utilize this financing to buy aircraft outright • Traditional aircraft ABS are utilized by lessors who are in the business of directly acquiring physical aircraft, leasing those aircraft out to airlines and taking repossession at lease maturity • Despite similar underlying collateral (commercial aircraft), there are important fundamental differences 1 PK AirFinance Aircraft Leasing Underlying Business Direct Lending Operating Leases Senior secured loans Equity ownership of physical assets Seniority Cross-collateralization with other aircraft Little to no cross-collateralization Typical Gross Yields 5-7% Coupon 12-20% Lease Yields Loan advance rate ranges from 50-70% Lease is 100% LTV with typical 70-80% ABS Loan-To-Value Mid-50% on blended basis across PK portfolio attachment point 5-8 year amortizing loans with Duration Full life of the aircraft – up to 20+ years contractual maturity Typical Exit Path Cash repayment Residual monetization or remarketing 75-85% of global lease fleet requesting to defer COVID-related Delinquencies ~9-10% currently past due lease payments for 3-plus months Full interest continues, excess collateral Full deferral of all payments typically for Typical Amendments pledged and/or other protection / cash flow 3-6 months 1. Represents the views and opinions of Apollo Analysts. 424 ABS Case Study Continued: PK Air vs. Aircraft Leasing • PK AirFinance is a lender to airlines and lessors who utilize this financing to buy aircraft outright • Traditional aircraft ABS are utilized by lessors who are in the business of directly acquiring physical aircraft, leasing those aircraft out to airlines and taking repossession at lease maturity • Despite similar underlying collateral (commercial aircraft), there are important fundamental differences 1 PK AirFinance Aircraft Leasing Underlying Business Direct Lending Operating Leases Senior secured loans Equity ownership of physical assets Seniority Cross-collateralization with other aircraft Little to no cross-collateralization Typical Gross Yields 5-7% Coupon 12-20% Lease Yields Loan advance rate ranges from 50-70% Lease is 100% LTV with typical 70-80% ABS Loan-To-Value Mid-50% on blended basis across PK portfolio attachment point 5-8 year amortizing loans with Duration Full life of the aircraft – up to 20+ years contractual maturity Typical Exit Path Cash repayment Residual monetization or remarketing 75-85% of global lease fleet requesting to defer COVID-related Delinquencies ~9-10% currently past due lease payments for 3-plus months Full interest continues, excess collateral Full deferral of all payments typically for Typical Amendments pledged and/or other protection / cash flow 3-6 months 1. Represents the views and opinions of Apollo Analysts. 42
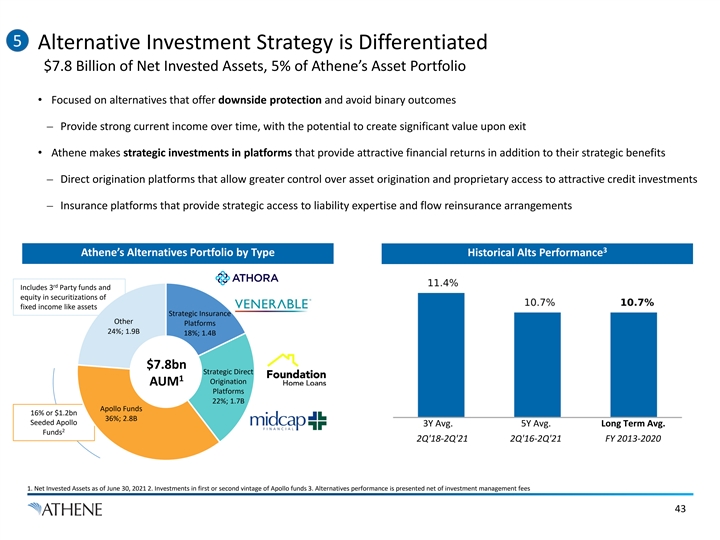
5 Alternative Investment Strategy is Differentiated $7.8 Billion of Net Invested Assets, 5% of Athene’s Asset Portfolio • Focused on alternatives that offer downside protection and avoid binary outcomes – Provide strong current income over time, with the potential to create significant value upon exit • Athene makes strategic investments in platforms that provide attractive financial returns in addition to their strategic benefits – Direct origination platforms that allow greater control over asset origination and proprietary access to attractive credit investments – Insurance platforms that provide strategic access to liability expertise and flow reinsurance arrangements 3 Athene’s Alternatives Portfolio by Type Historical Alts Performance rd Includes 3 Party funds and equity in securitizations of fixed income like assets Strategic Insurance Other Platforms 24%; 1.9B 18%; 1.4B $7.8bn Strategic Direct 1 Origination AUM Platforms 22%; 1.7B Apollo Funds 16% or $1.2bn 36%; 2.8B Seeded Apollo 3Y Avg. 5Y Avg. Long Term Avg. 2 Funds 2Q'18-2Q'21 2Q'16-2Q'21 FY 2013-2020 1. Net Invested Assets as of June 30, 2021 2. Investments in first or second vintage of Apollo funds 3. Alternatives performance is presented net of investment management fees 435 Alternative Investment Strategy is Differentiated $7.8 Billion of Net Invested Assets, 5% of Athene’s Asset Portfolio • Focused on alternatives that offer downside protection and avoid binary outcomes – Provide strong current income over time, with the potential to create significant value upon exit • Athene makes strategic investments in platforms that provide attractive financial returns in addition to their strategic benefits – Direct origination platforms that allow greater control over asset origination and proprietary access to attractive credit investments – Insurance platforms that provide strategic access to liability expertise and flow reinsurance arrangements 3 Athene’s Alternatives Portfolio by Type Historical Alts Performance rd Includes 3 Party funds and equity in securitizations of fixed income like assets Strategic Insurance Other Platforms 24%; 1.9B 18%; 1.4B $7.8bn Strategic Direct 1 Origination AUM Platforms 22%; 1.7B Apollo Funds 16% or $1.2bn 36%; 2.8B Seeded Apollo 3Y Avg. 5Y Avg. Long Term Avg. 2 Funds 2Q'18-2Q'21 2Q'16-2Q'21 FY 2013-2020 1. Net Invested Assets as of June 30, 2021 2. Investments in first or second vintage of Apollo funds 3. Alternatives performance is presented net of investment management fees 43
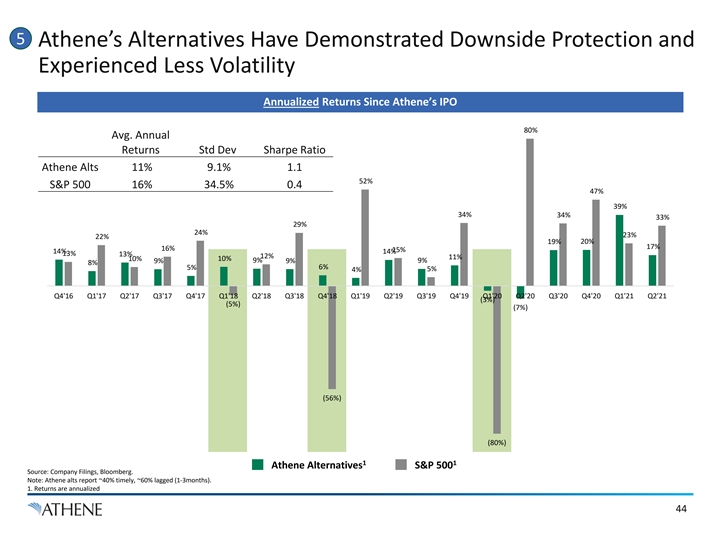
5 Athene’s Alternatives Have Demonstrated Downside Protection and Experienced Less Volatility Annualized Returns Since Athene’s IPO 80% Avg. Annual Returns Std Dev Sharpe Ratio Athene Alts 11% 9.1% 1.1 52% S&P 500 16% 34.5% 0.4 47% 39% 34% 34% 33% 29% 24% 23% 22% 19% 20% 17% 16% 15% 14% 14% 13% 13% 12% 11% 10% 10% 9% 9% 9% 9% 8% 6% 5% 5% 4% Q4'16 Q1'17 Q2'17 Q3'17 Q4'17 Q1'18 Q2'18 Q3'18 Q4'18 Q1'19 Q2'19 Q3'19 Q4'19 Q1'20 Q2'20 Q3'20 Q4'20 Q1'21 Q2'21 (3%) (5%) (7%) (56%) (80%) 1 1 Athene Alternatives S&P 500 Source: Company Filings, Bloomberg. Note: Athene alts report ~40% timely, ~60% lagged (1-3months). 1. Returns are annualized 445 Athene’s Alternatives Have Demonstrated Downside Protection and Experienced Less Volatility Annualized Returns Since Athene’s IPO 80% Avg. Annual Returns Std Dev Sharpe Ratio Athene Alts 11% 9.1% 1.1 52% S&P 500 16% 34.5% 0.4 47% 39% 34% 34% 33% 29% 24% 23% 22% 19% 20% 17% 16% 15% 14% 14% 13% 13% 12% 11% 10% 10% 9% 9% 9% 9% 8% 6% 5% 5% 4% Q4'16 Q1'17 Q2'17 Q3'17 Q4'17 Q1'18 Q2'18 Q3'18 Q4'18 Q1'19 Q2'19 Q3'19 Q4'19 Q1'20 Q2'20 Q3'20 Q4'20 Q1'21 Q2'21 (3%) (5%) (7%) (56%) (80%) 1 1 Athene Alternatives S&P 500 Source: Company Filings, Bloomberg. Note: Athene alts report ~40% timely, ~60% lagged (1-3months). 1. Returns are annualized 44
Athene is Well Positioned To Go On The Offense in the Next Dislocation • Athene is extremely well capitalized with $4.0bn of excess equity capital and ample access to liquidity • Capture asset outperformance through illiquidity premia appropriate for long-dated, predictable liabilities o Does not seek yield by taking incremental credit risk (94% of AFS fixed income securities are NAIC 1 or 2) o Directly originate senior secured assets that earn 100 to 200bps premia over equivalent liquid corporates • During COVID, portfolio outperformed peers and excess capital meant Athene could go on the offense 1 o In 2020, Athene had only 12bps of impairments vs. 15bps for peers o Deployed $46bn into high-quality assets at attractive risk-adjusted returns in 2020 • Maintain multiple layers of risk oversight, actively manage the portfolio, and perform regular stress tests • Impact of a modelled ‘recession’ muted by one year’s earnings, even without intervening management actions • Committed to transparency, publishing annual stress tests 1. Peer U.S. statutory impairments per SNL Financial; average includes AEL, AIG, AMP, BHF, EQH, FG, LNC, MET, PFG, PRU, VOYA and Transamerica. For Athene, U.S. statutory data adjusted to include impairments and assets in Bermuda 45Athene is Well Positioned To Go On The Offense in the Next Dislocation • Athene is extremely well capitalized with $4.0bn of excess equity capital and ample access to liquidity • Capture asset outperformance through illiquidity premia appropriate for long-dated, predictable liabilities o Does not seek yield by taking incremental credit risk (94% of AFS fixed income securities are NAIC 1 or 2) o Directly originate senior secured assets that earn 100 to 200bps premia over equivalent liquid corporates • During COVID, portfolio outperformed peers and excess capital meant Athene could go on the offense 1 o In 2020, Athene had only 12bps of impairments vs. 15bps for peers o Deployed $46bn into high-quality assets at attractive risk-adjusted returns in 2020 • Maintain multiple layers of risk oversight, actively manage the portfolio, and perform regular stress tests • Impact of a modelled ‘recession’ muted by one year’s earnings, even without intervening management actions • Committed to transparency, publishing annual stress tests 1. Peer U.S. statutory impairments per SNL Financial; average includes AEL, AIG, AMP, BHF, EQH, FG, LNC, MET, PFG, PRU, VOYA and Transamerica. For Athene, U.S. statutory data adjusted to include impairments and assets in Bermuda 45
Appendix: Additional Disclosure & Non-GAAP Reconciliations 46Appendix: Additional Disclosure & Non-GAAP Reconciliations 46
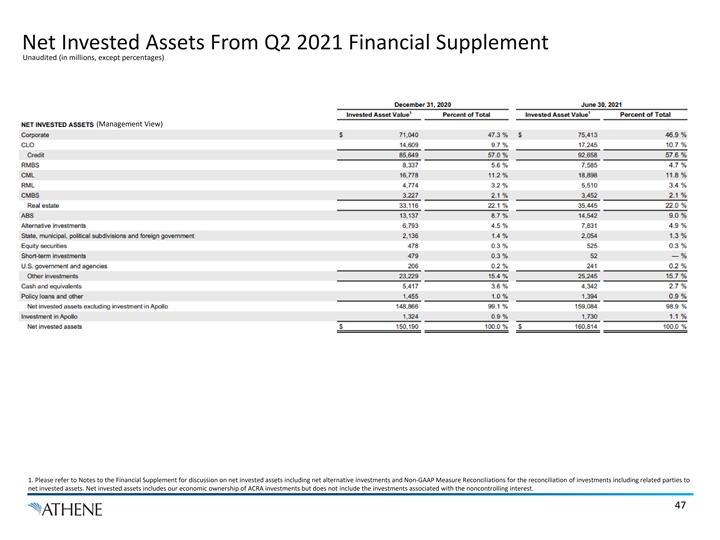
Net Invested Assets From Q2 2021 Financial Supplement Unaudited (in millions, except percentages) (Management View) 1. Please refer to Notes to the Financial Supplement for discussion on net invested assets including net alternative investments and Non-GAAP Measure Reconciliations for the reconciliation of investments including related parties to net invested assets. Net invested assets includes our economic ownership of ACRA investments but does not include the investments associated with the noncontrolling interest. 47
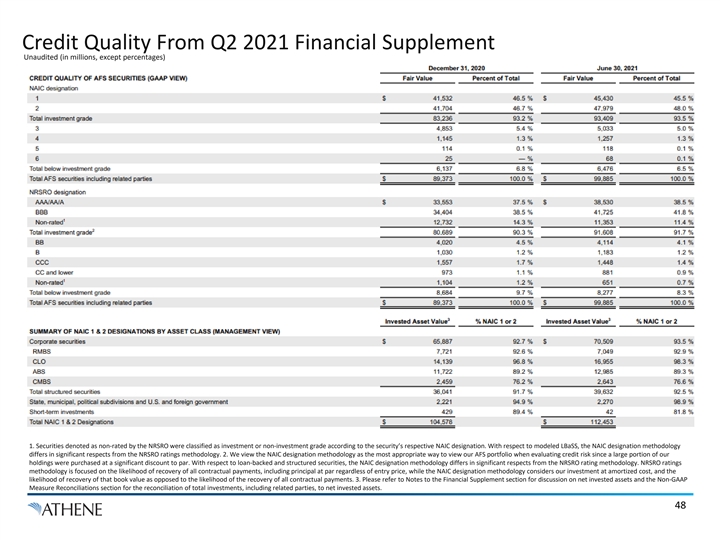
Credit Quality From Q2 2021 Financial Supplement Unaudited (in millions, except percentages) 1. Securities denoted as non-rated by the NRSRO were classified as investment or non-investment grade according to the security’s respective NAIC designation. With respect to modeled LBaSS, the NAIC designation methodology differs in significant respects from the NRSRO ratings methodology. 2. We view the NAIC designation methodology as the most appropriate way to view our AFS portfolio when evaluating credit risk since a large portion of our holdings were purchased at a significant discount to par. With respect to loan-backed and structured securities, the NAIC designation methodology differs in significant respects from the NRSRO rating methodology. NRSRO ratings methodology is focused on the likelihood of recovery of all contractual payments, including principal at par regardless of entry price, while the NAIC designation methodology considers our investment at amortized cost, and the likelihood of recovery of that book value as opposed to the likelihood of the recovery of all contractual payments. 3. Please refer to Notes to the Financial Supplement section for discussion on net invested assets and the Non-GAAP Measure Reconciliations section for the reconciliation of total investments, including related parties, to net invested assets. 48Credit Quality From Q2 2021 Financial Supplement Unaudited (in millions, except percentages) 1. Securities denoted as non-rated by the NRSRO were classified as investment or non-investment grade according to the security’s respective NAIC designation. With respect to modeled LBaSS, the NAIC designation methodology differs in significant respects from the NRSRO ratings methodology. 2. We view the NAIC designation methodology as the most appropriate way to view our AFS portfolio when evaluating credit risk since a large portion of our holdings were purchased at a significant discount to par. With respect to loan-backed and structured securities, the NAIC designation methodology differs in significant respects from the NRSRO rating methodology. NRSRO ratings methodology is focused on the likelihood of recovery of all contractual payments, including principal at par regardless of entry price, while the NAIC designation methodology considers our investment at amortized cost, and the likelihood of recovery of that book value as opposed to the likelihood of the recovery of all contractual payments. 3. Please refer to Notes to the Financial Supplement section for discussion on net invested assets and the Non-GAAP Measure Reconciliations section for the reconciliation of total investments, including related parties, to net invested assets. 48
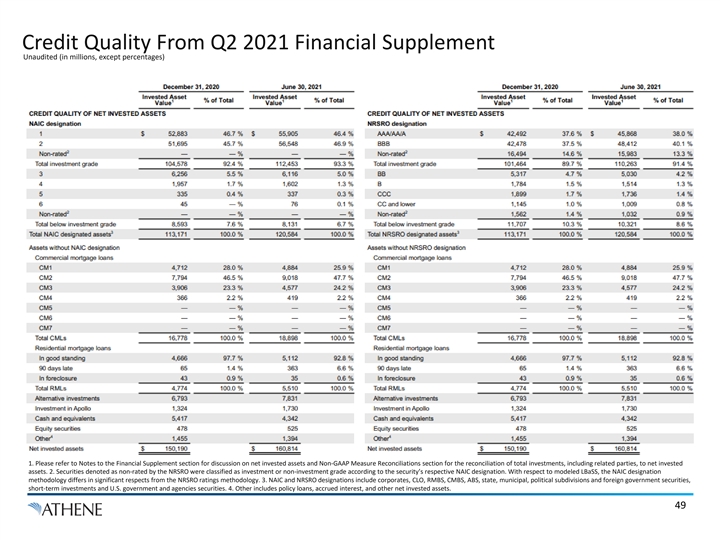
Credit Quality From Q2 2021 Financial Supplement Unaudited (in millions, except percentages) 1. Please refer to Notes to the Financial Supplement section for discussion on net invested assets and Non-GAAP Measure Reconciliations section for the reconciliation of total investments, including related parties, to net invested assets. 2. Securities denoted as non-rated by the NRSRO were classified as investment or non-investment grade according to the security’s respective NAIC designation. With respect to modeled LBaSS, the NAIC designation methodology differs in significant respects from the NRSRO ratings methodology. 3. NAIC and NRSRO designations include corporates, CLO, RMBS, CMBS, ABS, state, municipal, political subdivisions and foreign government securities, short-term investments and U.S. government and agencies securities. 4. Other includes policy loans, accrued interest, and other net invested assets. 49Credit Quality From Q2 2021 Financial Supplement Unaudited (in millions, except percentages) 1. Please refer to Notes to the Financial Supplement section for discussion on net invested assets and Non-GAAP Measure Reconciliations section for the reconciliation of total investments, including related parties, to net invested assets. 2. Securities denoted as non-rated by the NRSRO were classified as investment or non-investment grade according to the security’s respective NAIC designation. With respect to modeled LBaSS, the NAIC designation methodology differs in significant respects from the NRSRO ratings methodology. 3. NAIC and NRSRO designations include corporates, CLO, RMBS, CMBS, ABS, state, municipal, political subdivisions and foreign government securities, short-term investments and U.S. government and agencies securities. 4. Other includes policy loans, accrued interest, and other net invested assets. 49
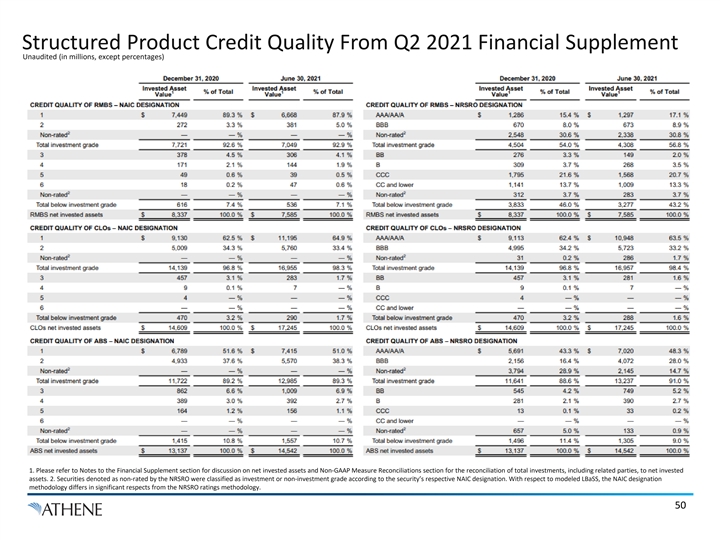
Structured Product Credit Quality From Q2 2021 Financial Supplement Unaudited (in millions, except percentages) 1. Please refer to Notes to the Financial Supplement section for discussion on net invested assets and Non-GAAP Measure Reconciliations section for the reconciliation of total investments, including related parties, to net invested assets. 2. Securities denoted as non-rated by the NRSRO were classified as investment or non-investment grade according to the security’s respective NAIC designation. With respect to modeled LBaSS, the NAIC designation methodology differs in significant respects from the NRSRO ratings methodology. 50Structured Product Credit Quality From Q2 2021 Financial Supplement Unaudited (in millions, except percentages) 1. Please refer to Notes to the Financial Supplement section for discussion on net invested assets and Non-GAAP Measure Reconciliations section for the reconciliation of total investments, including related parties, to net invested assets. 2. Securities denoted as non-rated by the NRSRO were classified as investment or non-investment grade according to the security’s respective NAIC designation. With respect to modeled LBaSS, the NAIC designation methodology differs in significant respects from the NRSRO ratings methodology. 50
Non-GAAP Measures and Definitions Key Operating and Non-GAAP Measures In addition to our results presented in accordance with GAAP, we present certain financial information that includes non-GAAP measures. Management believes the use of these non-GAAP measures, together with the relevant GAAP measures, provides information that may enhance an investor’s understanding of our results of operations and the underlying profitability drivers of our business. The majority of these non-GAAP measures are intended to remove from the results of operations the impact of market volatility (other than with respect to alternative investments) as well as integration, restructuring and certain other expenses which are not part of our underlying profitability drivers, as such items fluctuate from period to period in a manner inconsistent with these drivers. These measures should be considered supplementary to our results in accordance with GAAP and should not be viewed as a substitute for the corresponding GAAP measures. Adjusted Operating Income (Loss) Available to Common Shareholders Adjusted operating income (loss) available to common shareholders is a non-GAAP measure used to evaluate our financial performance excluding market volatility and expenses related to integration, restructuring, stock compensation and other expenses. Our adjusted operating income (loss) available to common shareholders equals net income (loss) available to AHL common shareholders adjusted to eliminate the impact of the following (collectively, the non-operating adjustments): •Investment Gains (Losses), Net of Offsets—Consists of the realized gains and losses on the sale of AFS securities, the change in fair value of reinsurance assets, unrealized gains and losses, changes in the credit loss allowance, and other investment gains and losses. Unrealized, allowances and other investment gains and losses are comprised of the fair value adjustments of trading securities (other than CLOs) and investments held under the fair value option, derivative gains and losses not hedging FIA index credits, and the change in credit loss allowances recognized in operations net of the change in AmerUs Closed Block fair value reserve related to the corresponding change in fair value of investments. Investment gains and losses are net of offsets related to DAC, DSI, and VOBA amortization and changes to guaranteed lifetime withdrawal benefit (GLWB) and guaranteed minimum death benefit (GMDB) reserves (together, GLWB and GMDB reserves represent rider reserves) as well as the market value adjustments (MVA) associated with surrenders or terminations of contracts. •Change in Fair Values of Derivatives and Embedded Derivatives – FIAs, Net of Offsets—Consists of impacts related to the fair value accounting for derivatives hedging the FIA index credits and the related embedded derivative liability fluctuations from period to period. The index reserve is measured at fair value for the current period and all periods beyond the current policyholder index term. However, the FIA hedging derivatives are purchased to hedge only the current index period. Upon policyholder renewal at the end of the period, new FIA hedging derivatives are purchased to align with the new term. The difference in duration between the FIA hedging derivatives and the index credit reserves creates a timing difference in earnings. This timing difference of the FIA hedging derivatives and index credit reserves is included as a non-operating adjustment, net of offsets related to DAC, DSI, and VOBA amortization and changes to rider reserves. We primarily hedge with options that align with the index terms of our FIA products (typically 1–2 years). On an economic basis, we believe this is suitable because policyholder accounts are credited with index performance at the end of each index term. However, because the term of an embedded derivative in an FIA contract is longer-dated, there is a duration mismatch which may lead to mismatches for accounting purposes. •Integration, Restructuring, and Other Non-operating Expenses—Consists of restructuring and integration expenses related to acquisitions and block reinsurance costs as well as certain other expenses, which are not predictable or related to our underlying profitability drivers. •Stock Compensation Expense—Consists of stock compensation expenses associated with our share incentive plans, excluding our long-term incentive plan, which are not related to our underlying profitability drivers and fluctuate from time to time due to the structure of our plans. •Income Tax (Expense) Benefit – Non-operating—Consists of the income tax effect of non-operating adjustments and is computed by applying the appropriate jurisdiction’s tax rate to the non-operating adjustments that are subject to income tax. We consider these non-operating adjustments to be meaningful adjustments to net income (loss) available to AHL common shareholders for the reasons discussed in greater detail above. Accordingly, we believe using a measure which excludes the impact of these items is useful in analyzing our business performance and the trends in our results of operations. Together with net income (loss) available to AHL common shareholders, we believe adjusted operating income (loss) available to common shareholders provides a meaningful financial metric that helps investors understand our underlying results and profitability. Adjusted operating income (loss) available to common shareholders should not be used as a substitute for net income (loss) available to AHL common shareholders. 51
Non-GAAP Measures and Definitions Adjusted Operating Income (Loss) Available to Common Shareholders Continued Adjusted Operating ROE Adjusted operating ROE is a non-GAAP measure used to evaluate our financial performance excluding the impacts of AOCI and the cumulative change in fair value of funds withheld and modco reinsurance assets, net of DAC, DSI, rider reserve and tax offsets. Adjusted AHL common shareholders’ equity is calculated as the ending AHL shareholders’ equity excluding AOCI, the cumulative change in fair value of funds withheld and modco reinsurance assets and preferred stock. Adjusted operating ROE is calculated as the adjusted operating income (loss) available to common shareholders, divided by average adjusted AHL common shareholders’ equity. These adjustments fluctuate period to period in a manner inconsistent with our underlying profitability drivers as the majority of such fluctuation is related to the market volatility of the unrealized gains and losses associated with our AFS securities. Except with respect to reinvestment activity relating to acquired blocks of businesses, we typically buy and hold AFS investments to maturity throughout the duration of market fluctuations, therefore, the period-over-period impacts in unrealized gains and losses are not necessarily indicative of current operating fundamentals or future performance. Accordingly, we believe using measures which exclude AOCI and the cumulative change in fair value of funds withheld and modco reinsurance assets are useful in analyzing trends in our operating results. To enhance the ability to analyze these measures across periods, interim periods are annualized. Adjusted operating ROE should not be used as a substitute for ROE. However, we believe the adjustments to net income (loss) available to AHL common shareholders and AHL common shareholders’ equity are significant to gaining an understanding of our overall financial performance. Adjusted Debt to Capital Ratio Adjusted debt to capital ratio is a non-GAAP measure used to evaluate our capital structure excluding the impacts of AOCI and the cumulative change in fair value of funds withheld and modco reinsurance assets, net of DAC, DSI, rider reserve and tax offsets. Adjusted debt to capital ratio is calculated as total debt divided by adjusted AHL shareholders’ equity. Adjusted debt to capital ratio should not be used as a substitute for the debt to capital ratio. However, we believe the adjustments to shareholders’ equity are significant to gaining an understanding of our capitalization, debt utilization and debt capacity. Invested Assets In managing our business, we analyze net invested assets, which does not correspond to total investments, including investments in related parties, as disclosed in our consolidated financial statements and notes thereto. Net invested assets represents the investments that directly back our net reserve liabilities as well as surplus assets. Net invested assets, excluding our investment in Apollo, is used in the computation of net investment earned rate, which allows us to analyze the profitability of our investment portfolio. Net invested assets includes (a) total investments on the consolidated balance sheets with AFS securities at cost or amortized cost, excluding derivatives, (b) cash and cash equivalents and restricted cash, (c) investments in related parties, (d) accrued investment income, (e) VIE assets, liabilities and noncontrolling interest adjustments, (f) net investment payables and receivables, (g) policy loans ceded (which offset the direct policy loans in total investments) and (h) an allowance for credit losses. Net invested assets also excludes assets associated with funds withheld liabilities related to business exited through reinsurance agreements and derivative collateral (offsetting the related cash positions). We include the underlying investments supporting our assumed funds withheld and modco agreements in our net invested assets calculation in order to match the assets with the income received. We believe the adjustments for reinsurance provide a view of the assets for which we have economic exposure. Net invested assets includes our proportionate share of ACRA investments, based on our economic ownership, but does not include the proportionate share of investments associated with the noncontrolling interest. Net invested assets also includes our investment in Apollo. Our net invested assets, excluding our investment in Apollo, are averaged over the number of quarters in the relevant period to compute our net investment earned rate for such period. While we believe net invested assets is a meaningful financial metric and enhances our understanding of the underlying drivers of our investment portfolio, it should not be used as a substitute for total investments, including related parties, presented under GAAP. Sales (Volumes) Sales statistics do not correspond to revenues under GAAP but are used as relevant measures to understand our business performance as it relates to inflows generated during a specific period of time. Our sales statistics include inflows for fixed rate annuities and FIAs and align with the LIMRA definition of all money paid into an individual annuity, including money paid into new contracts with initial purchase occurring in the specified period and existing contracts with initial purchase occurring prior to the specified period (excluding internal transfers). While we believe sales is a meaningful metric and enhances our understanding of our business performance, it should not be used as a substitute for premiums presented under GAAP. 52Non-GAAP Measures and Definitions Adjusted Operating Income (Loss) Available to Common Shareholders Continued Adjusted Operating ROE Adjusted operating ROE is a non-GAAP measure used to evaluate our financial performance excluding the impacts of AOCI and the cumulative change in fair value of funds withheld and modco reinsurance assets, net of DAC, DSI, rider reserve and tax offsets. Adjusted AHL common shareholders’ equity is calculated as the ending AHL shareholders’ equity excluding AOCI, the cumulative change in fair value of funds withheld and modco reinsurance assets and preferred stock. Adjusted operating ROE is calculated as the adjusted operating income (loss) available to common shareholders, divided by average adjusted AHL common shareholders’ equity. These adjustments fluctuate period to period in a manner inconsistent with our underlying profitability drivers as the majority of such fluctuation is related to the market volatility of the unrealized gains and losses associated with our AFS securities. Except with respect to reinvestment activity relating to acquired blocks of businesses, we typically buy and hold AFS investments to maturity throughout the duration of market fluctuations, therefore, the period-over-period impacts in unrealized gains and losses are not necessarily indicative of current operating fundamentals or future performance. Accordingly, we believe using measures which exclude AOCI and the cumulative change in fair value of funds withheld and modco reinsurance assets are useful in analyzing trends in our operating results. To enhance the ability to analyze these measures across periods, interim periods are annualized. Adjusted operating ROE should not be used as a substitute for ROE. However, we believe the adjustments to net income (loss) available to AHL common shareholders and AHL common shareholders’ equity are significant to gaining an understanding of our overall financial performance. Adjusted Debt to Capital Ratio Adjusted debt to capital ratio is a non-GAAP measure used to evaluate our capital structure excluding the impacts of AOCI and the cumulative change in fair value of funds withheld and modco reinsurance assets, net of DAC, DSI, rider reserve and tax offsets. Adjusted debt to capital ratio is calculated as total debt divided by adjusted AHL shareholders’ equity. Adjusted debt to capital ratio should not be used as a substitute for the debt to capital ratio. However, we believe the adjustments to shareholders’ equity are significant to gaining an understanding of our capitalization, debt utilization and debt capacity. Invested Assets In managing our business, we analyze net invested assets, which does not correspond to total investments, including investments in related parties, as disclosed in our consolidated financial statements and notes thereto. Net invested assets represents the investments that directly back our net reserve liabilities as well as surplus assets. Net invested assets, excluding our investment in Apollo, is used in the computation of net investment earned rate, which allows us to analyze the profitability of our investment portfolio. Net invested assets includes (a) total investments on the consolidated balance sheets with AFS securities at cost or amortized cost, excluding derivatives, (b) cash and cash equivalents and restricted cash, (c) investments in related parties, (d) accrued investment income, (e) VIE assets, liabilities and noncontrolling interest adjustments, (f) net investment payables and receivables, (g) policy loans ceded (which offset the direct policy loans in total investments) and (h) an allowance for credit losses. Net invested assets also excludes assets associated with funds withheld liabilities related to business exited through reinsurance agreements and derivative collateral (offsetting the related cash positions). We include the underlying investments supporting our assumed funds withheld and modco agreements in our net invested assets calculation in order to match the assets with the income received. We believe the adjustments for reinsurance provide a view of the assets for which we have economic exposure. Net invested assets includes our proportionate share of ACRA investments, based on our economic ownership, but does not include the proportionate share of investments associated with the noncontrolling interest. Net invested assets also includes our investment in Apollo. Our net invested assets, excluding our investment in Apollo, are averaged over the number of quarters in the relevant period to compute our net investment earned rate for such period. While we believe net invested assets is a meaningful financial metric and enhances our understanding of the underlying drivers of our investment portfolio, it should not be used as a substitute for total investments, including related parties, presented under GAAP. Sales (Volumes) Sales statistics do not correspond to revenues under GAAP but are used as relevant measures to understand our business performance as it relates to inflows generated during a specific period of time. Our sales statistics include inflows for fixed rate annuities and FIAs and align with the LIMRA definition of all money paid into an individual annuity, including money paid into new contracts with initial purchase occurring in the specified period and existing contracts with initial purchase occurring prior to the specified period (excluding internal transfers). While we believe sales is a meaningful metric and enhances our understanding of our business performance, it should not be used as a substitute for premiums presented under GAAP. 52
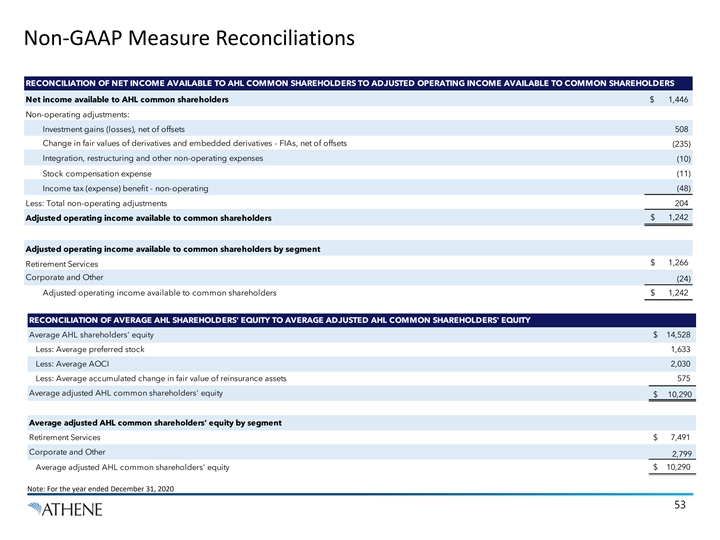
Non-GAAP Measure Reconciliations RECONCILIATION OF NET INCOME AVAILABLE TO AHL COMMON SHAREHOLDERS TO ADJUSTED OPERATING INCOME AVAILABLE TO COMMON SHAREHOLDERS Net income available to AHL common shareholders $ 1,446 Non-operating adjustments: Investment gains (losses), net of offsets 508 Change in fair values of derivatives and embedded derivatives - FIAs, net of offsets (235) Integration, restructuring and other non-operating expenses (10) Stock compensation expense (11) Income tax (expense) benefit - non-operating (48) Less: Total non-operating adjustments 204 $ 1,242 Adjusted operating income available to common shareholders Adjusted operating income available to common shareholders by segment $ 1,266 Retirement Services Corporate and Other (24) Adjusted operating income available to common shareholders $ 1,242 RECONCILIATION OF AVERAGE AHL SHAREHOLDERS' EQUITY TO AVERAGE ADJUSTED AHL COMMON SHAREHOLDERS' EQUITY Average AHL shareholders' equity $ 14,528 Less: Average preferred stock 1,633 Less: Average AOCI 2,030 Less: Average accumulated change in fair value of reinsurance assets 575 Average adjusted AHL common shareholders' equity $ 10,290 Average adjusted AHL common shareholders' equity by segment Retirement Services $ 7,491 Corporate and Other 2,799 Average adjusted AHL common shareholders' equity $ 10,290 Note: For the year ended December 31, 2020 53Non-GAAP Measure Reconciliations RECONCILIATION OF NET INCOME AVAILABLE TO AHL COMMON SHAREHOLDERS TO ADJUSTED OPERATING INCOME AVAILABLE TO COMMON SHAREHOLDERS Net income available to AHL common shareholders $ 1,446 Non-operating adjustments: Investment gains (losses), net of offsets 508 Change in fair values of derivatives and embedded derivatives - FIAs, net of offsets (235) Integration, restructuring and other non-operating expenses (10) Stock compensation expense (11) Income tax (expense) benefit - non-operating (48) Less: Total non-operating adjustments 204 $ 1,242 Adjusted operating income available to common shareholders Adjusted operating income available to common shareholders by segment $ 1,266 Retirement Services Corporate and Other (24) Adjusted operating income available to common shareholders $ 1,242 RECONCILIATION OF AVERAGE AHL SHAREHOLDERS' EQUITY TO AVERAGE ADJUSTED AHL COMMON SHAREHOLDERS' EQUITY Average AHL shareholders' equity $ 14,528 Less: Average preferred stock 1,633 Less: Average AOCI 2,030 Less: Average accumulated change in fair value of reinsurance assets 575 Average adjusted AHL common shareholders' equity $ 10,290 Average adjusted AHL common shareholders' equity by segment Retirement Services $ 7,491 Corporate and Other 2,799 Average adjusted AHL common shareholders' equity $ 10,290 Note: For the year ended December 31, 2020 53
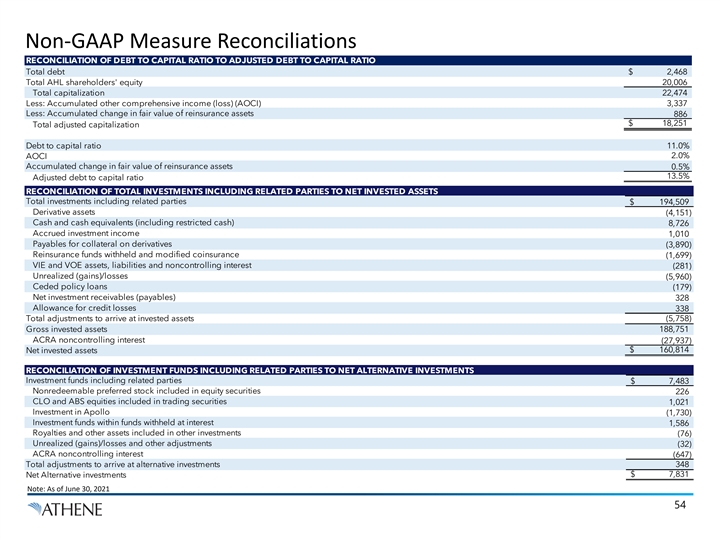
Non-GAAP Measure Reconciliations RECONCILIATION OF DEBT TO CAPITAL RATIO TO ADJUSTED DEBT TO CAPITAL RATIO Total debt $ 2,468 Total AHL shareholders' equity 20,006 Total capitalization 22,474 Less: Accumulated other comprehensive income (loss) (AOCI) 3,337 Less: Accumulated change in fair value of reinsurance assets 886 $ 18, 251 Total adjusted capitalization Debt to capital ratio 11.0% 2.0% AOCI Accumulated change in fair value of reinsurance assets 0.5% 13.5% Adjusted debt to capital ratio RECONCILIATION OF TOTAL INVESTMENTS INCLUDING RELATED PARTIES TO NET INVESTED ASSETS Total investments including related parties $ 194,509 Derivative assets (4,151) Cash and cash equivalents (including restricted cash) 8,726 Accrued investment income 1,010 Payables for collateral on derivatives (3,890) Reinsurance funds withheld and modified coinsurance (1,699) VIE and VOE assets, liabilities and noncontrolling interest (281) Unrealized (gains)/losses (5,960) Ceded policy loans (179) Net investment receivables (payables) 328 Allowance for credit losses 338 Total adjustments to arrive at invested assets ( 5,758) Gross invested assets 188, 751 ACRA noncontrolling interest (27,937) Net invested assets $ 160, 814 RECONCILIATION OF INVESTMENT FUNDS INCLUDING RELATED PARTIES TO NET ALTERNATIVE INVESTMENTS Investment funds including related parties $ 7,483 Nonredeemable preferred stock included in equity securities 226 CLO and ABS equities included in trading securities 1,021 Investment in Apollo (1,730) Investment funds within funds withheld at interest 1,586 Royalties and other assets included in other investments (76) Unrealized (gains)/losses and other adjustments (32) ACRA noncontrolling interest (647) Total adjustments to arrive at alternative investments 348 $ 7, 831 Net Alternative investments Note: As of June 30, 2021 54Non-GAAP Measure Reconciliations RECONCILIATION OF DEBT TO CAPITAL RATIO TO ADJUSTED DEBT TO CAPITAL RATIO Total debt $ 2,468 Total AHL shareholders' equity 20,006 Total capitalization 22,474 Less: Accumulated other comprehensive income (loss) (AOCI) 3,337 Less: Accumulated change in fair value of reinsurance assets 886 $ 18, 251 Total adjusted capitalization Debt to capital ratio 11.0% 2.0% AOCI Accumulated change in fair value of reinsurance assets 0.5% 13.5% Adjusted debt to capital ratio RECONCILIATION OF TOTAL INVESTMENTS INCLUDING RELATED PARTIES TO NET INVESTED ASSETS Total investments including related parties $ 194,509 Derivative assets (4,151) Cash and cash equivalents (including restricted cash) 8,726 Accrued investment income 1,010 Payables for collateral on derivatives (3,890) Reinsurance funds withheld and modified coinsurance (1,699) VIE and VOE assets, liabilities and noncontrolling interest (281) Unrealized (gains)/losses (5,960) Ceded policy loans (179) Net investment receivables (payables) 328 Allowance for credit losses 338 Total adjustments to arrive at invested assets ( 5,758) Gross invested assets 188, 751 ACRA noncontrolling interest (27,937) Net invested assets $ 160, 814 RECONCILIATION OF INVESTMENT FUNDS INCLUDING RELATED PARTIES TO NET ALTERNATIVE INVESTMENTS Investment funds including related parties $ 7,483 Nonredeemable preferred stock included in equity securities 226 CLO and ABS equities included in trading securities 1,021 Investment in Apollo (1,730) Investment funds within funds withheld at interest 1,586 Royalties and other assets included in other investments (76) Unrealized (gains)/losses and other adjustments (32) ACRA noncontrolling interest (647) Total adjustments to arrive at alternative investments 348 $ 7, 831 Net Alternative investments Note: As of June 30, 2021 54