EX-99.1
Published on July 3, 2024

Perspectives on Commercial Real Estate July 2024 Update
Disclaimer This presentation does not constitute an offer to sell, or the solicitation of an offer to buy, any security of Athene Holding Ltd. (“Athene”). This presentation is not intended to constitute a solicitation of any insurance policy or contract or application therefore. Unless the context requires otherwise, references in this presentation to “Apollo," "AGM" and "AGM HoldCo" refer to Apollo Global Management, Inc., together with its subsidiaries, and references in this presentation to “AAM” refer to Apollo Asset Management, Inc., a subsidiary of Apollo Global Management, Inc. This presentation contains, and certain oral statements made by Athene’s representatives from time to time may contain, forward-looking statements within the meaning of the Private Securities Litigation Reform Act of 1995, Section 27A of the Securities Act of 1933, as amended, and Section 21E of the Securities Exchange Act of 1934, as amended. Such statements are subject to risks, uncertainties and assumptions that could cause actual results, events and developments to differ materially from those set forth in, or implied by, such statements. These statements are based on the beliefs and assumptions of Athene’s management and the management of Athene’s subsidiaries. Generally, forward-looking statements include actions, events, results, strategies and expectations and are often identifiable by use of the words “believes,” “expects,” “intends,” “anticipates,” “plans,” “seeks,” “estimates,” “projects,” “may,” “will,” “could,” “might,” or “continues” or similar expressions. Forward looking statements within this presentation include, but are not limited to, benefits to be derived from Athene's capital allocation decisions; the anticipated performance of Athene's portfolio in certain stress or recessionary environments; the performance of Athene's business; general economic conditions; expected future operating results; Athene's liquidity and capital resources; and other non-historical statements. Although Athene management believes that the expectations reflected in these forward-looking statements are reasonable, it can give no assurance that these expectations will prove to be correct. For a discussion of other risks and uncertainties related to Athene's forward-looking statements, see its annual report on Form 10-K for the year ended December 31, 2023, and its quarterly report on Form 10-Q for the quarter ended March 31, 2024 which can be found at the SEC’s website at www.sec.gov. All forward-looking statements described herein are qualified by these cautionary statements and there can be no assurance that the actual results, events or developments referenced herein will occur or be realized. Athene does not undertake any obligation to update or revise forward-looking statements to reflect changed assumptions, the occurrence of unanticipated events or changes to future operating results. Information contained herein may include information respecting prior performance of Athene. Information respecting prior performance, while a useful tool, is not necessarily indicative of actual results to be achieved in the future, which is dependent upon many factors, many of which are beyond Athene's control. The information contained herein is not a guarantee of future performance by Athene, and actual outcomes and results may differ materially from any historic, pro forma or projected financial results indicated herein. Certain of the financial information contained herein is unaudited or based on the application of non-GAAP financial measures. These non-GAAP financial measures should be considered in addition to and not as a substitute for, or superior to, financial measures presented in accordance with GAAP. Furthermore, certain financial information is based on estimates of management. These estimates, which are based on the reasonable expectations of management, are subject to change and there can be no assurance that they will prove to be correct. The information contained herein does not purport to be all-inclusive or contain all information that an evaluator may require in order to properly evaluate the business, prospects or value of Athene. Athene does not have any obligation to update this presentation and the information may change at any time without notice. Models that may be contained herein (the “Models”) are being provided for illustrative and discussion purposes only and are not intended to forecast or predict future events. Information provided in the Models may not reflect the most current data and is subject to change. The Models are based on estimates and assumptions that are also subject to change and may be subject to significant business, economic and competitive uncertainties, including numerous uncontrollable market and event driven situations. There is no guarantee that the information presented in the Models is accurate. Actual results may differ materially from those reflected and contemplated in such hypothetical, forward-looking information. Undue reliance should not be placed on such information and investors should not use the Models to make investment decisions. Athene has no duty to update the Models in the future. Certain of the information used in preparing this presentation was obtained from third parties or public sources. No representation or warranty, express or implied, is made or given by or on behalf of Athene or any other person as to the accuracy, completeness or fairness of such information, and no responsibility or liability is accepted for any such information. The contents of any website referenced in this presentation are not incorporated by reference. This document is not intended to be, nor should it be construed or used as, financial, legal, tax, insurance or investment advice. There can be no assurance that Athene will achieve its objectives. Past performance is not indicative of future success. All information is as of the dates indicated herein. 2
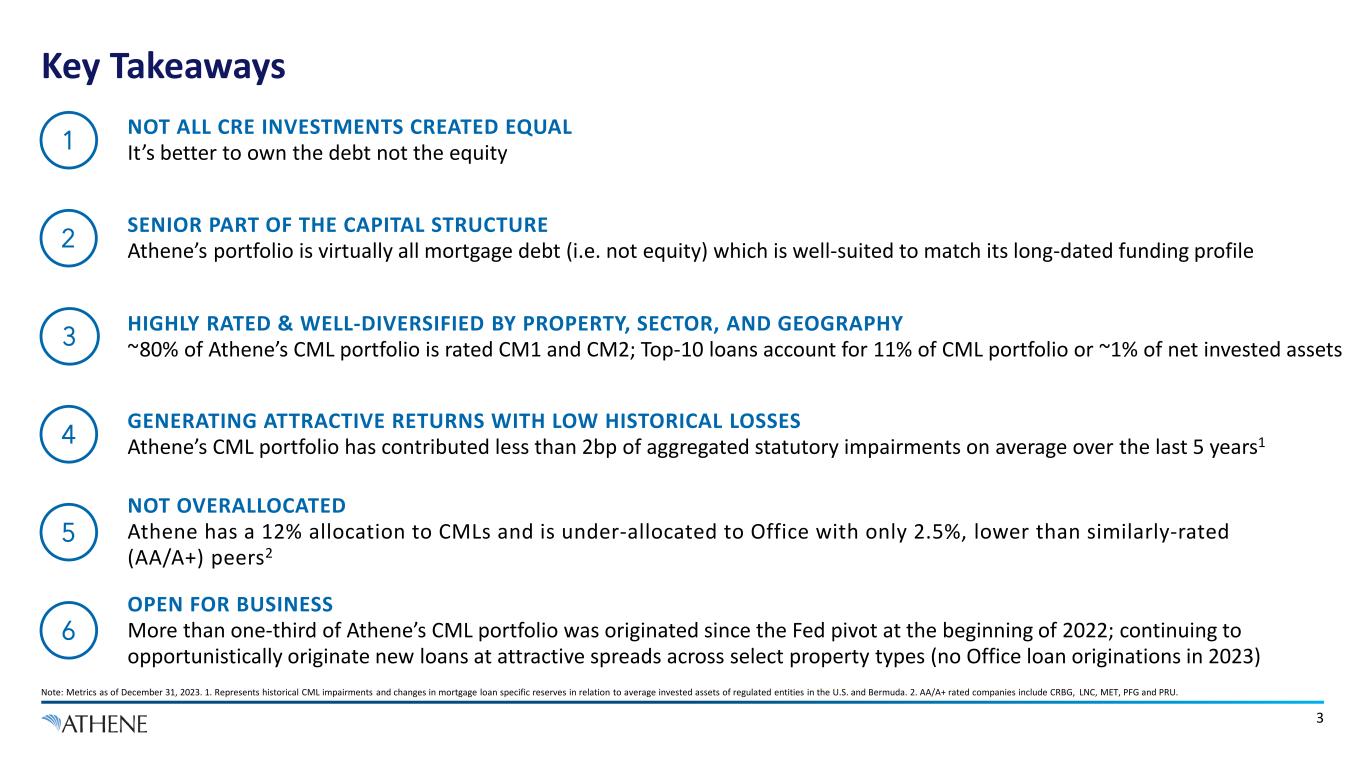
Key Takeaways Note: Metrics as of December 31, 2023. 1. Represents historical CML impairments and changes in mortgage loan specific reserves in relation to average invested assets of regulated entities in the U.S. and Bermuda. 2. AA/A+ rated companies include CRBG, LNC, MET, PFG and PRU. 3 GENERATING ATTRACTIVE RETURNS WITH LOW HISTORICAL LOSSES Athene’s CML portfolio has contributed less than 2bp of aggregated statutory impairments on average over the last 5 years14 SENIOR PART OF THE CAPITAL STRUCTURE Athene’s portfolio is virtually all mortgage debt (i.e. not equity) which is well-suited to match its long-dated funding profile 2 NOT OVERALLOCATED Athene has a 12% allocation to CMLs and is under-allocated to Office with only 2.5%, lower than similarly-rated (AA/A+) peers2 5 OPEN FOR BUSINESS More than one-third of Athene’s CML portfolio was originated since the Fed pivot at the beginning of 2022; continuing to opportunistically originate new loans at attractive spreads across select property types (no Office loan originations in 2023) 6 NOT ALL CRE INVESTMENTS CREATED EQUAL It’s better to own the debt not the equity1 3 HIGHLY RATED & WELL-DIVERSIFIED BY PROPERTY, SECTOR, AND GEOGRAPHY ~80% of Athene’s CML portfolio is rated CM1 and CM2; Top-10 loans account for 11% of CML portfolio or ~1% of net invested assets

Industry Considerations
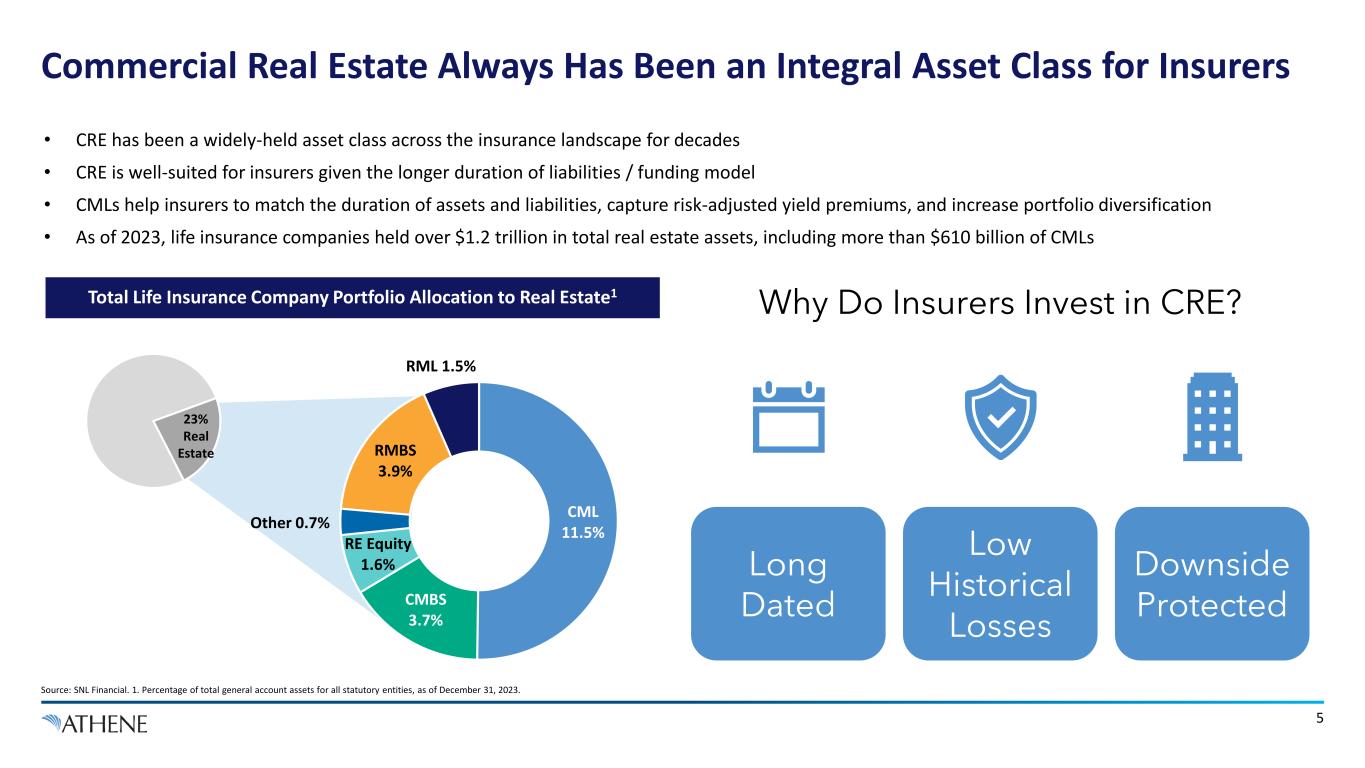
CML 11.5% CMBS 3.7% RE Equity 1.6% Other 0.7% RMBS 3.9% RML 1.5% Commercial Real Estate Always Has Been an Integral Asset Class for Insurers Source: SNL Financial. 1. Percentage of total general account assets for all statutory entities, as of December 31, 2023. Long Dated Low Historical Losses Downside Protected Why Do Insurers Invest in CRE?Total Life Insurance Company Portfolio Allocation to Real Estate1 • CRE has been a widely-held asset class across the insurance landscape for decades • CRE is well-suited for insurers given the longer duration of liabilities / funding model • CMLs help insurers to match the duration of assets and liabilities, capture risk-adjusted yield premiums, and increase portfolio diversification • As of 2023, life insurance companies held over $1.2 trillion in total real estate assets, including more than $610 billion of CMLs 23% Real Estate 5
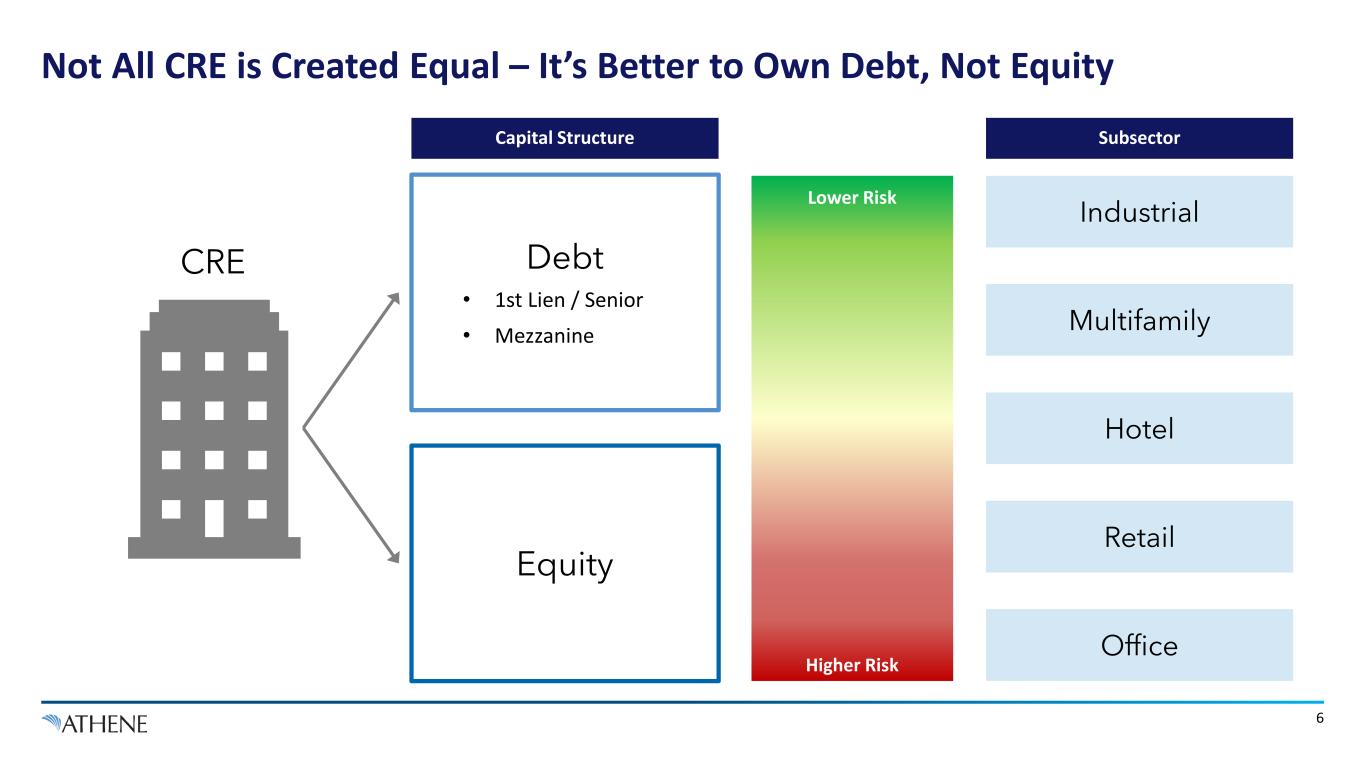
Not All CRE is Created Equal – It’s Better to Own Debt, Not Equity 6 Debt • 1st Lien / Senior • Mezzanine Equity Higher Risk Lower Risk Capital Structure Subsector Industrial Multifamily Hotel Retail Office CRE
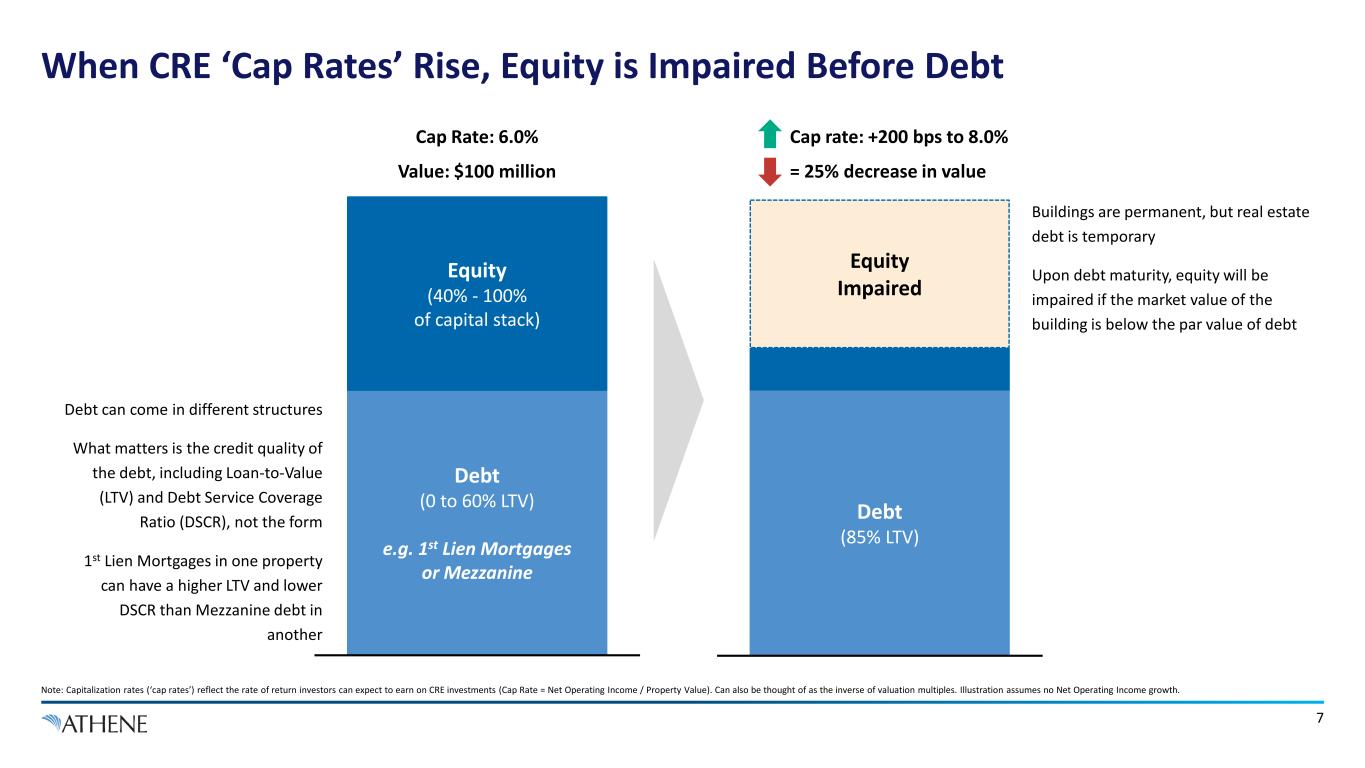
When CRE ‘Cap Rates’ Rise, Equity is Impaired Before Debt Note: Capitalization rates (‘cap rates’) reflect the rate of return investors can expect to earn on CRE investments (Cap Rate = Net Operating Income / Property Value). Can also be thought of as the inverse of valuation multiples. Illustration assumes no Net Operating Income growth. 7 Cap Rate: 6.0% Value: $100 million Cap rate: +200 bps to 8.0% = 25% decrease in value Buildings are permanent, but real estate debt is temporary Upon debt maturity, equity will be impaired if the market value of the building is below the par value of debt Debt (0 to 60% LTV) e.g. 1st Lien Mortgages or Mezzanine Equity (40% - 100% of capital stack) Debt (85% LTV) Equity Impaired Debt can come in different structures What matters is the credit quality of the debt, including Loan-to-Value (LTV) and Debt Service Coverage Ratio (DSCR), not the form 1st Lien Mortgages in one property can have a higher LTV and lower DSCR than Mezzanine debt in another

0.2% 0.6% 1.0% 2.3% 1.0% 0.1% PRU EQH CRBG MET Average Athene 0.1% 0.5% 0.5% 1.0% 1.2% Athene Variable Annuity Fixed Annuity AA/A+ Diversified Life Athene Has De Minimis Exposure to CRE Equity Note: CRE equity includes affiliated and unaffiliated real estate assets held by U.S.-based insurance subsidiaries from Schedule BA and Schedule A directly held real estate of statutory filings, aggregated by SNL Financial. Metrics shown as a % of invested assets as of December 31, 2023. Variable Annuity Companies include JXN, LNC, BHF, and EQH. Diversified Life Insurers include MET, PRU and CRBG. Fixed Annuity Companies include AEL, Global Atlantic, FG, and CNO; AA/A+ rated companies include MET, PRU, CRBG and EQH. Real Estate Equity as % of Total General Account Assets U.S. Retirement Services Companies by Type Select AA/A+ Retirement Services Peers 8
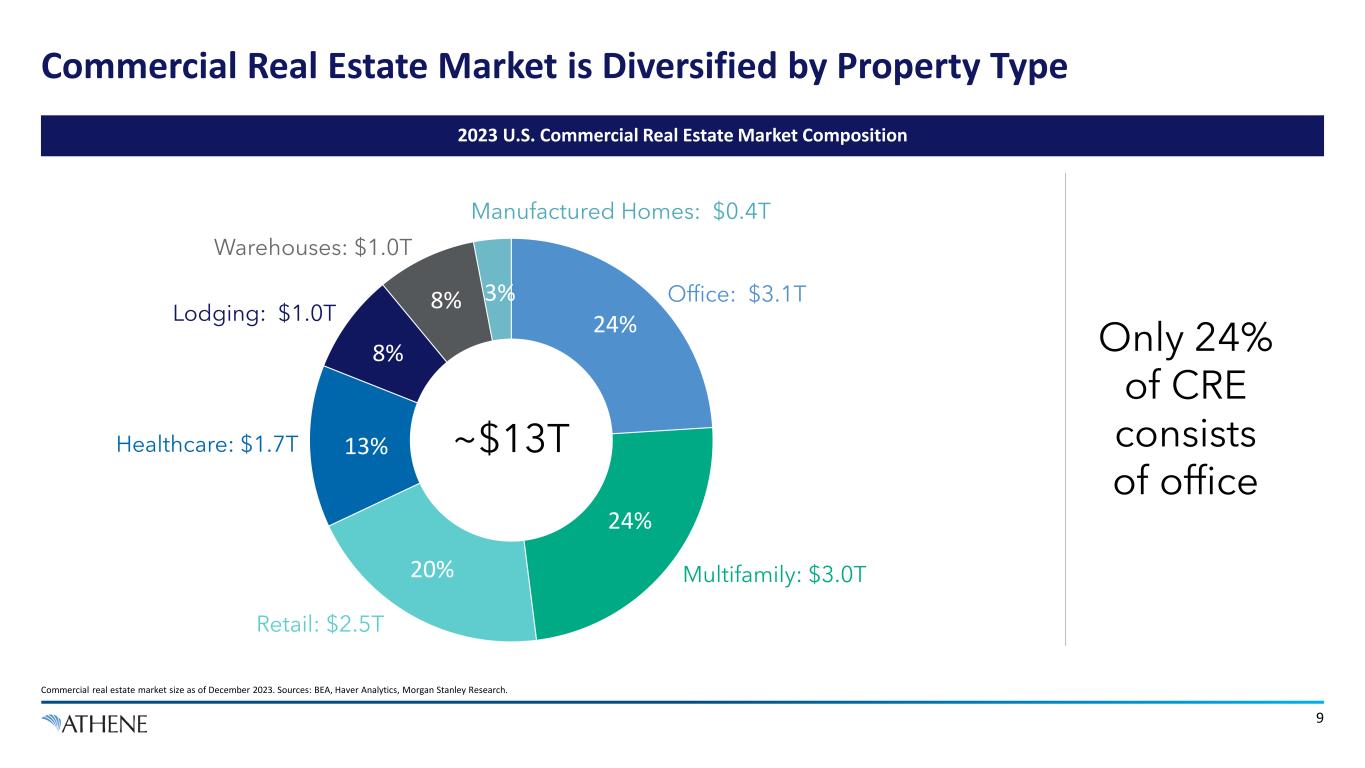
24% 24% 20% 13% 8% 8% 3% 9 Commercial Real Estate Market is Diversified by Property Type Commercial real estate market size as of December 2023. Sources: BEA, Haver Analytics, Morgan Stanley Research. Office: $3.1T Multifamily: $3.0T Retail: $2.5T Healthcare: $1.7T Lodging: $1.0T Warehouses: $1.0T Manufactured Homes: $0.4T Only 24% of CRE consists of office 2023 U.S. Commercial Real Estate Market Composition ~$13T
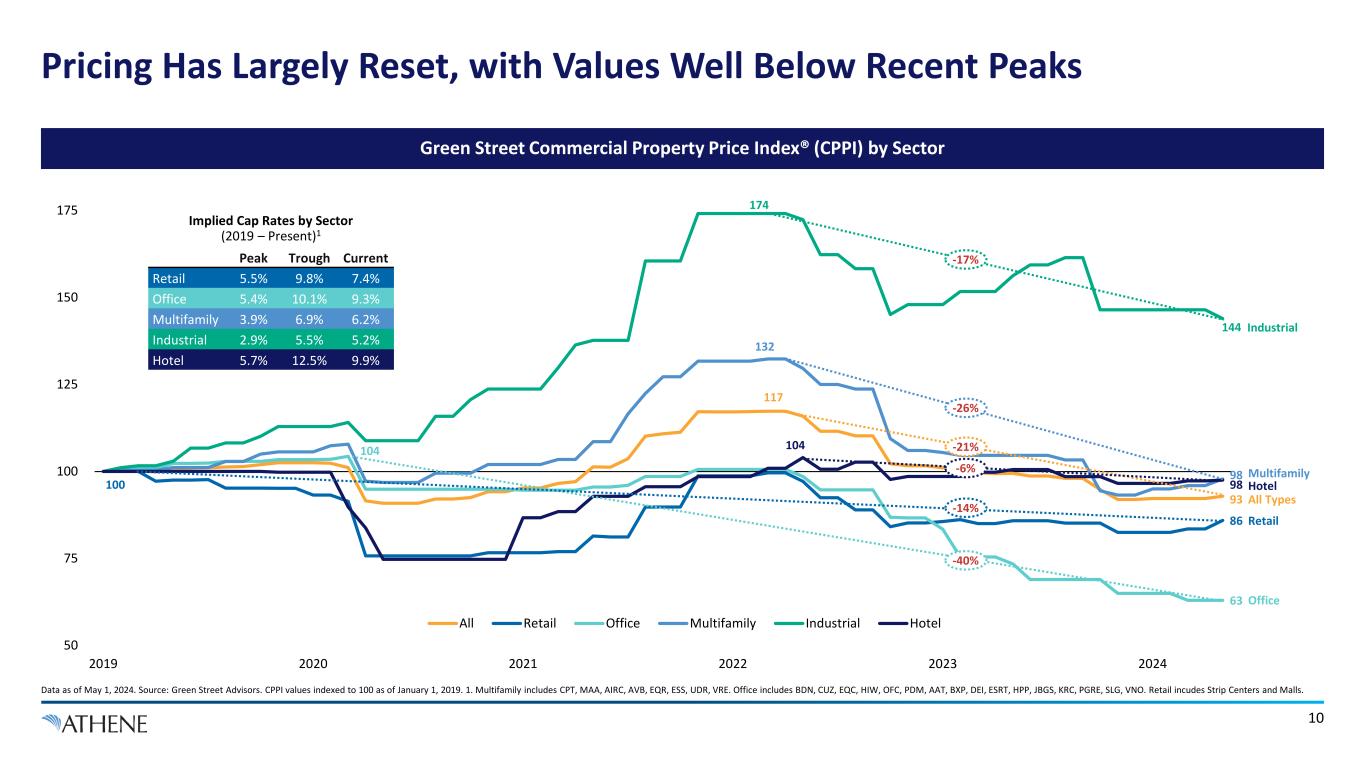
117 93 86 104 63 132 98 174 144 104 98 50 75 100 125 150 175 2019 2020 2021 2022 2023 2024 All Retail Office Multifamily Industrial Hotel 100 Pricing Has Largely Reset, with Values Well Below Recent Peaks Data as of May 1, 2024. Source: Green Street Advisors. CPPI values indexed to 100 as of January 1, 2019. 1. Multifamily includes CPT, MAA, AIRC, AVB, EQR, ESS, UDR, VRE. Office includes BDN, CUZ, EQC, HIW, OFC, PDM, AAT, BXP, DEI, ESRT, HPP, JBGS, KRC, PGRE, SLG, VNO. Retail incudes Strip Centers and Malls. 10 Industrial Multifamily All Types Hotel Retail Office -17% -26% -21% -6% -14% -40% Green Street Commercial Property Price Index® (CPPI) by Sector Implied Cap Rates by Sector (2019 – Present)1 Peak Trough Current Retail 5.5% 9.8% 7.4% Office 5.4% 10.1% 9.3% Multifamily 3.9% 6.9% 6.2% Industrial 2.9% 5.5% 5.2% Hotel 5.7% 12.5% 9.9%
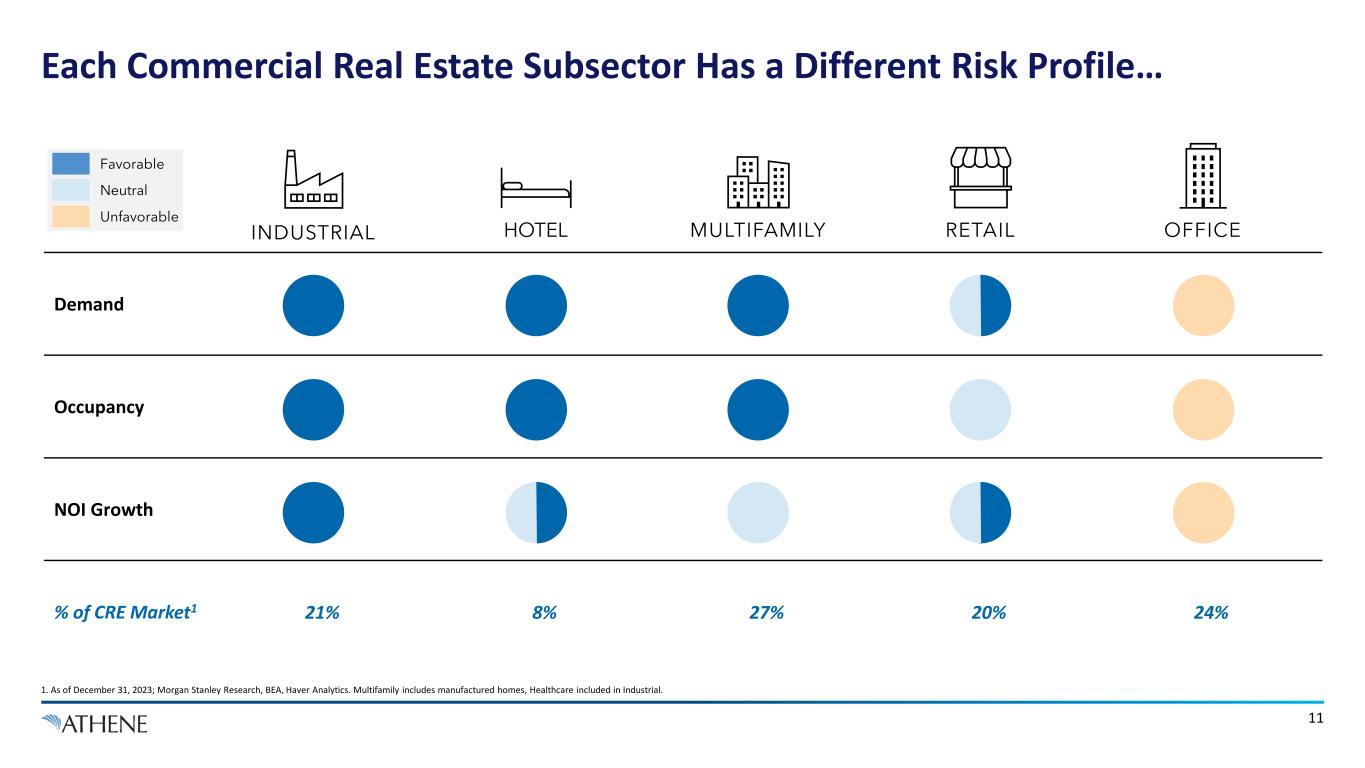
Each Commercial Real Estate Subsector Has a Different Risk Profile… 1. As of December 31, 2023; Morgan Stanley Research, BEA, Haver Analytics. Multifamily includes manufactured homes, Healthcare included in Industrial. 11 Demand Occupancy NOI Growth % of CRE Market1 21% 8% 27% 20% 24% HOTELINDUSTRIAL OFFICEMULTIFAMILY RETAIL Favorable Neutral Unfavorable
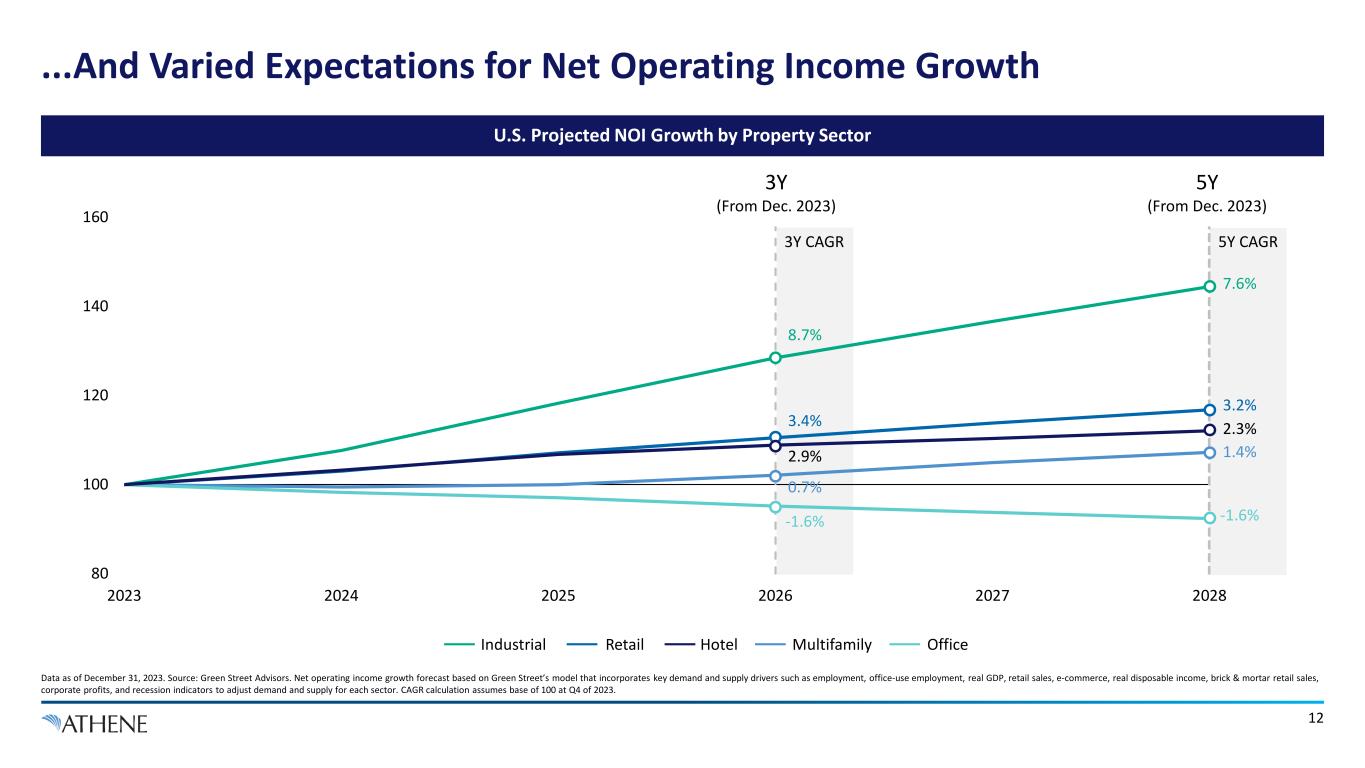
80 100 120 140 160 2023 2024 2025 2026 2027 2028 12 Data as of December 31, 2023. Source: Green Street Advisors. Net operating income growth forecast based on Green Street’s model that incorporates key demand and supply drivers such as employment, office-use employment, real GDP, retail sales, e-commerce, real disposable income, brick & mortar retail sales, corporate profits, and recession indicators to adjust demand and supply for each sector. CAGR calculation assumes base of 100 at Q4 of 2023. 3Y (From Dec. 2023) 5Y (From Dec. 2023) 8.7% 3.4% 0.7% -1.6% 2.9% 7.6% 3.2% 1.4% -1.6% 2.3% U.S. Projected NOI Growth by Property Sector ...And Varied Expectations for Net Operating Income Growth 3Y CAGR 5Y CAGR Industrial Retail Hotel Multifamily Office
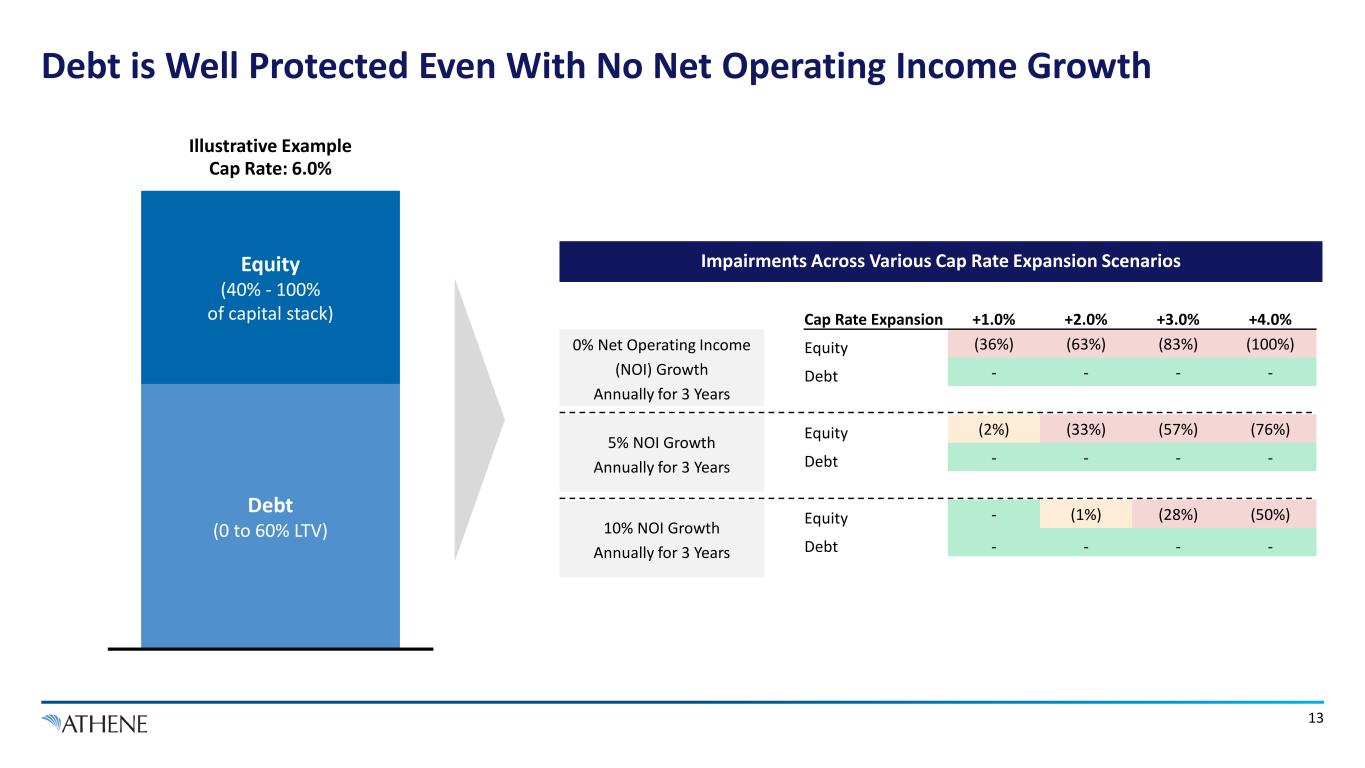
Debt is Well Protected Even With No Net Operating Income Growth 13 0% Net Operating Income (NOI) Growth Annually for 3 Years 5% NOI Growth Annually for 3 Years 10% NOI Growth Annually for 3 Years Impairments Across Various Cap Rate Expansion Scenarios Cap Rate: 6.0% Debt (0 to 60% LTV) Equity (40% - 100% of capital stack) Cap Rate Expansion +1.0% +2.0% +3.0% +4.0% Equity (36%) (63%) (83%) (100%) Debt - - - - Equity (2%) (33%) (57%) (76%) Debt - - - - Equity - (1%) (28%) (50%) Debt - - - - Illustrative Example
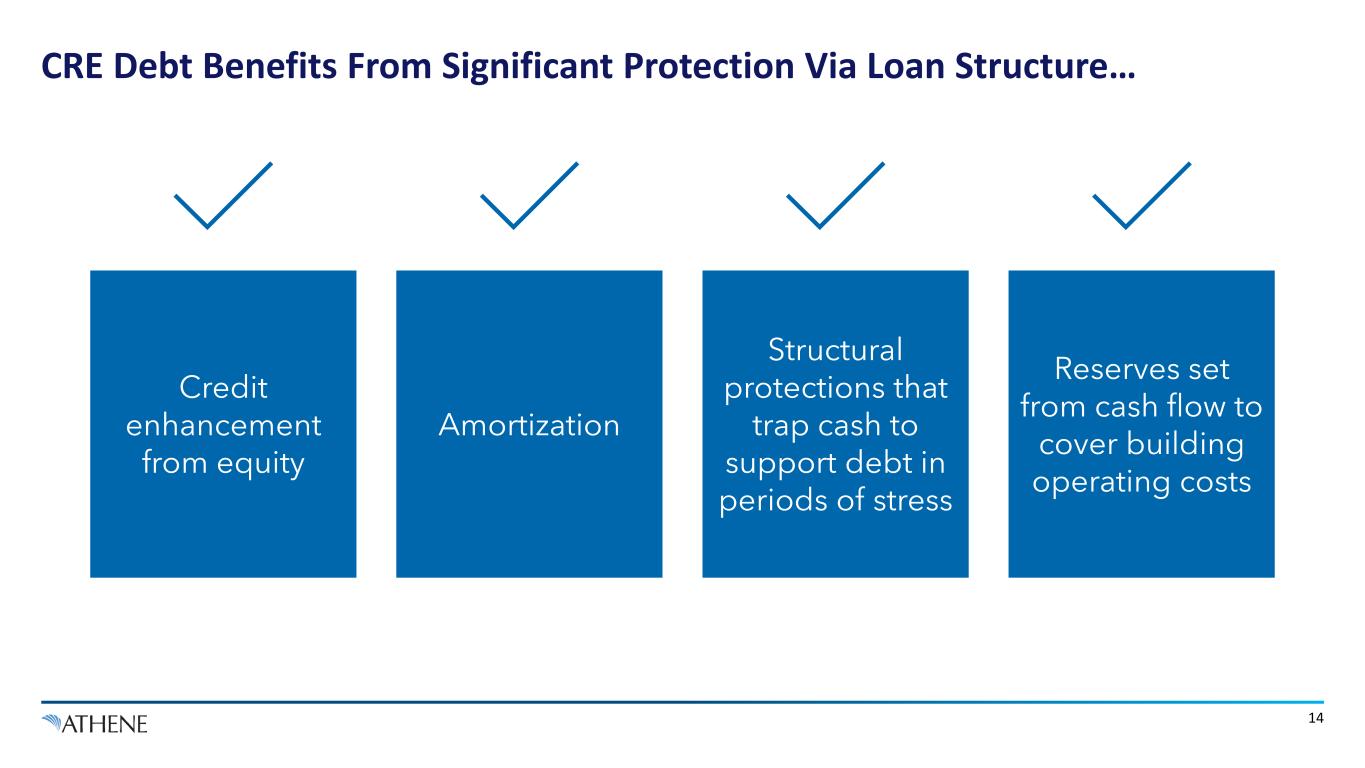
Credit enhancement from equity Amortization Structural protections that trap cash to support debt in periods of stress Reserves set from cash flow to cover building operating costs CRE Debt Benefits From Significant Protection Via Loan Structure… 14
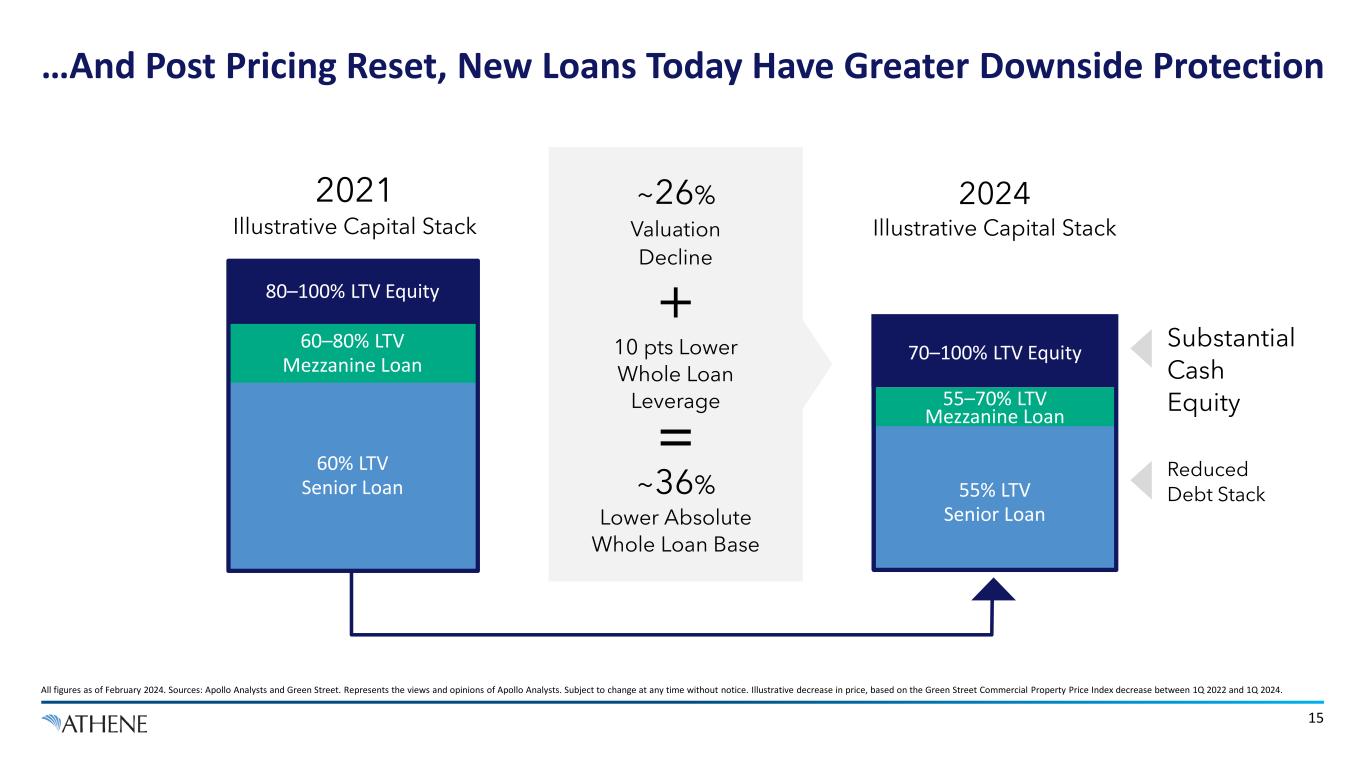
15 …And Post Pricing Reset, New Loans Today Have Greater Downside Protection All figures as of February 2024. Sources: Apollo Analysts and Green Street. Represents the views and opinions of Apollo Analysts. Subject to change at any time without notice. Illustrative decrease in price, based on the Green Street Commercial Property Price Index decrease between 1Q 2022 and 1Q 2024. 2021 Illustrative Capital Stack 2024 Illustrative Capital Stack Substantial Cash Equity Reduced Debt Stack 60% LTV Senior Loan 60–80% LTV Mezzanine Loan 80–100% LTV Equity ~26% Valuation Decline 10 pts Lower Whole Loan Leverage ~36% Lower Absolute Whole Loan Base 55% LTV Senior Loan 55–70% LTV Mezzanine Loan 70–100% LTV Equity

Athene’s CML Portfolio
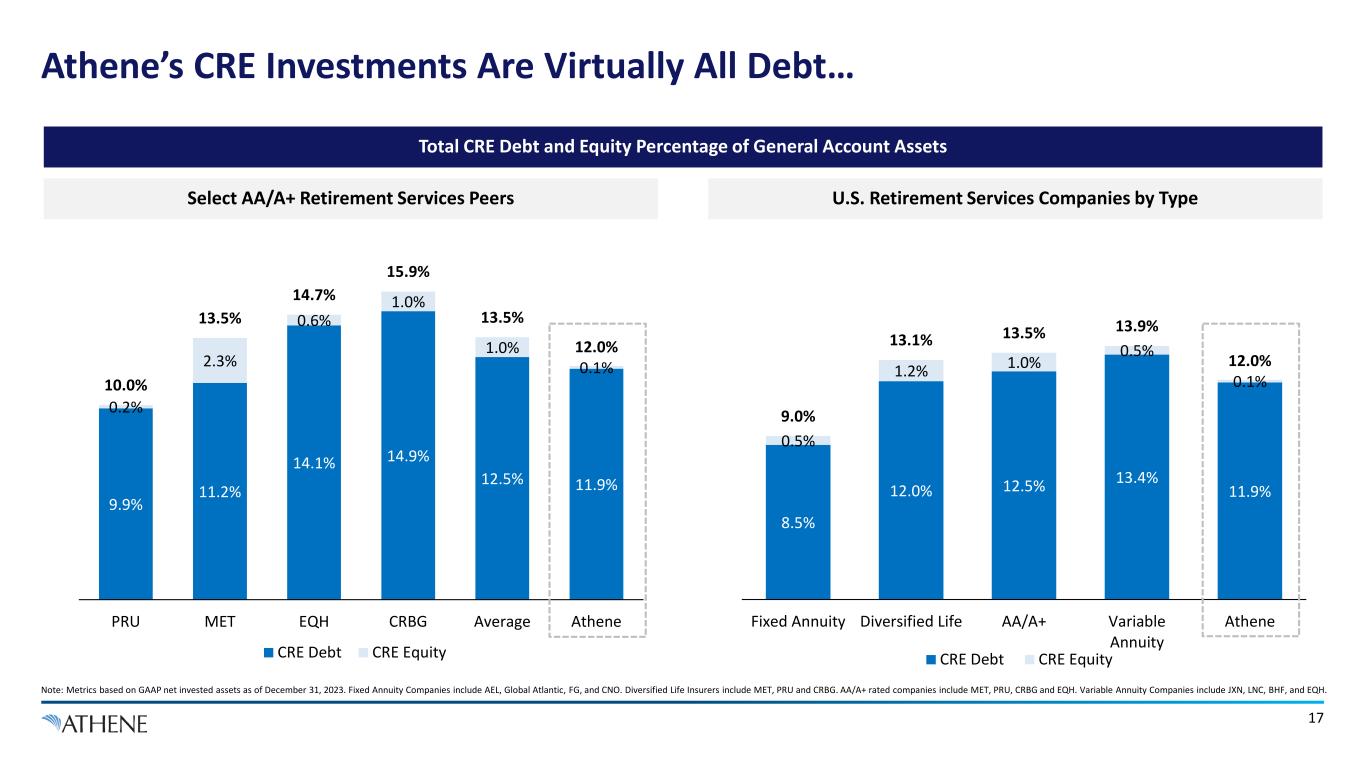
8.5% 12.0% 12.5% 13.4% 11.9% 0.5% 1.2% 1.0% 0.5% 0.1% 9.0% 13.1% 13.5% 13.9% 12.0% Fixed Annuity Diversified Life AA/A+ Variable Annuity Athene CRE Debt CRE Equity 9.9% 11.2% 14.1% 14.9% 12.5% 11.9% 0.2% 2.3% 0.6% 1.0% 1.0% 0.1% 10.0% 13.5% 14.7% 15.9% 13.5% 12.0% PRU MET EQH CRBG Average Athene CRE Debt CRE Equity Athene’s CRE Investments Are Virtually All Debt… Note: Metrics based on GAAP net invested assets as of December 31, 2023. Fixed Annuity Companies include AEL, Global Atlantic, FG, and CNO. Diversified Life Insurers include MET, PRU and CRBG. AA/A+ rated companies include MET, PRU, CRBG and EQH. Variable Annuity Companies include JXN, LNC, BHF, and EQH. Total CRE Debt and Equity Percentage of General Account Assets Select AA/A+ Retirement Services Peers U.S. Retirement Services Companies by Type 17
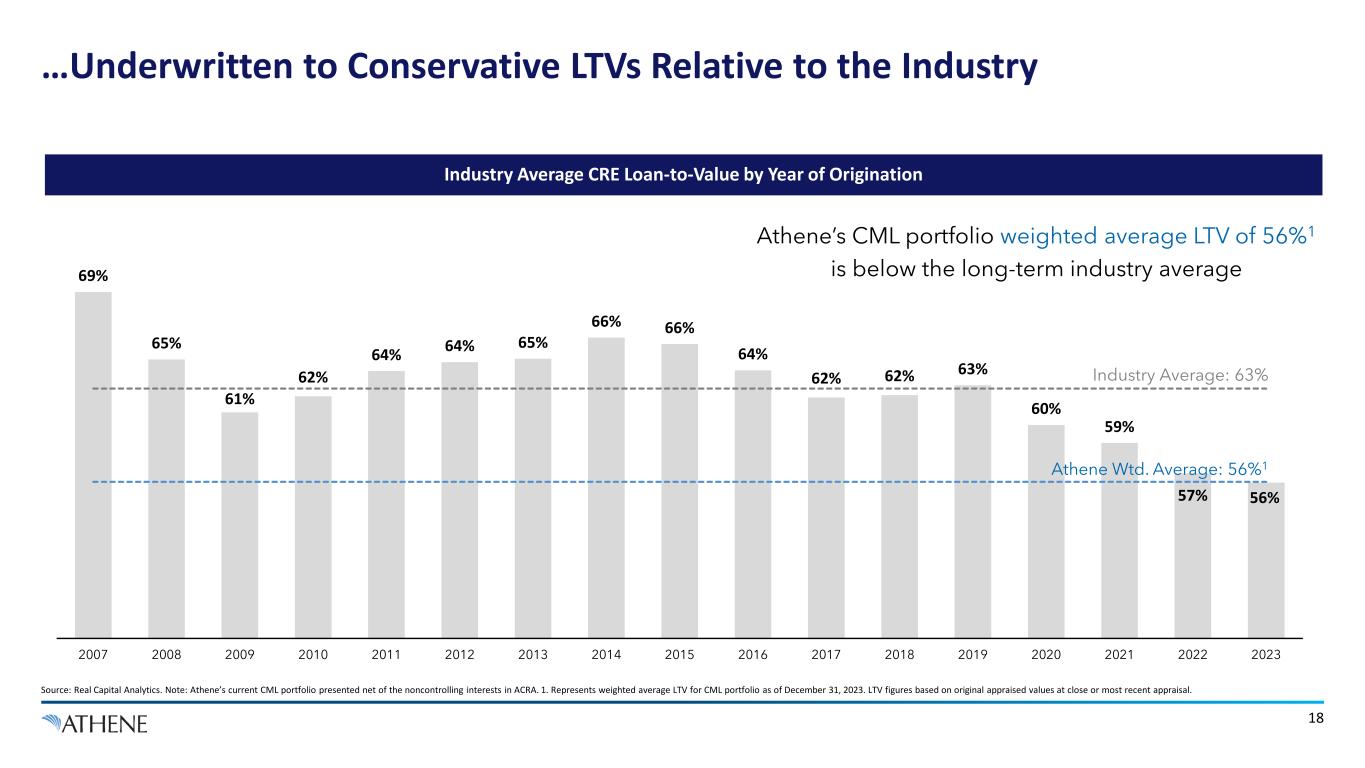
69% 65% 61% 62% 64% 64% 65% 66% 66% 64% 62% 62% 63% 60% 59% 57% 56% 2007 2008 2009 2010 2011 2012 2013 2014 2015 2016 2017 2018 2019 2020 2021 2022 2023 …Underwritten to Conservative LTVs Relative to the Industry Source: Real Capital Analytics. Note: Athene’s current CML portfolio presented net of the noncontrolling interests in ACRA. 1. Represents weighted average LTV for CML portfolio as of December 31, 2023. LTV figures based on original appraised values at close or most recent appraisal. 18 Industry Average CRE Loan-to-Value by Year of Origination Athene’s CML portfolio weighted average LTV of 56%1 is below the long-term industry average Industry Average: 63% Athene Wtd. Average: 56%1
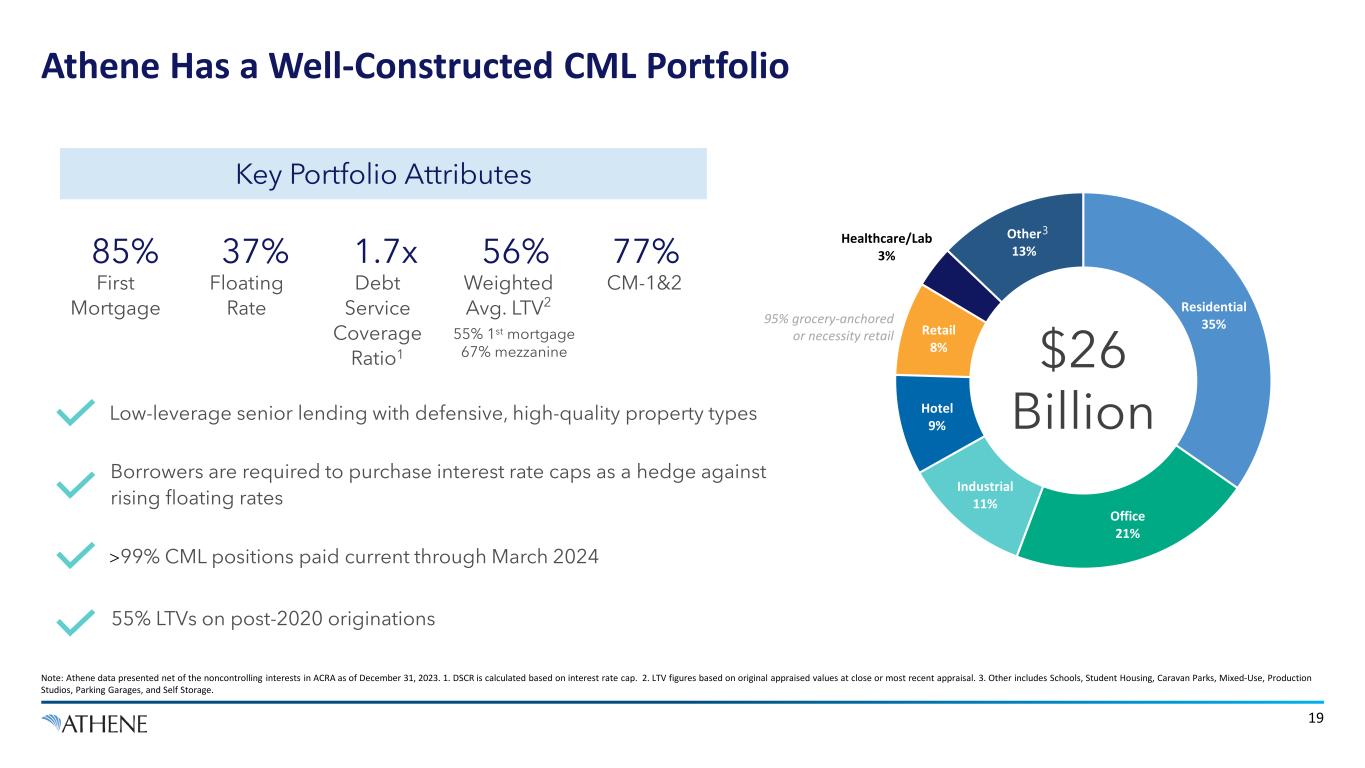
Athene Has a Well-Constructed CML Portfolio Residential 35% Office 21% Industrial 11% Hotel 9% Retail 8% Healthcare/Lab 3% Other 13% Note: Athene data presented net of the noncontrolling interests in ACRA as of December 31, 2023. 1. DSCR is calculated based on interest rate cap. 2. LTV figures based on original appraised values at close or most recent appraisal. 3. Other includes Schools, Student Housing, Caravan Parks, Mixed-Use, Production Studios, Parking Garages, and Self Storage. 19 Key Portfolio Attributes Low-leverage senior lending with defensive, high-quality property types Borrowers are required to purchase interest rate caps as a hedge against rising floating rates $26 Billion 3 >99% CML positions paid current through March 2024 85% First Mortgage 1.7x Debt Service Coverage Ratio1 56% Weighted Avg. LTV2 77% CM-1&2 37% Floating Rate 55% 1st mortgage 67% mezzanine 55% LTVs on post-2020 originations 95% grocery-anchored or necessity retail
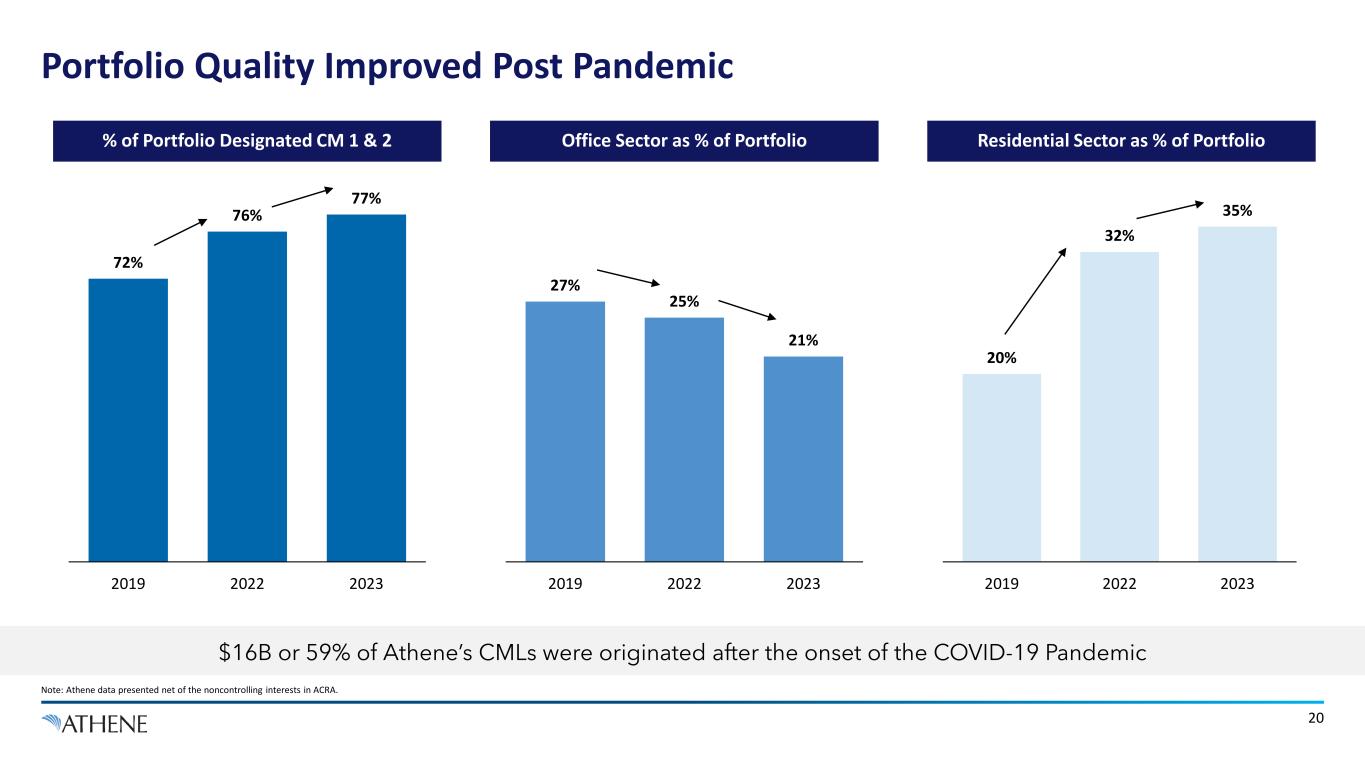
Portfolio Quality Improved Post Pandemic Note: Athene data presented net of the noncontrolling interests in ACRA. 20 $16B or 59% of Athene’s CMLs were originated after the onset of the COVID-19 Pandemic % of Portfolio Designated CM 1 & 2 Office Sector as % of Portfolio Residential Sector as % of Portfolio 72% 76% 77% 2019 2022 2023 27% 25% 21% 2019 2022 2023 20% 32% 35% 2019 2022 2023
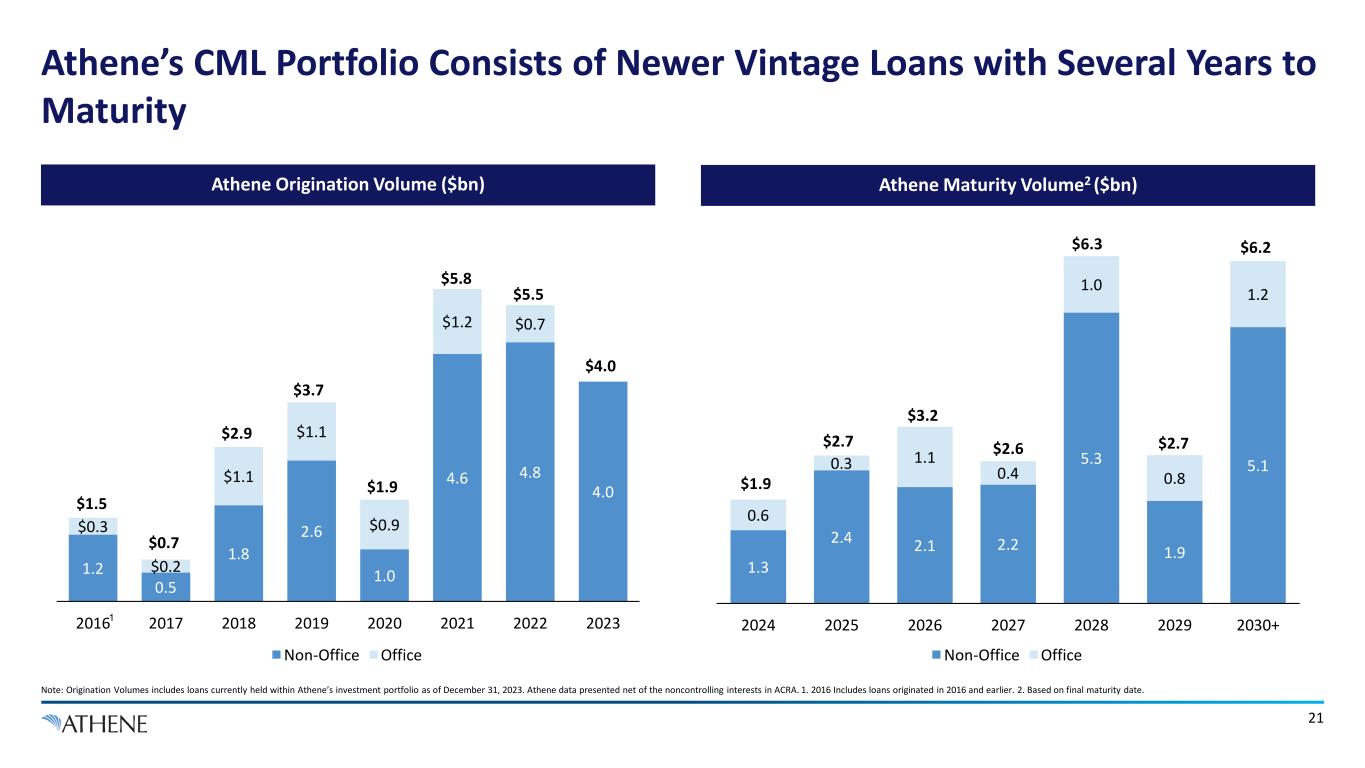
Athene Origination Volume ($bn) Athene’s CML Portfolio Consists of Newer Vintage Loans with Several Years to Maturity Note: Origination Volumes includes loans currently held within Athene’s investment portfolio as of December 31, 2023. Athene data presented net of the noncontrolling interests in ACRA. 1. 2016 Includes loans originated in 2016 and earlier. 2. Based on final maturity date. 21 Athene Maturity Volume2 ($bn) 1.2 0.5 1.8 2.6 1.0 4.6 4.8 4.0 $0.3 $0.2 $1.1 $1.1 $0.9 $1.2 $0.7 2016 2017 2018 2019 2020 2021 2022 2023 $1.5 $0.7 $2.9 $3.7 $1.9 $5.8 $5.5 $4.0 1.3 2.4 2.1 2.2 5.3 1.9 5.1 0.6 0.3 1.1 0.4 1.0 0.8 1.2 2024 2025 2026 2027 2028 2029 2030+ $1.9 $2.7 $3.2 $2.6 $6.3 $6.2 $2.7 Non-Office Office Non-Office Office 1
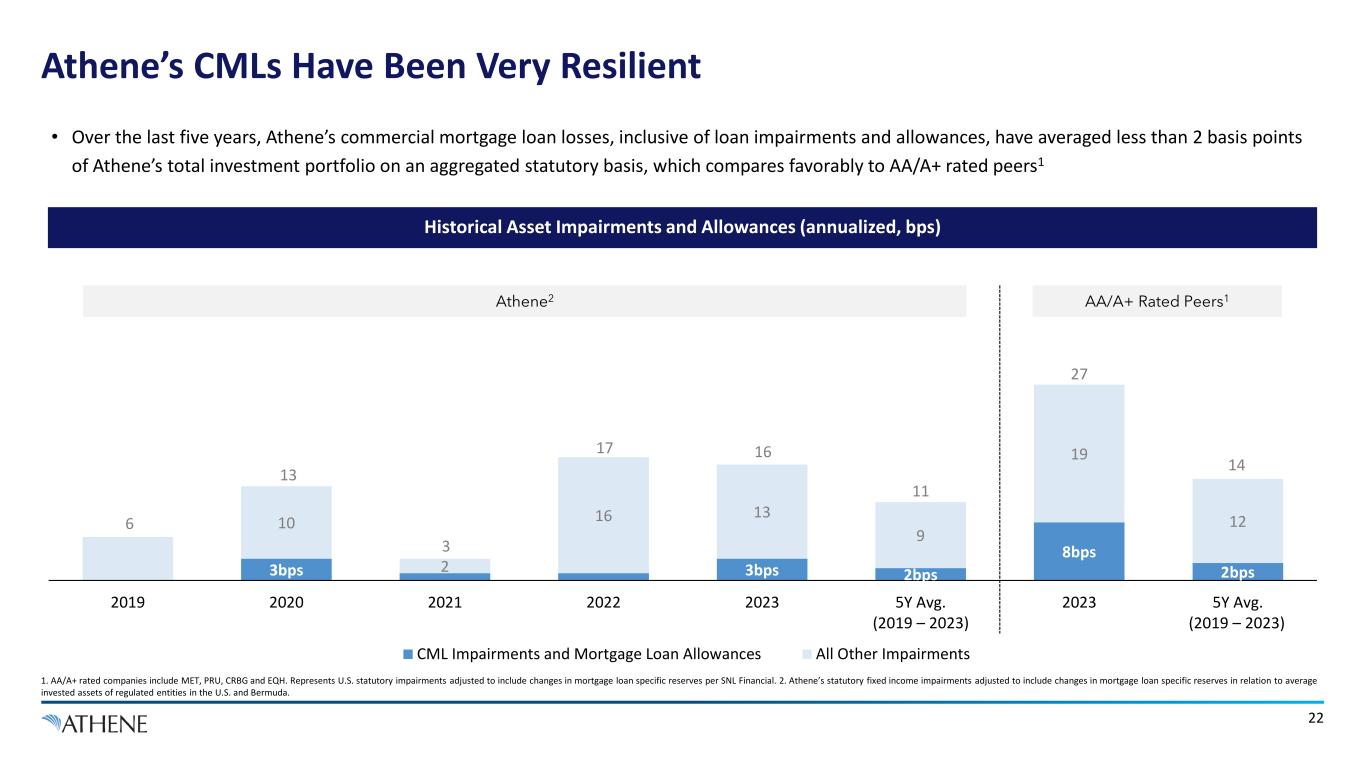
Athene’s CMLs Have Been Very Resilient 1. AA/A+ rated companies include MET, PRU, CRBG and EQH. Represents U.S. statutory impairments adjusted to include changes in mortgage loan specific reserves per SNL Financial. 2. Athene’s statutory fixed income impairments adjusted to include changes in mortgage loan specific reserves in relation to average invested assets of regulated entities in the U.S. and Bermuda. 22 • Over the last five years, Athene’s commercial mortgage loan losses, inclusive of loan impairments and allowances, have averaged less than 2 basis points of Athene’s total investment portfolio on an aggregated statutory basis, which compares favorably to AA/A+ rated peers1 Historical Asset Impairments and Allowances (annualized, bps) 3bps 3bps 2bps 8bps 2bps 10 2 16 13 9 19 12 2019 2020 2021 2022 2023 5Y Avg. 2023 5Y Avg. CML Impairments and Mortgage Loan Allowances All Other Impairments 6 13 3 17 16 11 14 27 AA/A+ Rated Peers1Athene2 (2019 – 2023)(2019 – 2023)
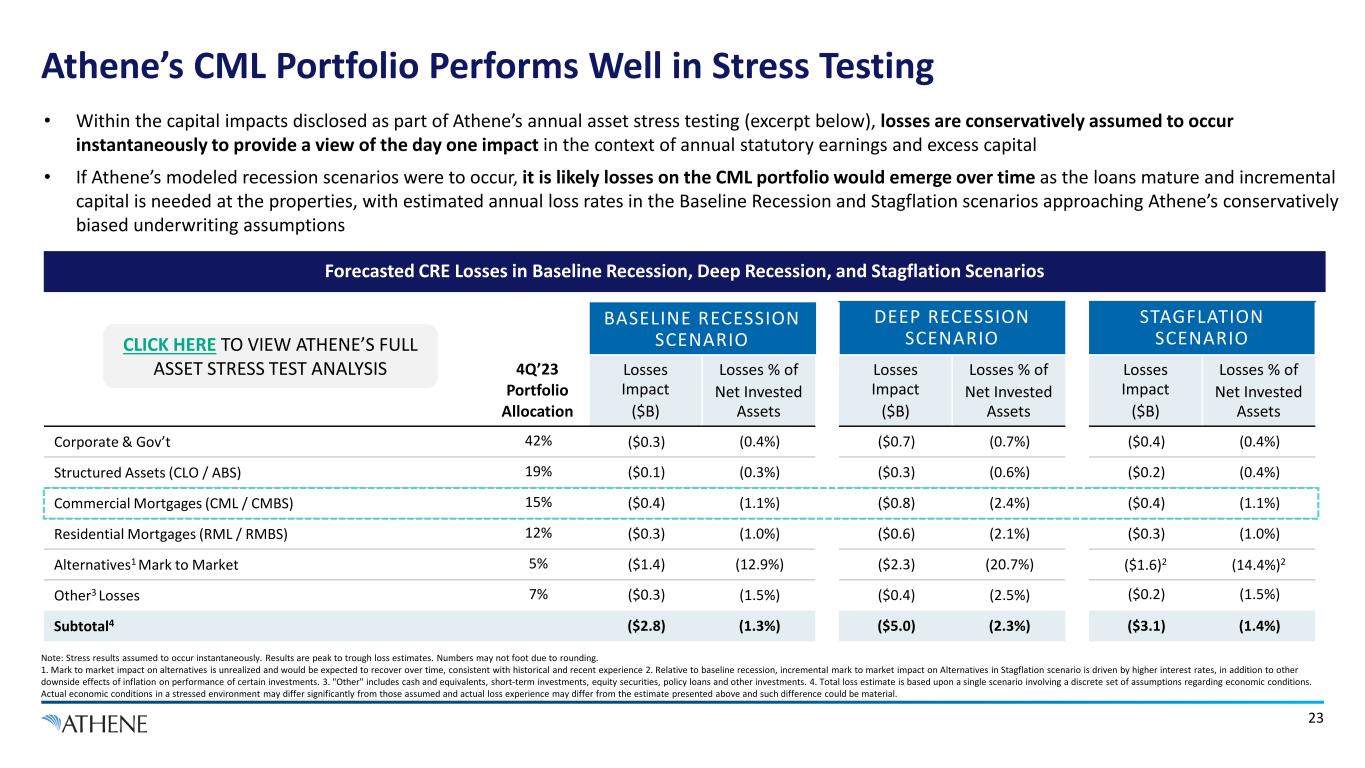
4Q’23 Portfolio Allocation BASELINE RECESSION SCENARIO DEEP RECESSION SCENARIO STAGFLATION SCENARIO Losses Impact ($B) Losses % of Net Invested Assets Losses Impact ($B) Losses % of Net Invested Assets Losses Impact ($B) Losses % of Net Invested Assets Corporate & Gov’t 42% ($0.3) (0.4%) ($0.7) (0.7%) ($0.4) (0.4%) Structured Assets (CLO / ABS) 19% ($0.1) (0.3%) ($0.3) (0.6%) ($0.2) (0.4%) Commercial Mortgages (CML / CMBS) 15% ($0.4) (1.1%) ($0.8) (2.4%) ($0.4) (1.1%) Residential Mortgages (RML / RMBS) 12% ($0.3) (1.0%) ($0.6) (2.1%) ($0.3) (1.0%) Alternatives1 Mark to Market 5% ($1.4) (12.9%) ($2.3) (20.7%) ($1.6)2 (14.4%)2 Other3 Losses 7% ($0.3) (1.5%) ($0.4) (2.5%) ($0.2) (1.5%) Subtotal4 ($2.8) (1.3%) ($5.0) (2.3%) ($3.1) (1.4%) Athene’s CML Portfolio Performs Well in Stress Testing Note: Stress results assumed to occur instantaneously. Results are peak to trough loss estimates. Numbers may not foot due to rounding. 1. Mark to market impact on alternatives is unrealized and would be expected to recover over time, consistent with historical and recent experience 2. Relative to baseline recession, incremental mark to market impact on Alternatives in Stagflation scenario is driven by higher interest rates, in addition to other downside effects of inflation on performance of certain investments. 3. "Other" includes cash and equivalents, short-term investments, equity securities, policy loans and other investments. 4. Total loss estimate is based upon a single scenario involving a discrete set of assumptions regarding economic conditions. Actual economic conditions in a stressed environment may differ significantly from those assumed and actual loss experience may differ from the estimate presented above and such difference could be material. 23 Forecasted CRE Losses in Baseline Recession, Deep Recession, and Stagflation Scenarios • Within the capital impacts disclosed as part of Athene’s annual asset stress testing (excerpt below), losses are conservatively assumed to occur instantaneously to provide a view of the day one impact in the context of annual statutory earnings and excess capital • If Athene’s modeled recession scenarios were to occur, it is likely losses on the CML portfolio would emerge over time as the loans mature and incremental capital is needed at the properties, with estimated annual loss rates in the Baseline Recession and Stagflation scenarios approaching Athene’s conservatively biased underwriting assumptions CLICK HERE TO VIEW ATHENE’S FULL ASSET STRESS TEST ANALYSIS
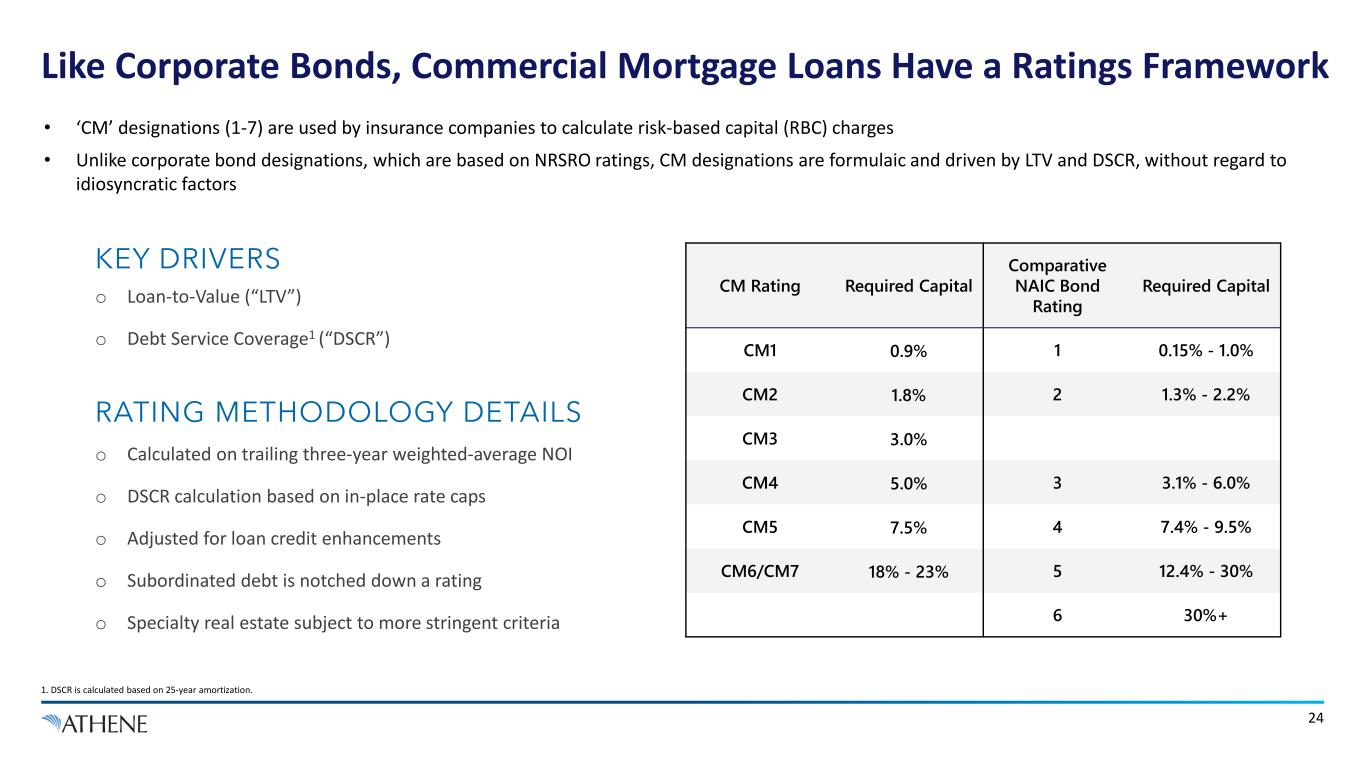
Like Corporate Bonds, Commercial Mortgage Loans Have a Ratings Framework 24 • ‘CM’ designations (1-7) are used by insurance companies to calculate risk-based capital (RBC) charges • Unlike corporate bond designations, which are based on NRSRO ratings, CM designations are formulaic and driven by LTV and DSCR, without regard to idiosyncratic factors RATING METHODOLOGY DETAILS o Calculated on trailing three-year weighted-average NOI o DSCR calculation based on in-place rate caps o Adjusted for loan credit enhancements o Subordinated debt is notched down a rating o Specialty real estate subject to more stringent criteria CM Rating Required Capital Comparative NAIC Bond Rating Required Capital CM1 0.9% 1 0.15% - 1.0% CM2 1.8% 2 1.3% - 2.2% CM3 3.0% CM4 5.0% 3 3.1% - 6.0% CM5 7.5% 4 7.4% - 9.5% CM6/CM7 18% - 23% 5 12.4% - 30% 6 30%+ KEY DRIVERS o Loan-to-Value (“LTV”) o Debt Service Coverage1 (“DSCR”) 1. DSCR is calculated based on 25-year amortization.
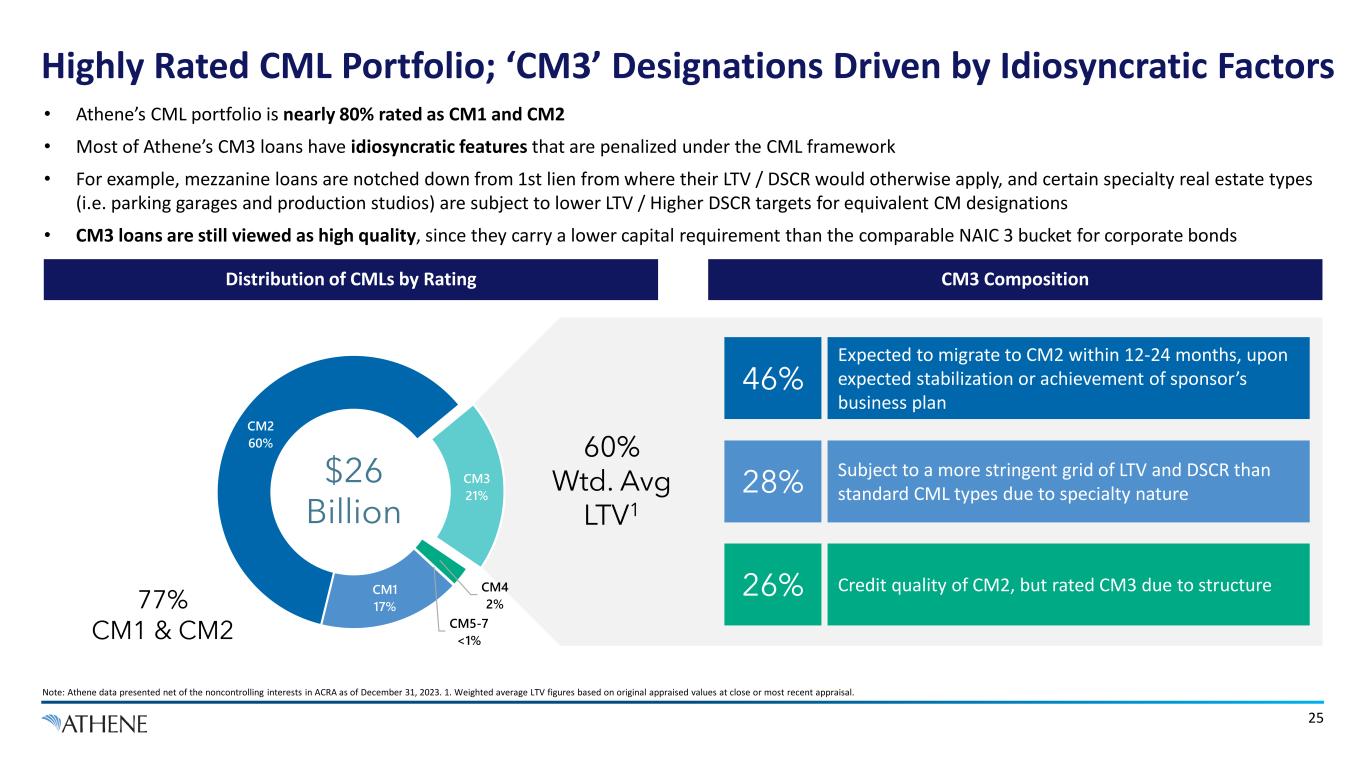
Highly Rated CML Portfolio; ‘CM3’ Designations Driven by Idiosyncratic Factors Note: Athene data presented net of the noncontrolling interests in ACRA as of December 31, 2023. 1. Weighted average LTV figures based on original appraised values at close or most recent appraisal. 25 • Athene’s CML portfolio is nearly 80% rated as CM1 and CM2 • Most of Athene’s CM3 loans have idiosyncratic features that are penalized under the CML framework • For example, mezzanine loans are notched down from 1st lien from where their LTV / DSCR would otherwise apply, and certain specialty real estate types (i.e. parking garages and production studios) are subject to lower LTV / Higher DSCR targets for equivalent CM designations • CM3 loans are still viewed as high quality, since they carry a lower capital requirement than the comparable NAIC 3 bucket for corporate bonds 60% Wtd. Avg LTV1 77% CM1 & CM2 Expected to migrate to CM2 within 12-24 months, upon expected stabilization or achievement of sponsor’s business plan Subject to a more stringent grid of LTV and DSCR than standard CML types due to specialty nature Credit quality of CM2, but rated CM3 due to structure 46% 28% 26% $26 Billion 3 CM3 CompositionDistribution of CMLs by Rating CM1 17% CM2 60% CM3 21% CM4 2% CM5-7 <1%

1.3% 3.0% 4.6%+1.7% +0.7% +1.7% 3.0% 3.7% 6.3% 2021 2022 2023 Avg UST by WAL Implied Athene Spread Athene is Well Positioned to Invest in the Higher Rate Environment Note: Includes transactions closed to date and in closing. Coupons of fixed-rate deals in closing shown at locked rates (as applicable) or based on current UST and contractual coupon floors. Numbers may not foot due to rounding. 1. Athene data presented gross of the noncontrolling interests in ACRA as of December 31, 2023. 2. Excludes UK/European CMLs. 3. Floating rate spreads do not include upfront or exit fees 4. Based on 5yr A-rated corporates from 2022-2023 and 8yr for 2021. 5. Based on 5yr fixed duration A-rated corporate from 2021-2023. 26 • Athene remained an active investor in CMLs and committed over $7.8 billion1 to well-structured CMLs secured by non-office collateral in 2023 • CMLs originated in 2023 have lower leverage and higher all-in rates than have been achieved over the past several years • While spreads within Athene’s floating-rate CML portfolio generally remain constant, floating-rate loans continue to benefit from rising base rates • Current projected returns for these loans are in excess of those forecasted at loan closing given increases in SOFR Weighted Average Rates on Athene Floating-Rate CMLs1,2Weighted Average Rates on Athene Fixed-Rate CMLs1 1.9% 3.8% 4.9%Avg. A-Rated Public Corporates Yield3: 1.2% 3.8% 4.9%Avg. A-Rated Public Corporates Yield4: 1.9% 5.1% +3.7% +3.9% +4.0% 3.7% 5.8% 9.1% 2021 2022 2023 Avg. SOFR Contractual Spread
Athene’s CML Office Investments

Class A CBD 76% Class B CBD 11% Suburban 10% Medical Office 3% Owner Occupied <1% Athene’s CML Office Investments are 100% Debt Note: Athene data presented net of the noncontrolling interests in ACRA as of December 31, 2023. 1. DSCR is calculated based on interest rate cap. 2. LTV figures based on original appraised values at close or most recent appraisal 3. CBD “Central Business District”. 28 Strong Credit Metrics and Structure 77% First Mortgage 1.9x Debt Service Coverage Ratio1 59% Weighted Avg LTV2 66% CM-1&2 30% CM-3 Proactive Asset Management Focus 62% leased to long-term credit-tenants with ~8 yr. wtd. avg. remaining lease term Office Portfolio Attributes Office Portfolio Composition $5.5B 3 59% 1st mortgage 61% mezzanine ~56% LTV 57% LTV, $12mm avg. loan size, Well-seasoned Concentrated in Loans with Class A Assets and Long- Term Leases 3
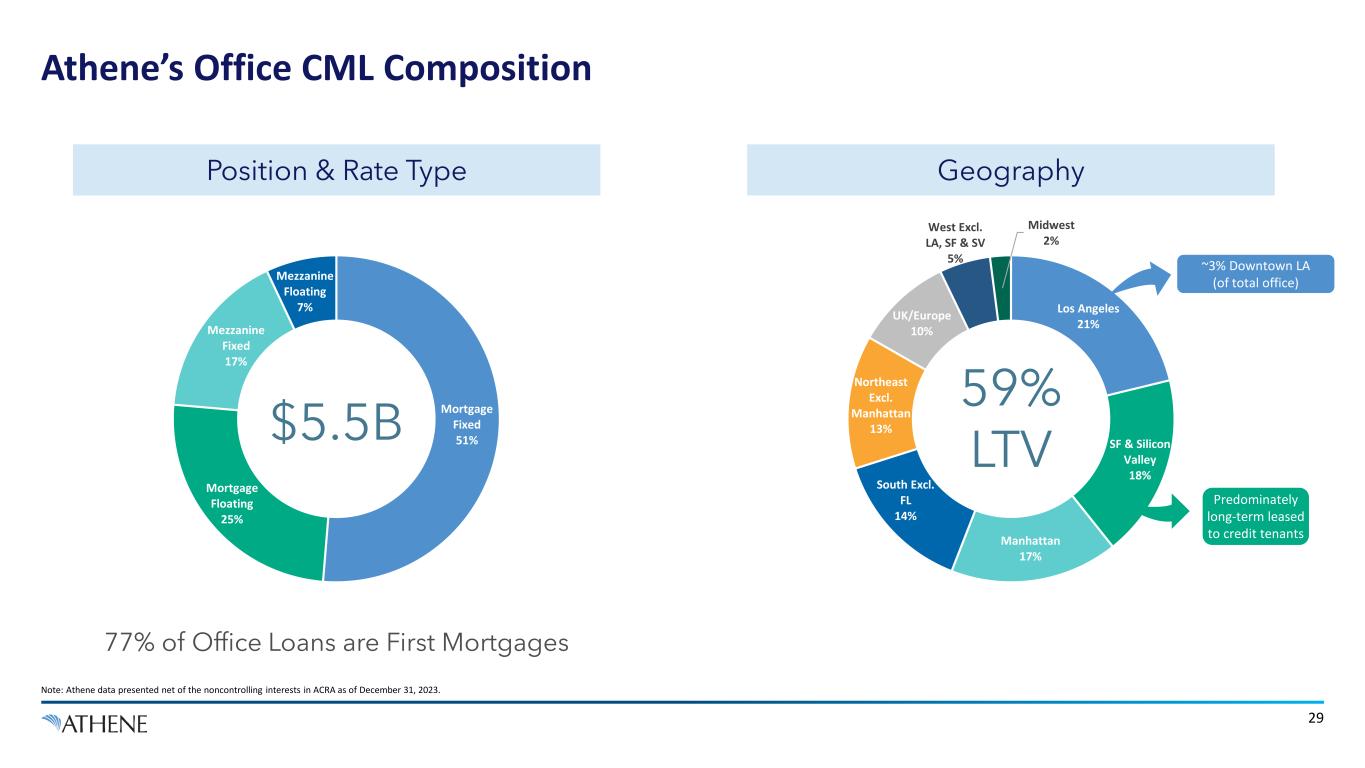
Los Angeles 21% SF & Silicon Valley 18% Manhattan 17% South Excl. FL 14% Northeast Excl. Manhattan 13% UK/Europe 10% West Excl. LA, SF & SV 5% Midwest 2% 59% LTV Mortgage Fixed 51% Mortgage Floating 25% Mezzanine Fixed 17% Mezzanine Floating 7% Athene’s Office CML Composition Note: Athene data presented net of the noncontrolling interests in ACRA as of December 31, 2023. 29 ~3% Downtown LA (of total office) 77% of Office Loans are First Mortgages $5.5B Position & Rate Type Geography Predominately long-term leased to credit tenants
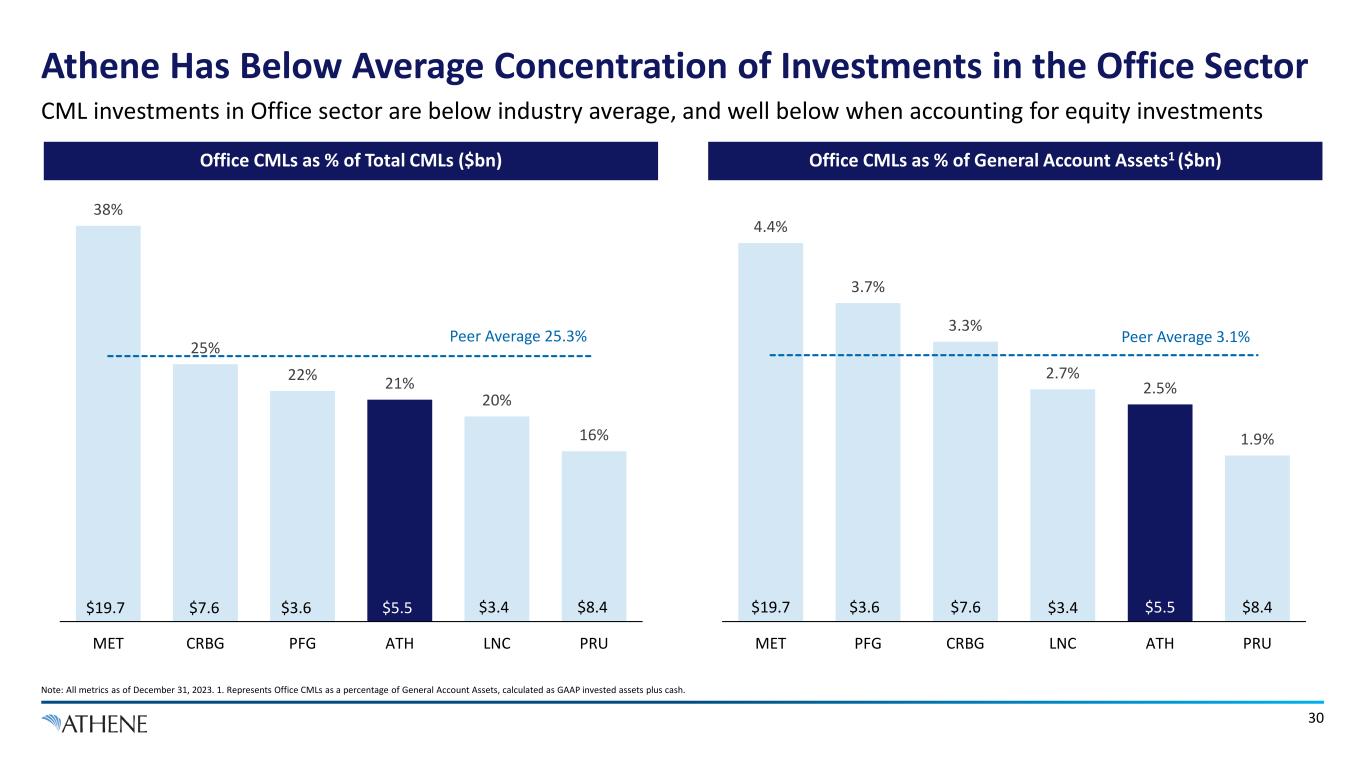
4.4% 3.7% 3.3% 2.7% 2.5% 1.9% Peer Average 3.1% MET PFG CRBG LNC ATH PRU 38% 25% 22% 21% 20% 16% Peer Average 25.3% MET CRBG PFG ATH LNC PRU Athene Has Below Average Concentration of Investments in the Office Sector Note: All metrics as of December 31, 2023. 1. Represents Office CMLs as a percentage of General Account Assets, calculated as GAAP invested assets plus cash. 30 Office CMLs as % of Total CMLs ($bn) Office CMLs as % of General Account Assets1 ($bn) CML investments in Office sector are below industry average, and well below when accounting for equity investments $19.7 $7.6 $3.6 $5.9 $5.5 $3.4 $8.4 $19.7 $3.6 $7.6 $3.4 $5.5 $8.4
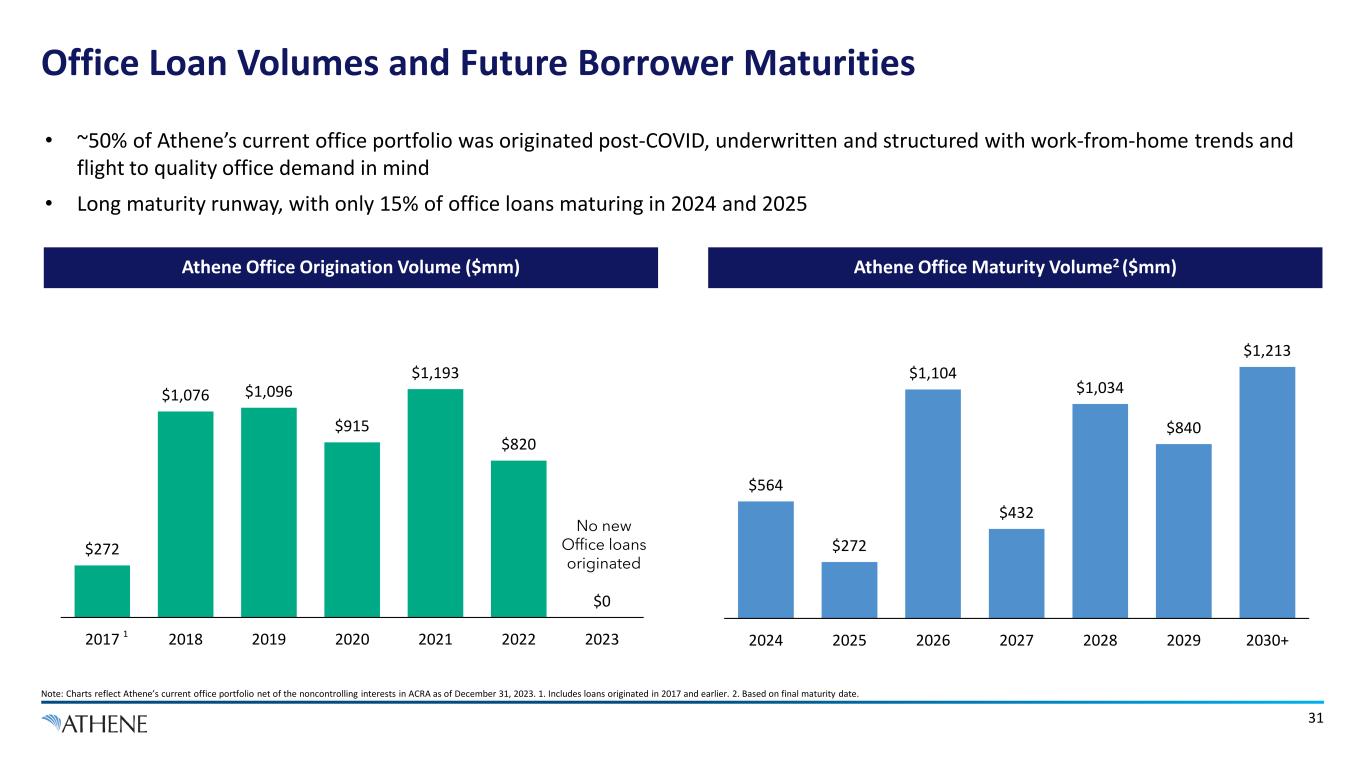
$272 $1,076 $1,096 $915 $1,193 $820 $0 2017 2018 2019 2020 2021 2022 2023 Office Loan Volumes and Future Borrower Maturities Note: Charts reflect Athene’s current office portfolio net of the noncontrolling interests in ACRA as of December 31, 2023. 1. Includes loans originated in 2017 and earlier. 2. Based on final maturity date. 31 • ~50% of Athene’s current office portfolio was originated post-COVID, underwritten and structured with work-from-home trends and flight to quality office demand in mind • Long maturity runway, with only 15% of office loans maturing in 2024 and 2025 No new Office loans originated Athene Office Maturity Volume2 ($mm)Athene Office Origination Volume ($mm) 1 $564 $272 $1,104 $432 $1,034 $840 $1,213 2024 2025 2026 2027 2028 2029 2030+
Athene’s CML Multifamily Investments

Athene’s CML Multifamily Investments are Well Diversified with Small Loan Size Note: Data presented net of the noncontrolling interests in ACRA as of December 31, 2023. 1. Mezzanine positions account for ~0.1% of Athene’s Multifamily portfolio. 2. DSCR is calculated based on interest rate cap. 3. LTV figures based on original appraised values at close or most recent appraisal. 33 Strong Credit Metrics and Structure ~100% First Mortgage1 1.7x Debt Service Coverage Ratio2 54% Weighted Avg LTV3 94% CM-1&2 6% CM-3 High Quality Sponsors with Deep Pockets Proactive Asset Management Focus Multifamily Portfolio Attributes Residential Portfolio Composition 3 3 Multifamily 93% Condo 5% Single Family Rental 2% $9.2B $12M Avg. Loan Size across 42 US States and the UK/EU
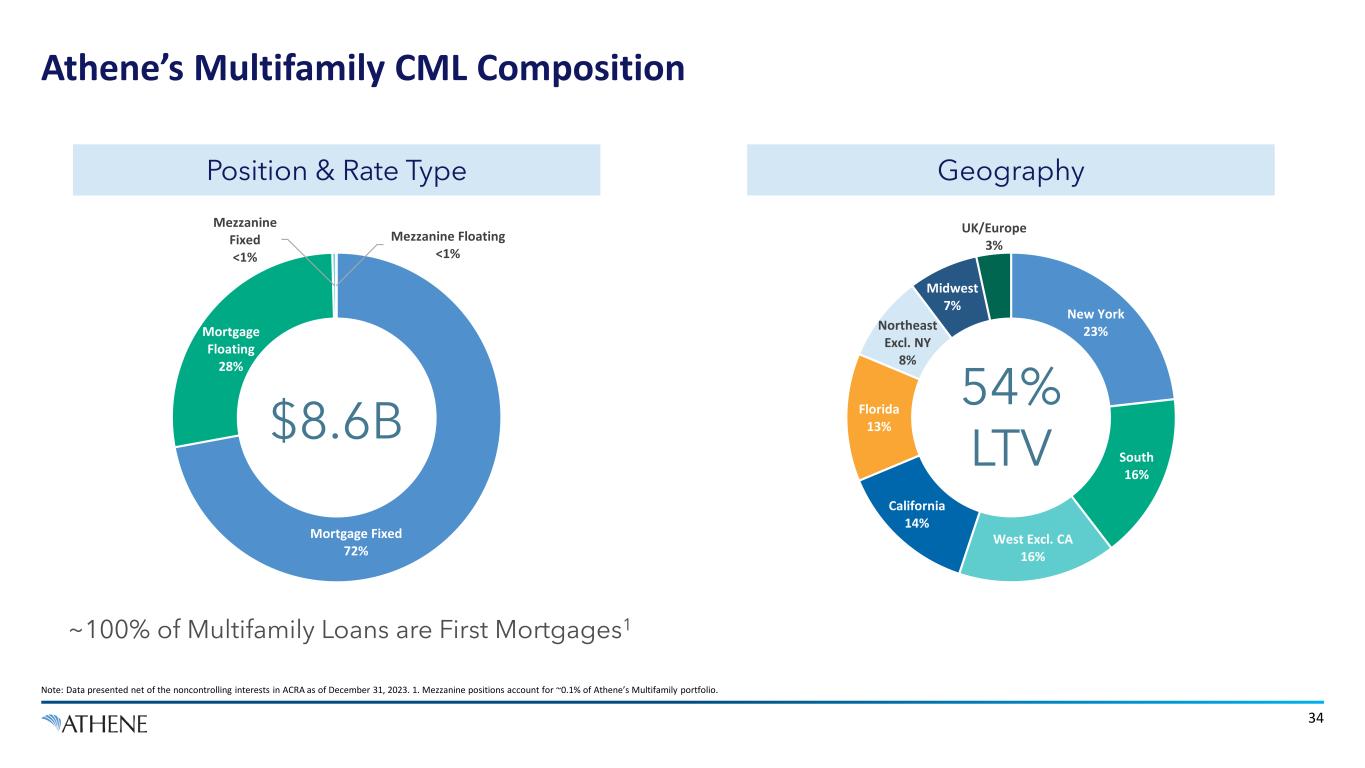
Mortgage Fixed 72% Mortgage Floating 28% Mezzanine Fixed <1% Mezzanine Floating <1% Athene’s Multifamily CML Composition Note: Data presented net of the noncontrolling interests in ACRA as of December 31, 2023. 1. Mezzanine positions account for ~0.1% of Athene’s Multifamily portfolio. 34 ~100% of Multifamily Loans are First Mortgages1 Position & Rate Type Geography $8.6B New York 23% South 16% West Excl. CA 16% California 14% Florida 13% Northeast Excl. NY 8% Midwest 7% UK/Europe 3% 54% LTV
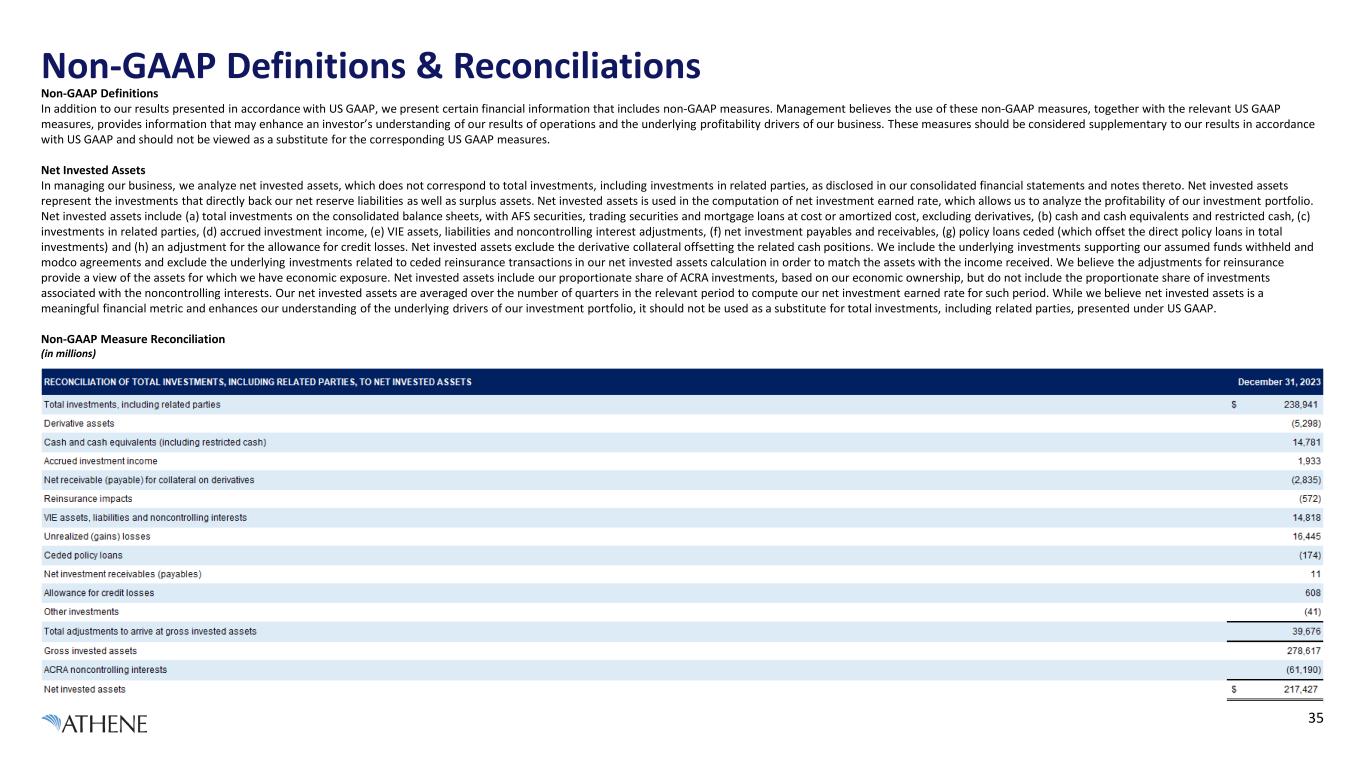
Non-GAAP Definitions & Reconciliations 35 Non-GAAP Definitions In addition to our results presented in accordance with US GAAP, we present certain financial information that includes non-GAAP measures. Management believes the use of these non-GAAP measures, together with the relevant US GAAP measures, provides information that may enhance an investor’s understanding of our results of operations and the underlying profitability drivers of our business. These measures should be considered supplementary to our results in accordance with US GAAP and should not be viewed as a substitute for the corresponding US GAAP measures. Net Invested Assets In managing our business, we analyze net invested assets, which does not correspond to total investments, including investments in related parties, as disclosed in our consolidated financial statements and notes thereto. Net invested assets represent the investments that directly back our net reserve liabilities as well as surplus assets. Net invested assets is used in the computation of net investment earned rate, which allows us to analyze the profitability of our investment portfolio. Net invested assets include (a) total investments on the consolidated balance sheets, with AFS securities, trading securities and mortgage loans at cost or amortized cost, excluding derivatives, (b) cash and cash equivalents and restricted cash, (c) investments in related parties, (d) accrued investment income, (e) VIE assets, liabilities and noncontrolling interest adjustments, (f) net investment payables and receivables, (g) policy loans ceded (which offset the direct policy loans in total investments) and (h) an adjustment for the allowance for credit losses. Net invested assets exclude the derivative collateral offsetting the related cash positions. We include the underlying investments supporting our assumed funds withheld and modco agreements and exclude the underlying investments related to ceded reinsurance transactions in our net invested assets calculation in order to match the assets with the income received. We believe the adjustments for reinsurance provide a view of the assets for which we have economic exposure. Net invested assets include our proportionate share of ACRA investments, based on our economic ownership, but do not include the proportionate share of investments associated with the noncontrolling interests. Our net invested assets are averaged over the number of quarters in the relevant period to compute our net investment earned rate for such period. While we believe net invested assets is a meaningful financial metric and enhances our understanding of the underlying drivers of our investment portfolio, it should not be used as a substitute for total investments, including related parties, presented under US GAAP. Non-GAAP Measure Reconciliation (in millions)