EX-99.2
Published on May 18, 2023

Perspectives on Athene’s Funding Model and Surrender Activity May 2023
Disclaimer This presentation does not constitute an offer to sell, or the solicitation of an offer to buy, any security of Athene Holding Ltd. (“Athene”). Unless the context requires otherwise, references in this presentation to “Apollo," "AGM" and "AGM HoldCo" refer to Apollo Global Management, Inc., together with its subsidiaries, and references in this presentation to “AAM” refer to Apollo Asset Management, Inc., a subsidiary of Apollo Global Management, Inc. This presentation contains, and certain oral statements made by Athene’s representatives from time to time may contain, forward-looking statements within the meaning of the Private Securities Litigation Reform Act of 1995, Section 27A of the Securities Act of 1933, as amended, and Section 21E of the Securities Exchange Act of 1934, as amended. Such statements are subject to risks, uncertainties and assumptions that could cause actual results, events and developments to differ materially from those set forth in, or implied by, such statements. These statements are based on the beliefs and assumptions of Athene’s management and the management of Athene’s subsidiaries. Generally, forward-looking statements include actions, events, results, strategies and expectations and are often identifiable by use of the words “believes,” “expects,” “intends,” “anticipates,” “plans,” “seeks,” “estimates,” “projects,” “may,” “will,” “could,” “might,” or “continues” or similar expressions. Forward looking statements within this presentation include, but are not limited to, benefits to be derived from Athene's capital allocation decisions; the anticipated performance of Athene's portfolio in certain stress or recessionary environments; the performance of Athene's business; general economic conditions; the failure to realize economic benefits from the merger with Apollo; expected future operating results; Athene's liquidity and capital resources; and other non- historical statements. Although Athene management believes that the expectations reflected in these forward-looking statements are reasonable, it can give no assurance that these expectations will prove to be correct. For a discussion of other risks and uncertainties related to Athene's forward-looking statements, see its annual report on Form 10-K for the year ended December 31, 2022, and quarterly report on Form 10-Q for the period ended March 31, 2023, which can be found at the SEC’s website at www.sec.gov. All forward-looking statements described herein are qualified by these cautionary statements and there can be no assurance that the actual results, events or developments referenced herein will occur or be realized. Athene does not undertake any obligation to update or revise forward-looking statements to reflect changed assumptions, the occurrence of unanticipated events or changes to future operating results. AHL adopted the US GAAP accounting standard related to Targeted Improvements to the Accounting for Long-Duration Contracts (LDTI) as of January 1, 2023, which required AHL to apply the new standard retrospectively back to January 1, 2022, the date of AHL’s merger with AGM. Certain 2022 US GAAP financial metrics and disclosures in this presentation have been retrospectively adjusted in accordance with the requirements of the adoption guidance of LDTI. Please refer to the discussion of Non-GAAP Measures and Definitions herein for additional information on items that are excluded from Athene’s non-GAAP measure of spread related earnings, which was retrospectively adjusted in accordance with the requirements of the adoption guidance of LDTI. Information contained herein may include information respecting prior performance of Athene. Information respecting prior performance, while a useful tool, is not necessarily indicative of actual results to be achieved in the future, which is dependent upon many factors, many of which are beyond Athene's control. The information contained herein is not a guarantee of future performance by Athene, and actual outcomes and results may differ materially from any historic, pro forma or projected financial results indicated herein. Certain of the financial information contained herein is unaudited or based on the application of non-GAAP financial measures. These non-GAAP financial measures should be considered in addition to and not as a substitute for, or superior to, financial measures presented in accordance with GAAP. Furthermore, certain financial information is based on estimates of management. These estimates, which are based on the reasonable expectations of management, are subject to change and there can be no assurance that they will prove to be correct. The information contained herein does not purport to be all-inclusive or contain all information that an evaluator may require in order to properly evaluate the business, prospects or value of Athene. Athene does not have any obligation to update this presentation and the information may change at any time without notice. Models that may be contained herein (the “Models”) are being provided for illustrative and discussion purposes only and are not intended to forecast or predict future events. Information provided in the Models may not reflect the most current data and is subject to change. The Models are based on estimates and assumptions that are also subject to change and may be subject to significant business, economic and competitive uncertainties, including numerous uncontrollable market and event driven situations. There is no guarantee that the information presented in the Models is accurate. Actual results may differ materially from those reflected and contemplated in such hypothetical, forward-looking information. Undue reliance should not be placed on such information and investors should not use the Models to make investment decisions. Athene has no duty to update the Models in the future. Certain of the information used in preparing this presentation was obtained from third parties or public sources. No representation or warranty, express or implied, is made or given by or on behalf of Athene or any other person as to the accuracy, completeness or fairness of such information, and no responsibility or liability is accepted for any such information. The contents of any website referenced in this presentation are not incorporated by reference. This document is not intended to be, nor should it be construed or used as, financial, legal, tax, insurance or investment advice. There can be no assurance that Athene will achieve its objectives. Past performance is not indicative of future success. All information is as of the dates indicated herein. 2
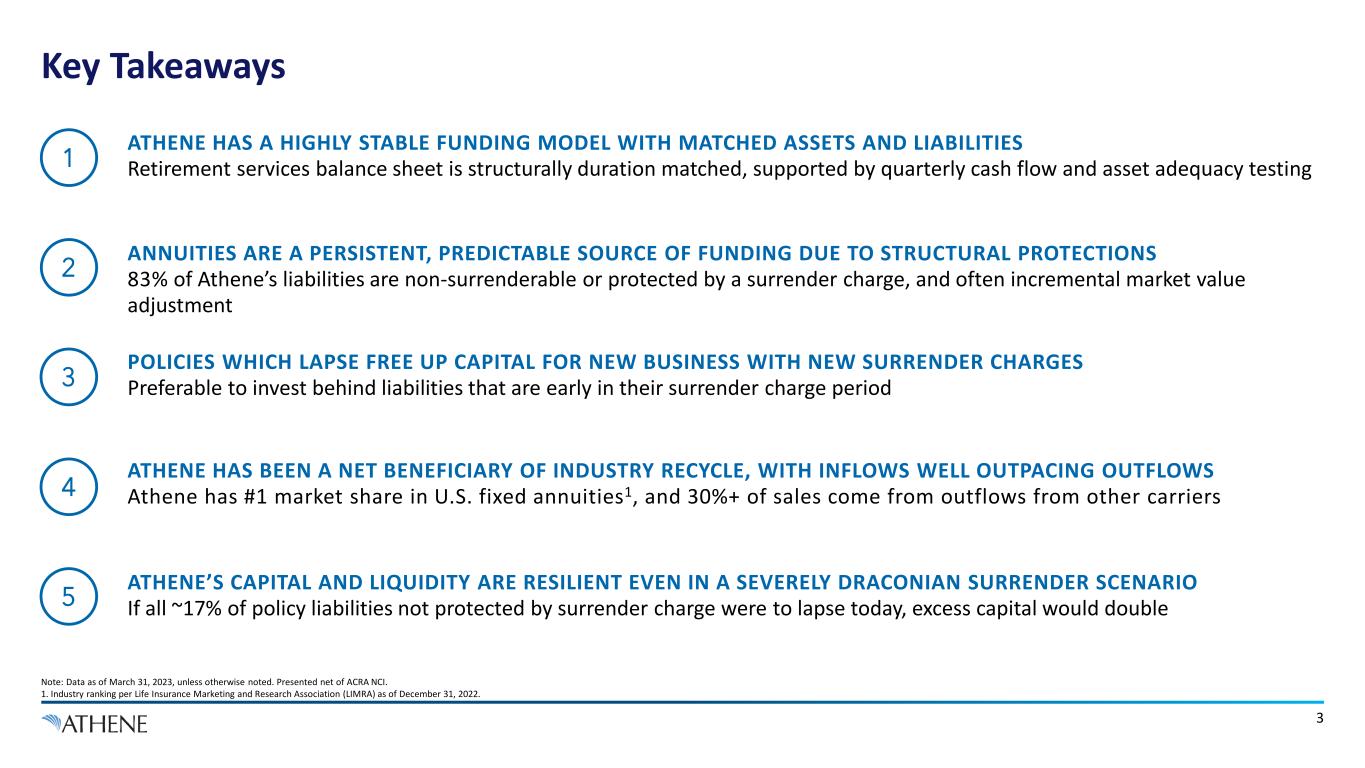
3 Key Takeaways Note: Data as of March 31, 2023, unless otherwise noted. Presented net of ACRA NCI. 1. Industry ranking per Life Insurance Marketing and Research Association (LIMRA) as of December 31, 2022. 3 1 ATHENE HAS BEEN A NET BENEFICIARY OF INDUSTRY RECYCLE, WITH INFLOWS WELL OUTPACING OUTFLOWS Athene has #1 market share in U.S. fixed annuities1, and 30%+ of sales come from outflows from other carriers4 2 ANNUITIES ARE A PERSISTENT, PREDICTABLE SOURCE OF FUNDING DUE TO STRUCTURAL PROTECTIONS 83% of Athene’s liabilities are non-surrenderable or protected by a surrender charge, and often incremental market value adjustment ATHENE’S CAPITAL AND LIQUIDITY ARE RESILIENT EVEN IN A SEVERELY DRACONIAN SURRENDER SCENARIO If all ~17% of policy liabilities not protected by surrender charge were to lapse today, excess capital would double5 POLICIES WHICH LAPSE FREE UP CAPITAL FOR NEW BUSINESS WITH NEW SURRENDER CHARGES Preferable to invest behind liabilities that are early in their surrender charge period ATHENE HAS A HIGHLY STABLE FUNDING MODEL WITH MATCHED ASSETS AND LIABILITIES Retirement services balance sheet is structurally duration matched, supported by quarterly cash flow and asset adequacy testing
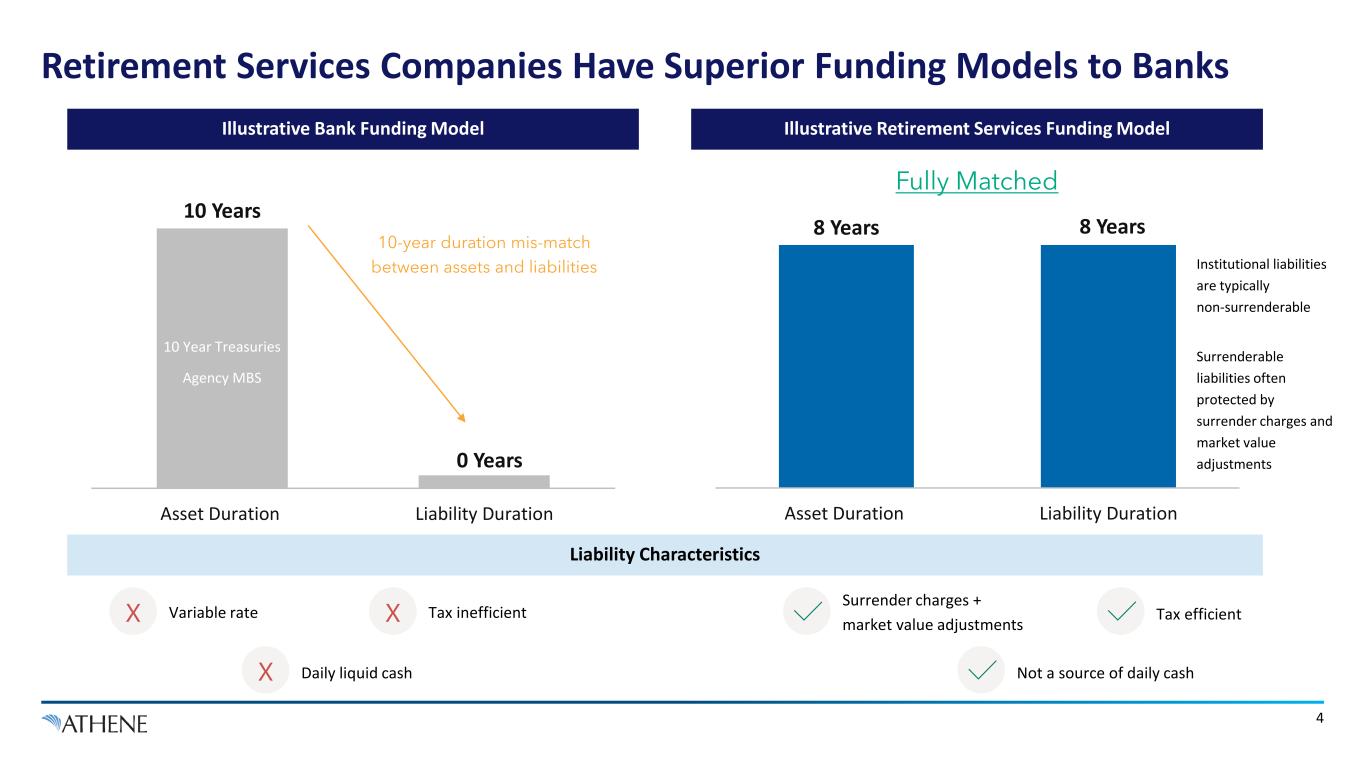
Retirement Services Companies Have Superior Funding Models to Banks Illustrative Bank Funding Model Illustrative Retirement Services Funding Model 10 Years 0 Years Asset Duration Liability Duration 10-year duration mis-match between assets and liabilities 10 Year Treasuries Agency MBS 8 Years 8 Years Asset Duration Liability Duration Fully Matched Institutional liabilities are typically non-surrenderable Surrenderable liabilities often protected by surrender charges and market value adjustments Liability Characteristics Not a source of daily cash Surrender charges + market value adjustments Tax efficient Daily liquid cashX Variable rateX Tax inefficientX 4
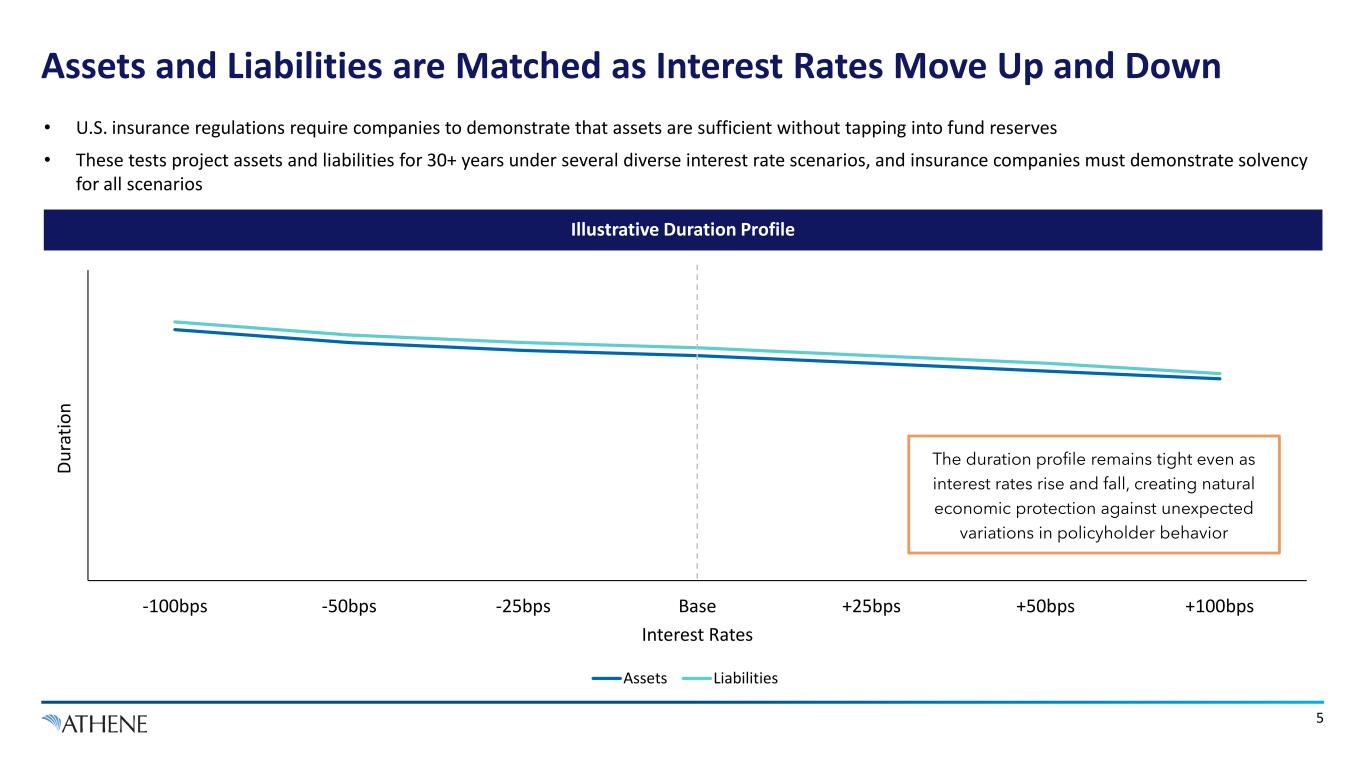
-100bps -50bps -25bps Base +25bps +50bps +100bps Du ra tio n Interest Rates Assets Liabilities Assets and Liabilities are Matched as Interest Rates Move Up and Down The duration profile remains tight even as interest rates rise and fall, creating natural economic protection against unexpected variations in policyholder behavior 5 • U.S. insurance regulations require companies to demonstrate that assets are sufficient without tapping into fund reserves • These tests project assets and liabilities for 30+ years under several diverse interest rate scenarios, and insurance companies must demonstrate solvency for all scenarios Illustrative Duration Profile
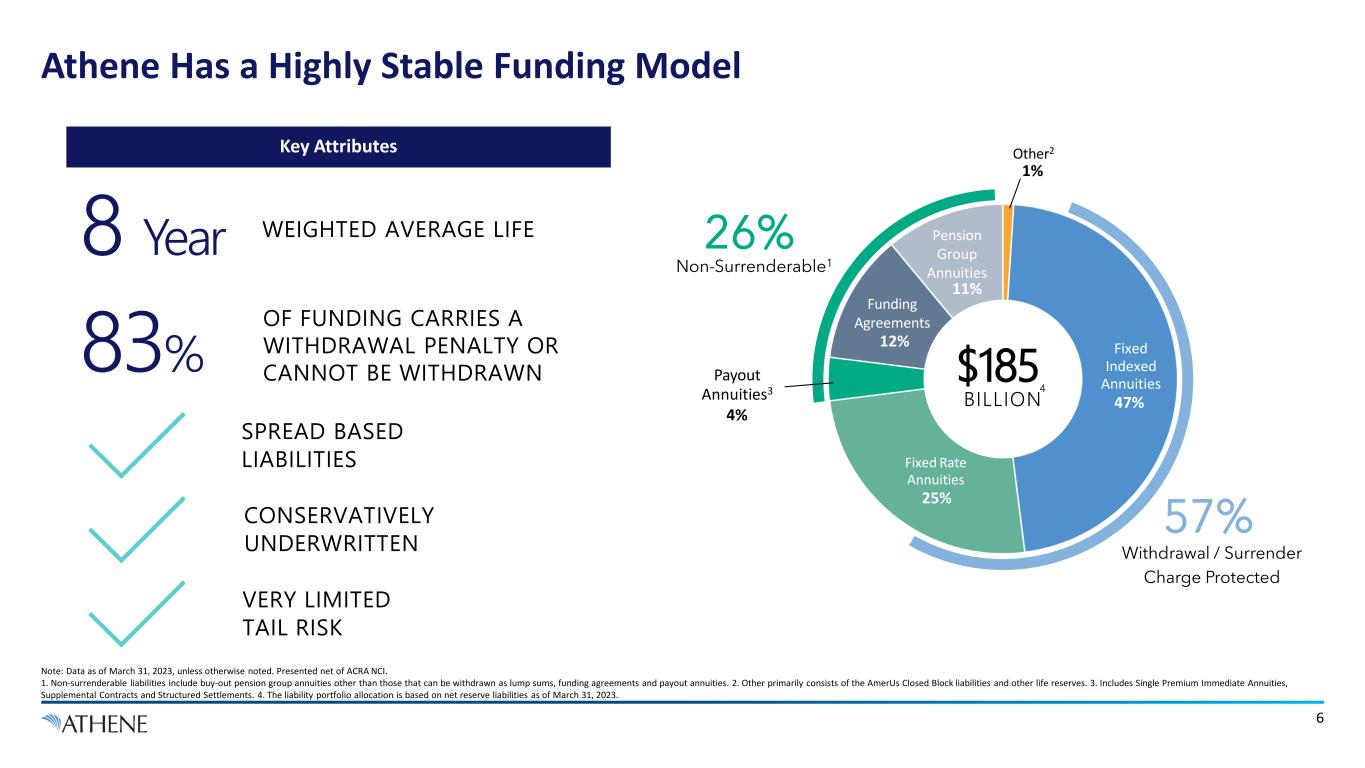
1% 47% 25% 4% 12% 11% Fixed Rate Annuities Athene Has a Highly Stable Funding Model Note: Data as of March 31, 2023, unless otherwise noted. Presented net of ACRA NCI. 1. Non-surrenderable liabilities include buy-out pension group annuities other than those that can be withdrawn as lump sums, funding agreements and payout annuities. 2. Other primarily consists of the AmerUs Closed Block liabilities and other life reserves. 3. Includes Single Premium Immediate Annuities, Supplemental Contracts and Structured Settlements. 4. The liability portfolio allocation is based on net reserve liabilities as of March 31, 2023. Pension Group Annuities Payout Annuities3 Fixed Indexed Annuities$185 BILLION 26% Non-Surrenderable1 OF FUNDING CARRIES A WITHDRAWAL PENALTY OR CANNOT BE WITHDRAWN83% SPREAD BASED LIABILITIES WEIGHTED AVERAGE LIFE8 Year 57% Withdrawal / Surrender Charge Protected Funding Agreements Other2Key Attributes 6 CONSERVATIVELY UNDERWRITTEN VERY LIMITED TAIL RISK 4
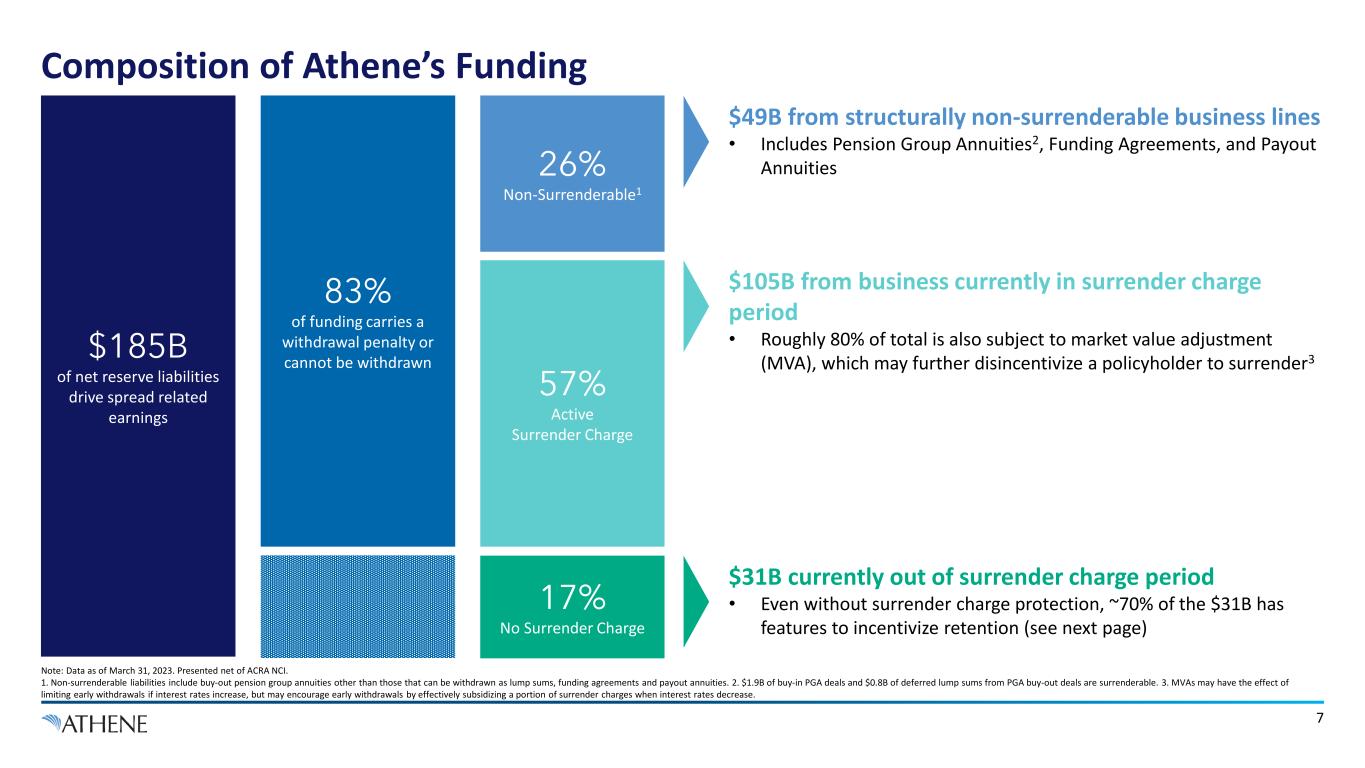
Composition of Athene’s Funding Note: Data as of March 31, 2023. Presented net of ACRA NCI. 1. Non-surrenderable liabilities include buy-out pension group annuities other than those that can be withdrawn as lump sums, funding agreements and payout annuities. 2. $1.9B of buy-in PGA deals and $0.8B of deferred lump sums from PGA buy-out deals are surrenderable. 3. MVAs may have the effect of limiting early withdrawals if interest rates increase, but may encourage early withdrawals by effectively subsidizing a portion of surrender charges when interest rates decrease. $185B of net reserve liabilities drive spread related earnings 26% Non-Surrenderable1 57% Active Surrender Charge 17% No Surrender Charge $31B currently out of surrender charge period • Even without surrender charge protection, ~70% of the $31B has features to incentivize retention (see next page) $105B from business currently in surrender charge period • Roughly 80% of total is also subject to market value adjustment (MVA), which may further disincentivize a policyholder to surrender3 $49B from structurally non-surrenderable business lines • Includes Pension Group Annuities2, Funding Agreements, and Payout Annuities 83% of funding carries a withdrawal penalty or cannot be withdrawn 7
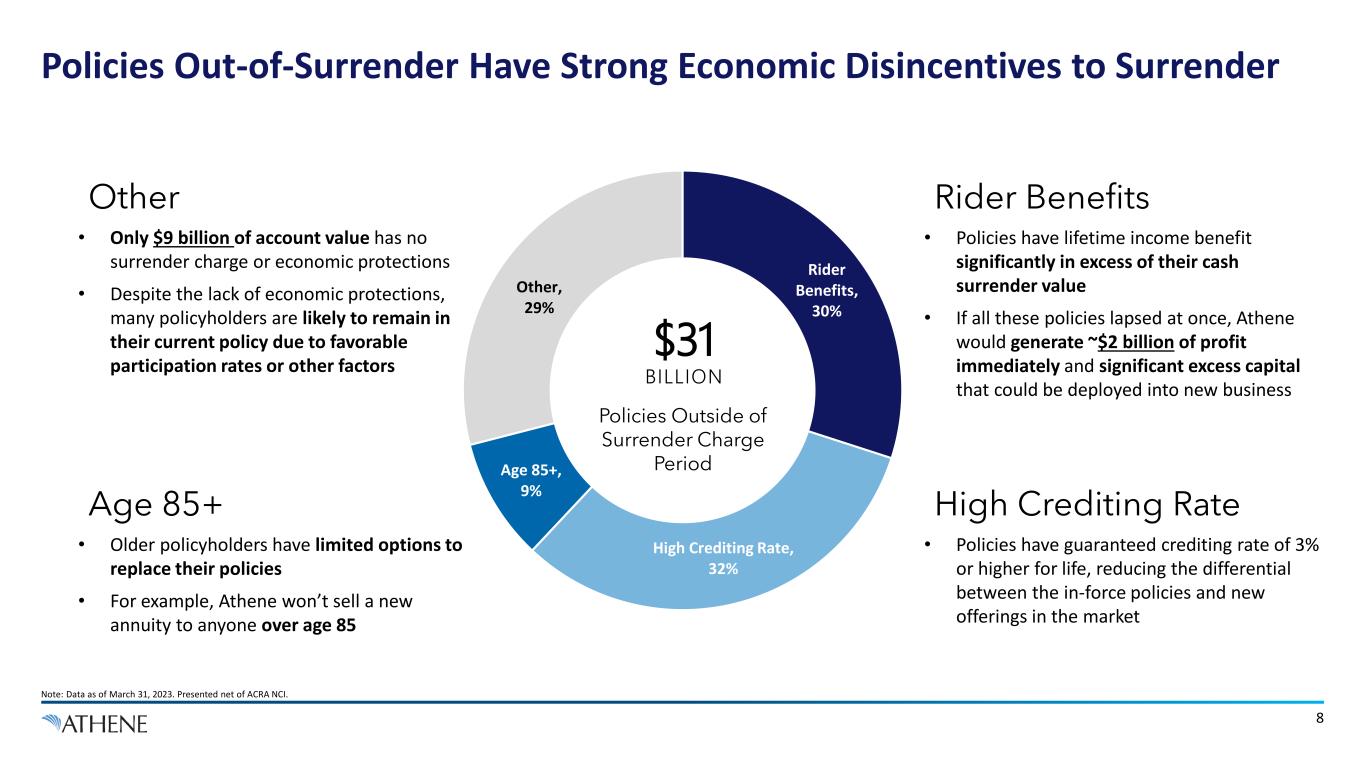
Rider Benefits, 30% High Crediting Rate, 32% Age 85+, 9% Other, 29% Policies Out-of-Surrender Have Strong Economic Disincentives to Surrender Note: Data as of March 31, 2023. Presented net of ACRA NCI. 8 Policies Outside of Surrender Charge Period $31 BILLION Rider Benefits • Policies have lifetime income benefit significantly in excess of their cash surrender value • If all these policies lapsed at once, Athene would generate ~$2 billion of profit immediately and significant excess capital that could be deployed into new business High Crediting Rate • Policies have guaranteed crediting rate of 3% or higher for life, reducing the differential between the in-force policies and new offerings in the market Age 85+ • Older policyholders have limited options to replace their policies • For example, Athene won’t sell a new annuity to anyone over age 85 Other • Only $9 billion of account value has no surrender charge or economic protections • Despite the lack of economic protections, many policyholders are likely to remain in their current policy due to favorable participation rates or other factors

Why Annuities are Inherently Sticky & Persistent

Key Features Make Annuity Products Particularly Sticky 1. MVAs may have the effect of limiting early withdrawals if interest rates increase but may encourage early withdrawals by effectively subsidizing a portion of surrender charges when interest rates decrease. 2. Calculated from figures disclosed in US Life Insurer Statutory filings as aggregated by SNL Financial. Calculation represents the annualized rate implied by quarterly total annuity surrender benefits and withdrawals for life contracts divided by beginning of period statutory reserves. Select US life insurers include AEL, AIG (L&R), AMP, BHF, CNO, F&G, GA, LNC, MET, PFG, PRU, RGA, VOYA. • Surrender charges (which are typically 5- 15% of contract value) provide structural protection from withdrawal • Many policies are also covered by a Market Value Adjustment (MVA) provision while in their surrender charge period • If corporate yields are higher at time of withdrawal than when contract was purchased, the MVA increases the surrender charge1 1 Structural Protections • Consumers use annuities as a tax deferred way to save for retirement, protect principal, and for retirement income • Consumers have been historically very averse to paying surrender charges • Advisors must demonstrate that moving a customer from one annuity to another is “suitable”, requiring documentation that proves the change is in the policyholder’s best interest, thereby discouraging moving customers while penalties apply 2 Fee-Averse Consumers 3 Policies are Designed to “Mature” • The industry is indifferent to surrenders once policies leave the surrender charge period, and will typically drop the yield offered on policies • Customers benefit from surrendering by reinvesting into a new product with higher new money rates • Retirement services companies benefit by redeploying capital from inefficient fully liquid liabilities to new, long duration policies 10 Over the last 20 years, the industry annual outflow rate on annuities has remained stable at ~9%2, in line with product lifecycle
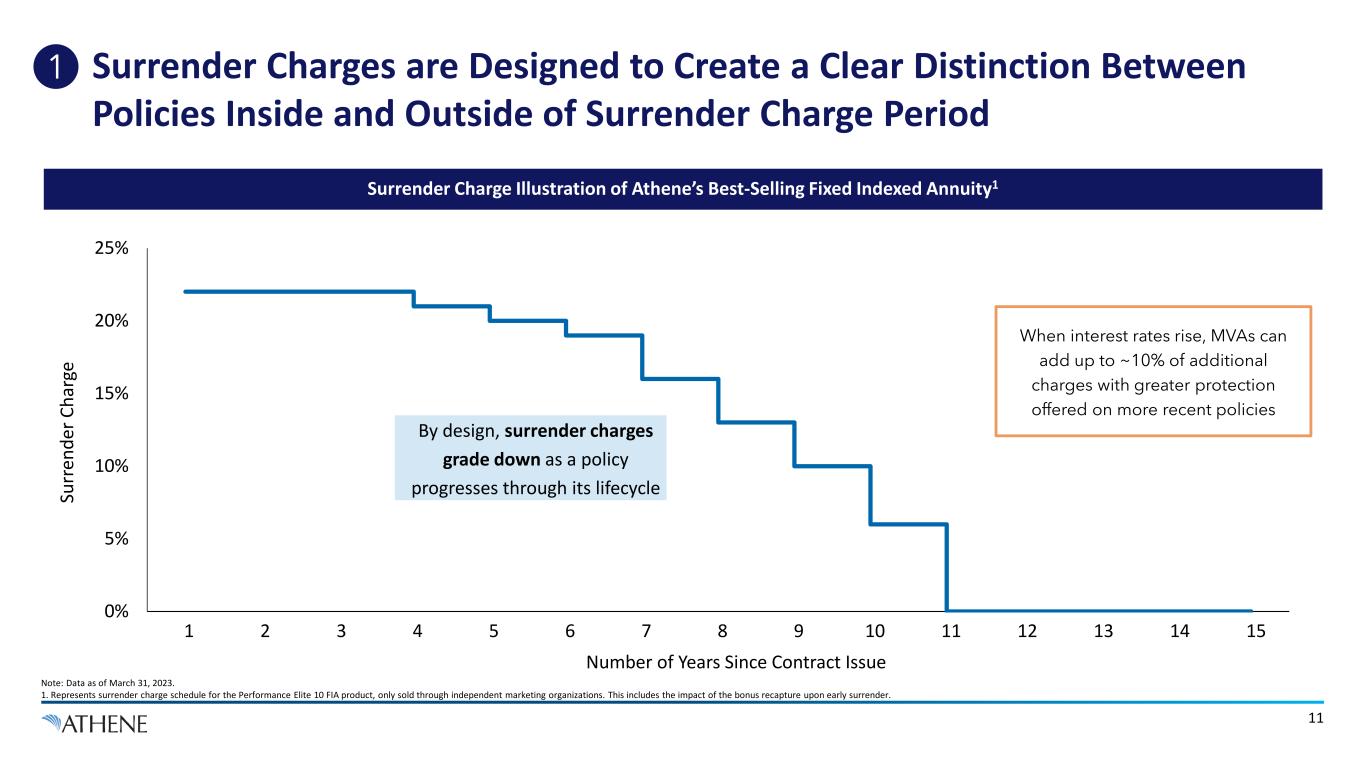
Surrender Charges are Designed to Create a Clear Distinction Between Policies Inside and Outside of Surrender Charge Period Note: Data as of March 31, 2023. 1. Represents surrender charge schedule for the Performance Elite 10 FIA product, only sold through independent marketing organizations. This includes the impact of the bonus recapture upon early surrender. 0% 5% 10% 15% 20% 25% 14-Mar 15-Mar 16-Mar 17-Mar 18-Mar 19-Mar 20-Mar 21-Mar 22-Mar 23-Mar 24-Mar 25-Mar 26-Mar 27-Mar 28-Mar Su rr en de r C ha rg e Number of Years Since Contract Issue When interest rates rise, MVAs can add up to ~10% of additional charges with greater protection offered on more recent policies 2 7 11108 9 12 13 1465431 15 11 By design, surrender charges grade down as a policy progresses through its lifecycle Surrender Charge Illustration of Athene’s Best-Selling Fixed Indexed Annuity1 1

$88k $89k $96k $107k $107k $93k $96k $104k $107k $111k $114k $118k $118k $118k 2017 2018 2019 2020 2021 2022 2023 MVA Increases as Interest Rates Rise Low Surrender Value at Inception Total Account Value $118k Less: Surrender Charge (8% of Account Value After 6 Years) ($10k) Less: Market Value Adjustment (A-rated 10yr corporate yield1) ($8k) Less: Bonus Adjustment (Premium bonus1 recaptured upon early surrenders) ($4k) Cash Surrender Value in 2023 (81% of Account Value) $96k Surrender Charges + MVA is a Powerful Combination Note: Example is based on Athene’s Performance Elite 10, issued on 10/25/2017. Assumes $100k initial premium, a 4% premium bonus, and a 1-year S&P 500 strategy with a 3.25% cap. The combination of surrender charges and market value adjustments are capped by standard non-forfeiture law, which sets a floor on the cash surrender value of 87.5% of initial premium, accruing at a minimum valuation rates set in state insurance law. 1. Market value adjustment factor is calculated as 1 + the 10yr A-rated corporate yield at contract issuance divided by 1 + the 10yr A-rated corporate yield at the date of surrender. This is raised to the power of the number of months remaining in the surrender charge period divided by 12. The A-rated corporate yield is based on the Bloomberg 10yr point on the A-rated corporate yield curve. The MVA typically applies to 75% of account value. 1. An annuity bonus adjustment is an additional deposit we add to a policyholders account value at contract inception. If the policyholder keeps the annuity until the surrender charge period expires, the bonus is added to the account value available for withdrawal. 1 Example of Fixed-Indexed Annuity Purchased in 2017 = Total Account Value = Cash Surrender Value 12 Surrender Value Scenario in 2023 • A Market Value Adjustment (MVA) further reduces the cash value a policyholder would receive upon surrender, typically by assuming the liability would be discounted by the current yield on an A-rated 10-year corporate bond
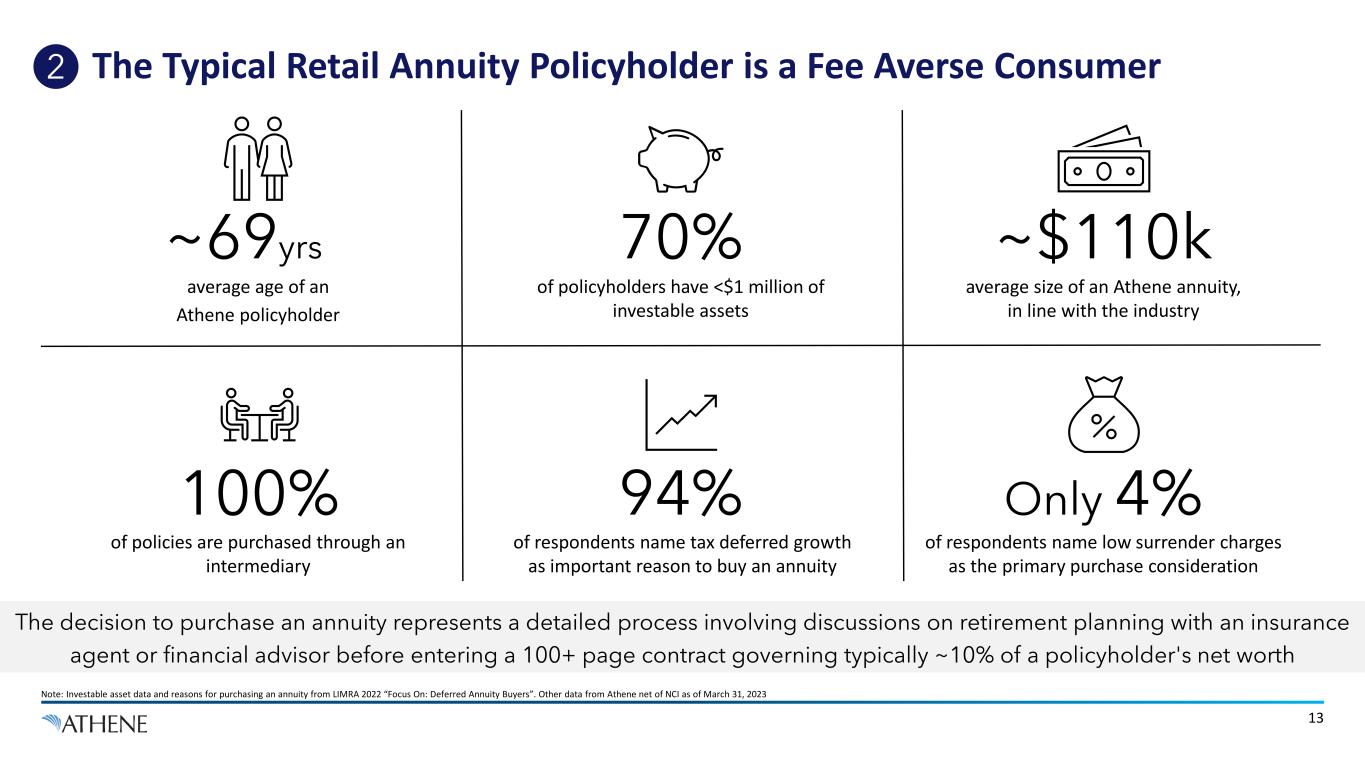
The Typical Retail Annuity Policyholder is a Fee Averse Consumer Note: Investable asset data and reasons for purchasing an annuity from LIMRA 2022 “Focus On: Deferred Annuity Buyers”. Other data from Athene net of NCI as of March 31, 2023 2 of policies are purchased through an intermediary 100% of respondents name low surrender charges as the primary purchase consideration Only 4% of policyholders have <$1 million of investable assets 70% average size of an Athene annuity, in line with the industry ~$110k of respondents name tax deferred growth as important reason to buy an annuity 94% average age of an Athene policyholder ~69yrs 13 The decision to purchase an annuity represents a detailed process involving discussions on retirement planning with an insurance agent or financial advisor before entering a 100+ page contract governing typically ~10% of a policyholder's net worth
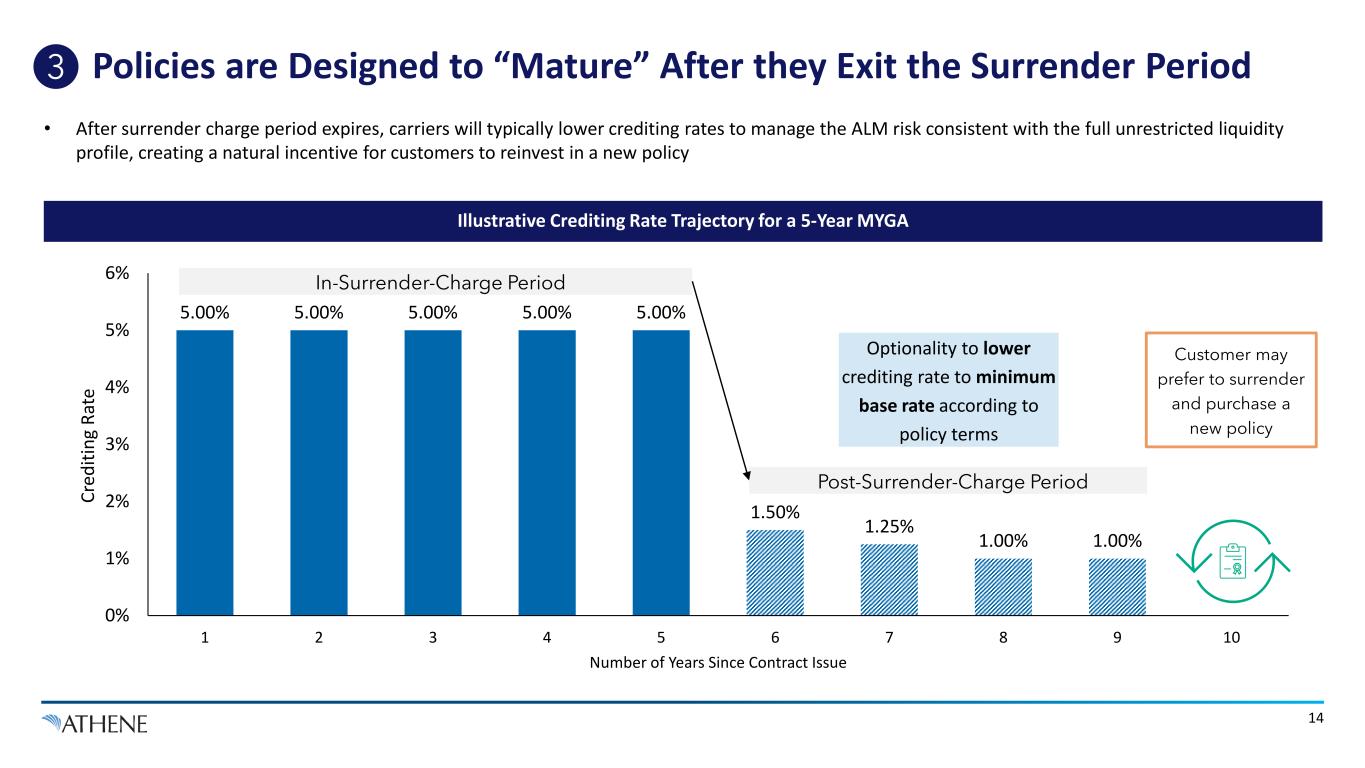
Policies are Designed to “Mature” After they Exit the Surrender Period 14 3 5.00% 5.00% 5.00% 5.00% 5.00% 1.50% 1.25% 1.00% 1.00% 0% 1% 2% 3% 4% 5% 6% 1 2 3 4 5 6 7 8 9 10 Cr ed iti ng R at e Number of Years Since Contract Issue In-Surrender-Charge Period Post-Surrender-Charge Period Optionality to lower crediting rate to minimum base rate according to policy terms Customer may prefer to surrender and purchase a new policy Illustrative Crediting Rate Trajectory for a 5-Year MYGA • After surrender charge period expires, carriers will typically lower crediting rates to manage the ALM risk consistent with the full unrestricted liquidity profile, creating a natural incentive for customers to reinvest in a new policy
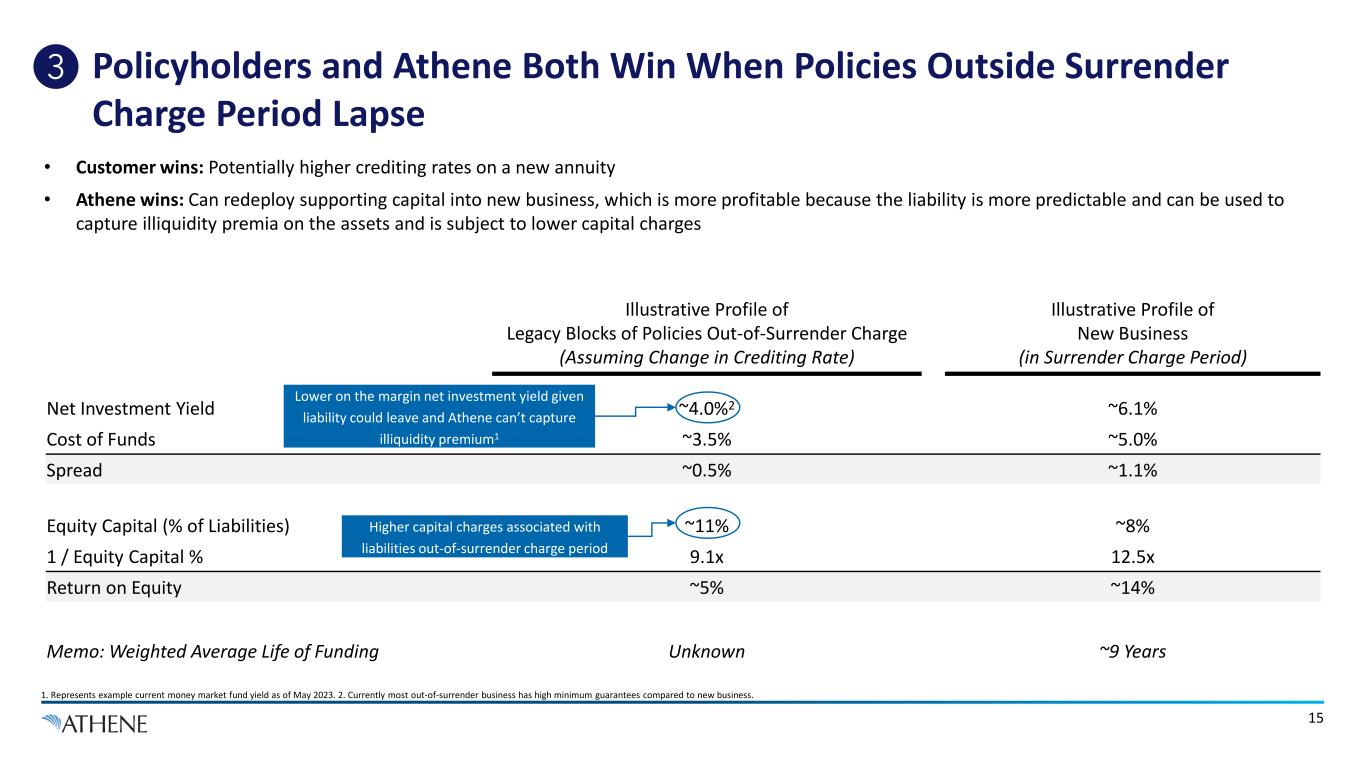
Illustrative Profile of Legacy Blocks of Policies Out-of-Surrender Charge (Assuming Change in Crediting Rate) Illustrative Profile of New Business (in Surrender Charge Period) Net Investment Yield ~4.0%2 ~6.1% Cost of Funds ~3.5% ~5.0% Spread ~0.5% ~1.1% Equity Capital (% of Liabilities) ~11% ~8% 1 / Equity Capital % 9.1x 12.5x Return on Equity ~5% ~14% Memo: Weighted Average Life of Funding Unknown ~9 Years Policyholders and Athene Both Win When Policies Outside Surrender Charge Period Lapse 1. Represents example current money market fund yield as of May 2023. 2. Currently most out-of-surrender business has high minimum guarantees compared to new business. Lower on the margin net investment yield given liability could leave and Athene can’t capture illiquidity premium1 Higher capital charges associated with liabilities out-of-surrender charge period 15 3 • Customer wins: Potentially higher crediting rates on a new annuity • Athene wins: Can redeploy supporting capital into new business, which is more profitable because the liability is more predictable and can be used to capture illiquidity premia on the assets and is subject to lower capital charges

Surrenders in the Context of Flows
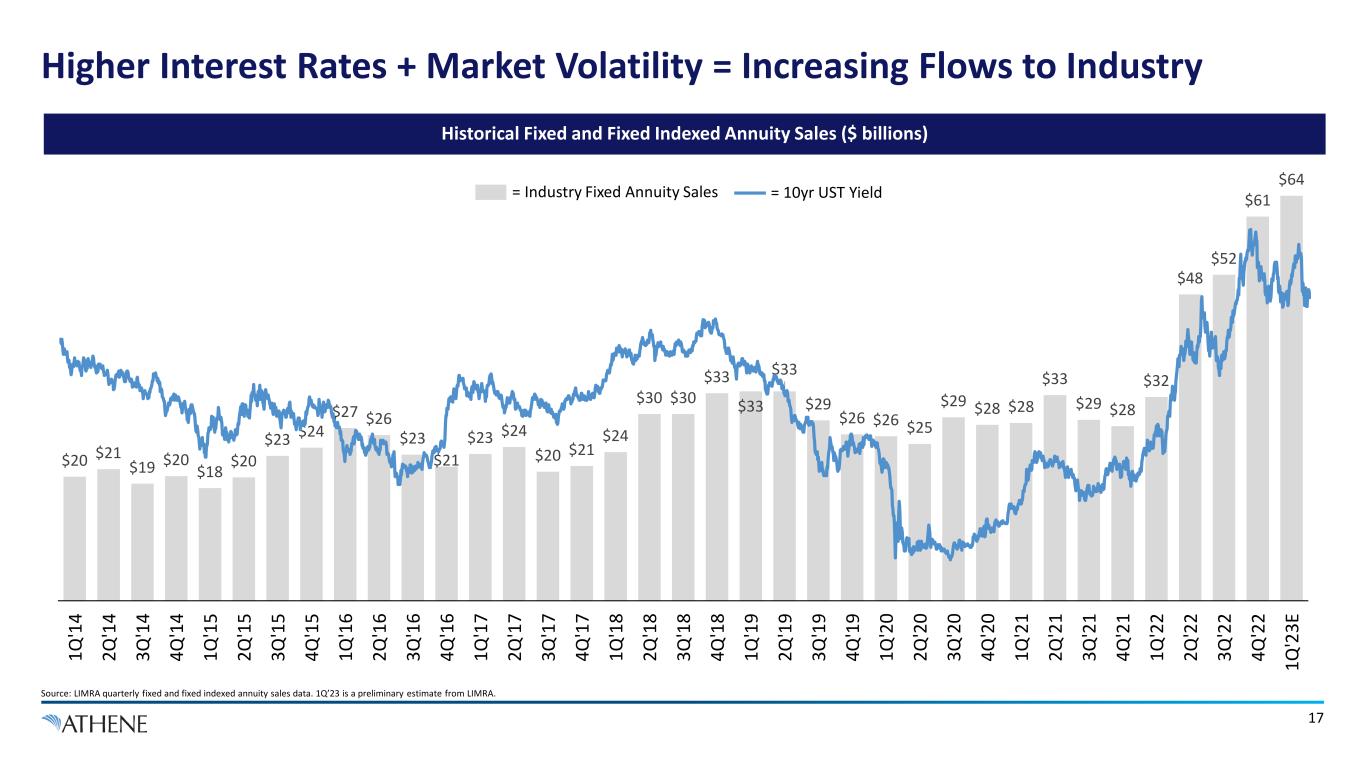
$20 $21 $19 $20 $18 $20 $23 $24 $27 $26 $23 $21 $23 $24 $20 $21 $24 $30 $30 $33 $33 $33 $29 $26 $26 $25 $29 $28 $28 $33 $29 $28 $32 $48 $52 $61 $64 1Q '1 4 2Q '1 4 3Q '1 4 4Q '1 4 1Q '1 5 2Q '1 5 3Q '1 5 4Q '1 5 1Q '1 6 2Q '1 6 3Q '1 6 4Q '1 6 1Q '1 7 2Q '1 7 3Q '1 7 4Q '1 7 1Q '1 8 2Q '1 8 3Q '1 8 4Q '1 8 1Q '1 9 2Q '1 9 3Q '1 9 4Q '1 9 1Q '2 0 2Q '2 0 3Q '2 0 4Q '2 0 1Q '2 1 2Q '2 1 3Q '2 1 4Q '2 1 1Q '2 2 2Q '2 2 3Q '2 2 4Q '2 2 1Q '2 3E Higher Interest Rates + Market Volatility = Increasing Flows to Industry Source: LIMRA quarterly fixed and fixed indexed annuity sales data. 1Q’23 is a preliminary estimate from LIMRA. Historical Fixed and Fixed Indexed Annuity Sales ($ billions) 17 = Industry Fixed Annuity Sales = 10yr UST Yield
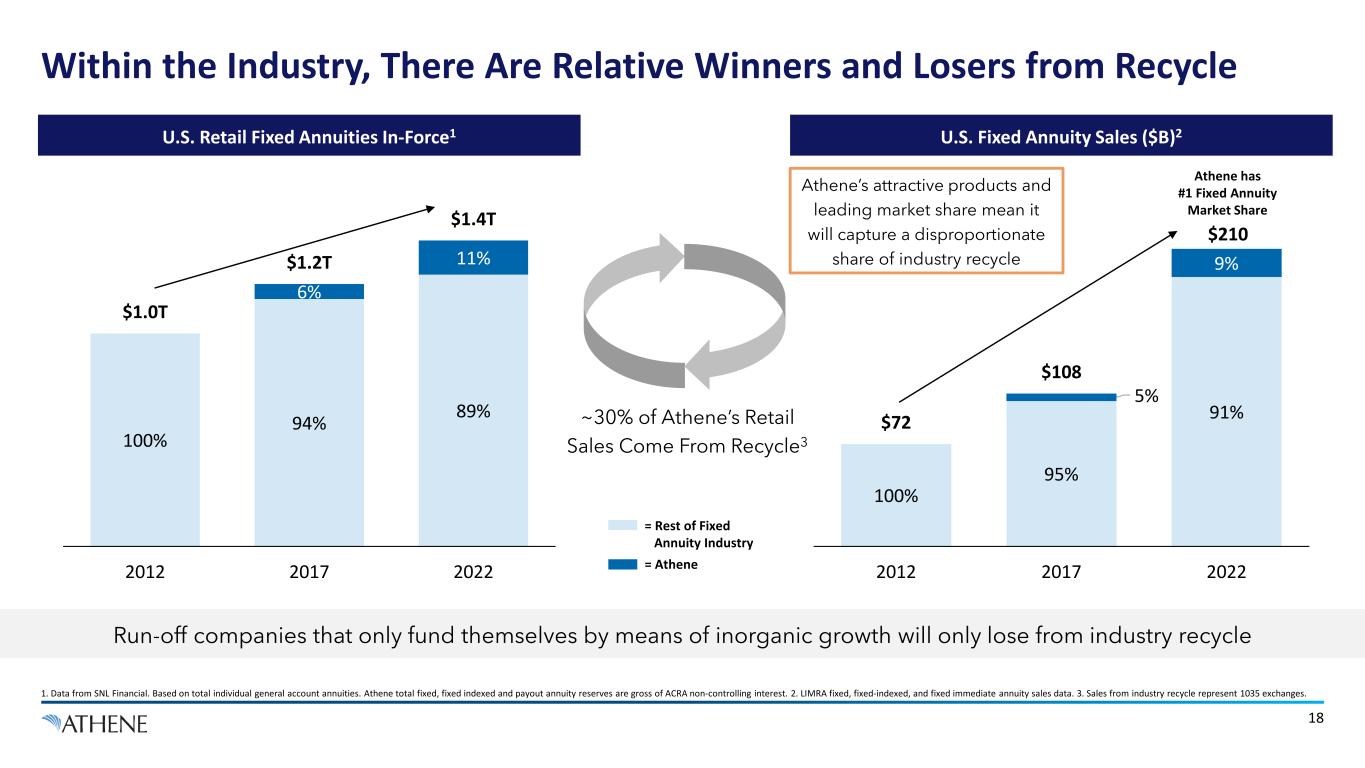
Within the Industry, There Are Relative Winners and Losers from Recycle 1. Data from SNL Financial. Based on total individual general account annuities. Athene total fixed, fixed indexed and payout annuity reserves are gross of ACRA non-controlling interest. 2. LIMRA fixed, fixed-indexed, and fixed immediate annuity sales data. 3. Sales from industry recycle represent 1035 exchanges. 18 100% 94% 89% 6% 11% $1.0T $1.2T $1.4T 2012 2017 2022 100% 95% 91% 5% 9% $72 $108 $210 2012 2017 2022 Athene has #1 Fixed Annuity Market Share Athene’s attractive products and leading market share mean it will capture a disproportionate share of industry recycle ~30% of Athene’s Retail Sales Come From Recycle3 U.S. Retail Fixed Annuities In-Force1 U.S. Fixed Annuity Sales ($B)2 Run-off companies that only fund themselves by means of inorganic growth will only lose from industry recycle = Rest of Fixed Annuity Industry = Athene
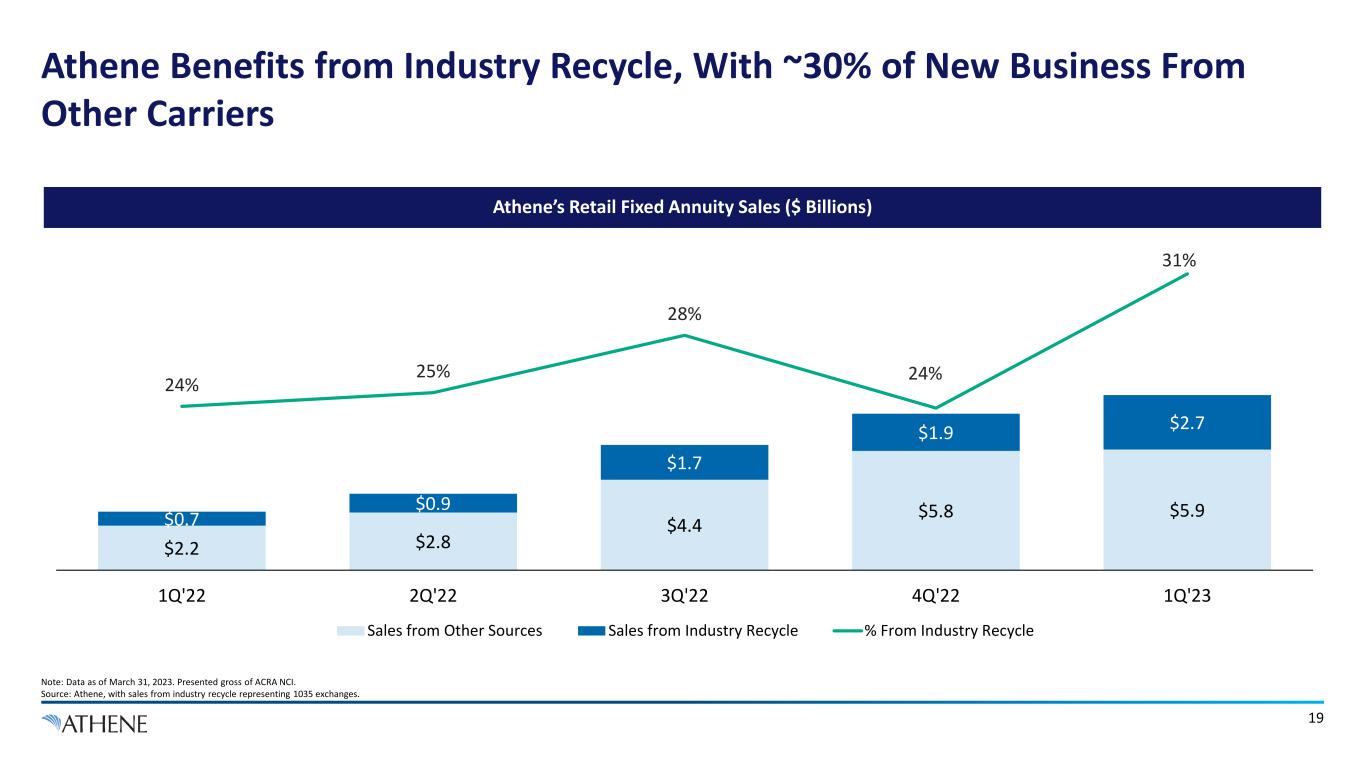
Athene Benefits from Industry Recycle, With ~30% of New Business From Other Carriers Note: Data as of March 31, 2023. Presented gross of ACRA NCI. Source: Athene, with sales from industry recycle representing 1035 exchanges. 19 Athene’s Retail Fixed Annuity Sales ($ Billions) $2.2 $2.8 $4.4 $5.8 $5.9$0.7 $0.9 $1.7 $1.9 $2.7 24% 25% 28% 24% 31% 15% 17% 19% 21% 23% 25% 27% 29% 31% 33% 35% 0.0 2.0 4.0 6.0 8.0 10.0 12.0 14.0 16.0 18.0 1Q'22 2Q'22 3Q'22 4Q'22 1Q'23 Sales from Other Sources Sales from Industry Recycle % From Industry Recycle

Current Trends At Athene
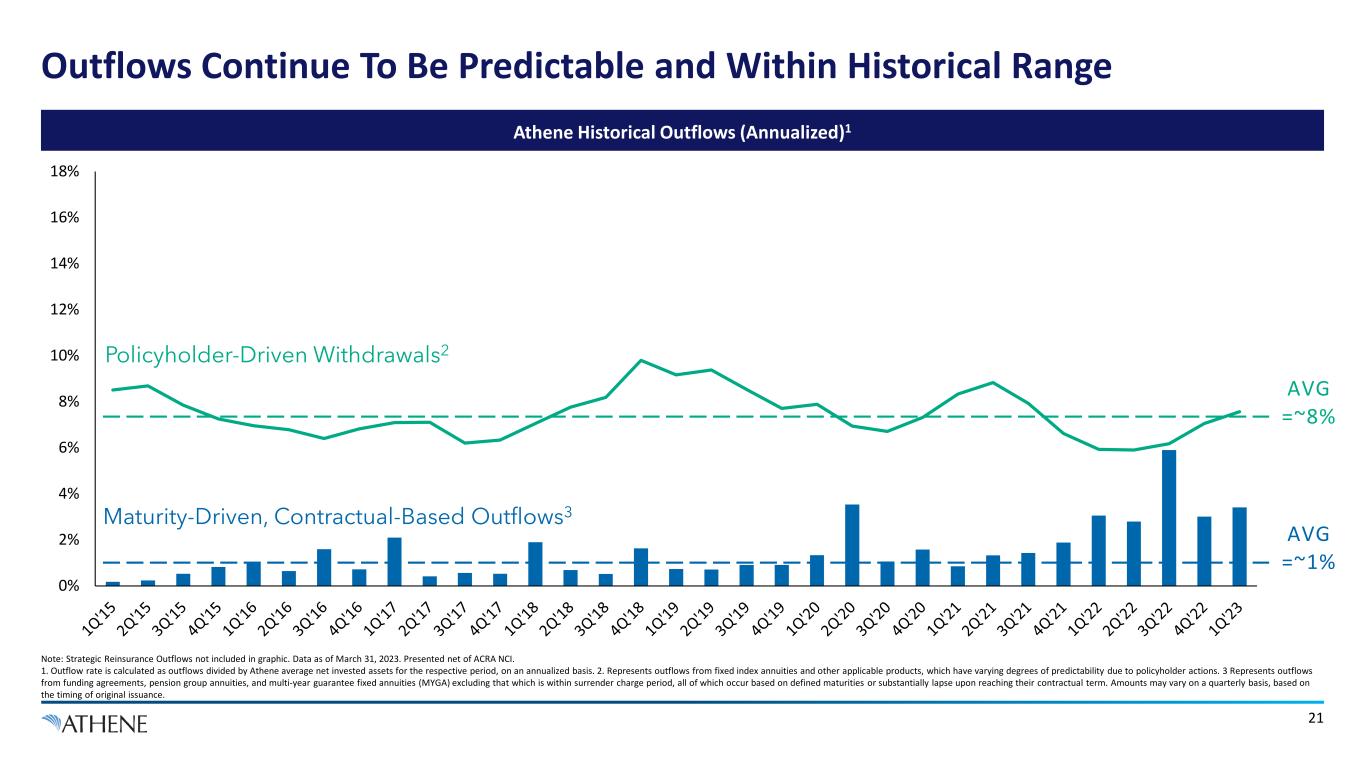
0% 2% 4% 6% 8% 10% 12% 14% 16% 18% Outflows Continue To Be Predictable and Within Historical Range Note: Strategic Reinsurance Outflows not included in graphic. Data as of March 31, 2023. Presented net of ACRA NCI. 1. Outflow rate is calculated as outflows divided by Athene average net invested assets for the respective period, on an annualized basis. 2. Represents outflows from fixed index annuities and other applicable products, which have varying degrees of predictability due to policyholder actions. 3 Represents outflows from funding agreements, pension group annuities, and multi-year guarantee fixed annuities (MYGA) excluding that which is within surrender charge period, all of which occur based on defined maturities or substantially lapse upon reaching their contractual term. Amounts may vary on a quarterly basis, based on the timing of original issuance. Athene Historical Outflows (Annualized)1 Policyholder-Driven Withdrawals2 AVG =~8% AVG =~1% Maturity-Driven, Contractual-Based Outflows3 21
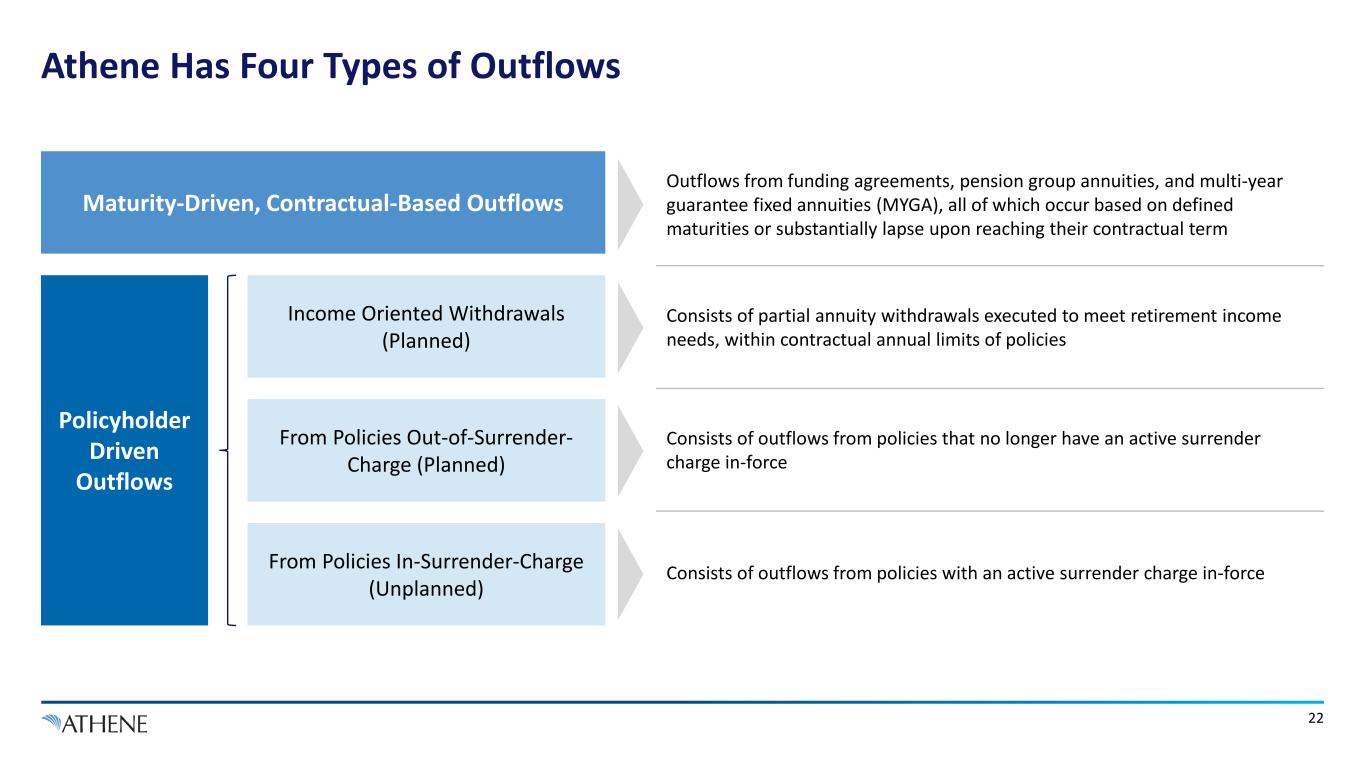
Athene Has Four Types of Outflows Maturity-Driven, Contractual-Based Outflows Income Oriented Withdrawals (Planned) From Policies Out-of-Surrender- Charge (Planned) From Policies In-Surrender-Charge (Unplanned) Policyholder Driven Outflows Outflows from funding agreements, pension group annuities, and multi-year guarantee fixed annuities (MYGA), all of which occur based on defined maturities or substantially lapse upon reaching their contractual term Consists of partial annuity withdrawals executed to meet retirement income needs, within contractual annual limits of policies Consists of outflows from policies that no longer have an active surrender charge in-force Consists of outflows from policies with an active surrender charge in-force 22
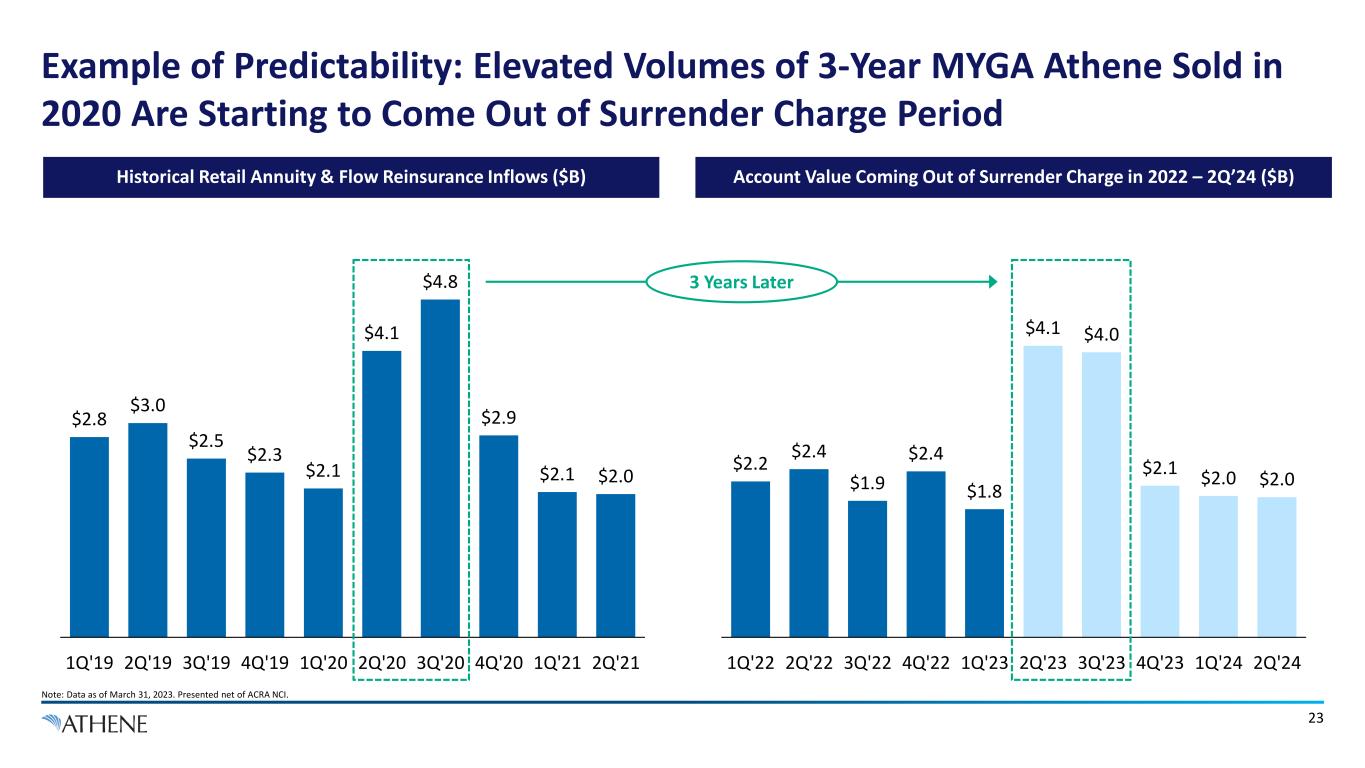
$2.2 $2.4 $1.9 $2.4 $1.8 $4.1 $4.0 $2.1 $2.0 $2.0 1Q'22 2Q'22 3Q'22 4Q'22 1Q'23 2Q'23 3Q'23 4Q'23 1Q'24 2Q'24 Example of Predictability: Elevated Volumes of 3-Year MYGA Athene Sold in 2020 Are Starting to Come Out of Surrender Charge Period Historical Retail Annuity & Flow Reinsurance Inflows ($B) Account Value Coming Out of Surrender Charge in 2022 – 2Q’24 ($B) $2.8 $3.0 $2.5 $2.3 $2.1 $4.1 $4.8 $2.9 $2.1 $2.0 1Q'19 2Q'19 3Q'19 4Q'19 1Q'20 2Q'20 3Q'20 4Q'20 1Q'21 2Q'21 23 3 Years Later Note: Data as of March 31, 2023. Presented net of ACRA NCI.
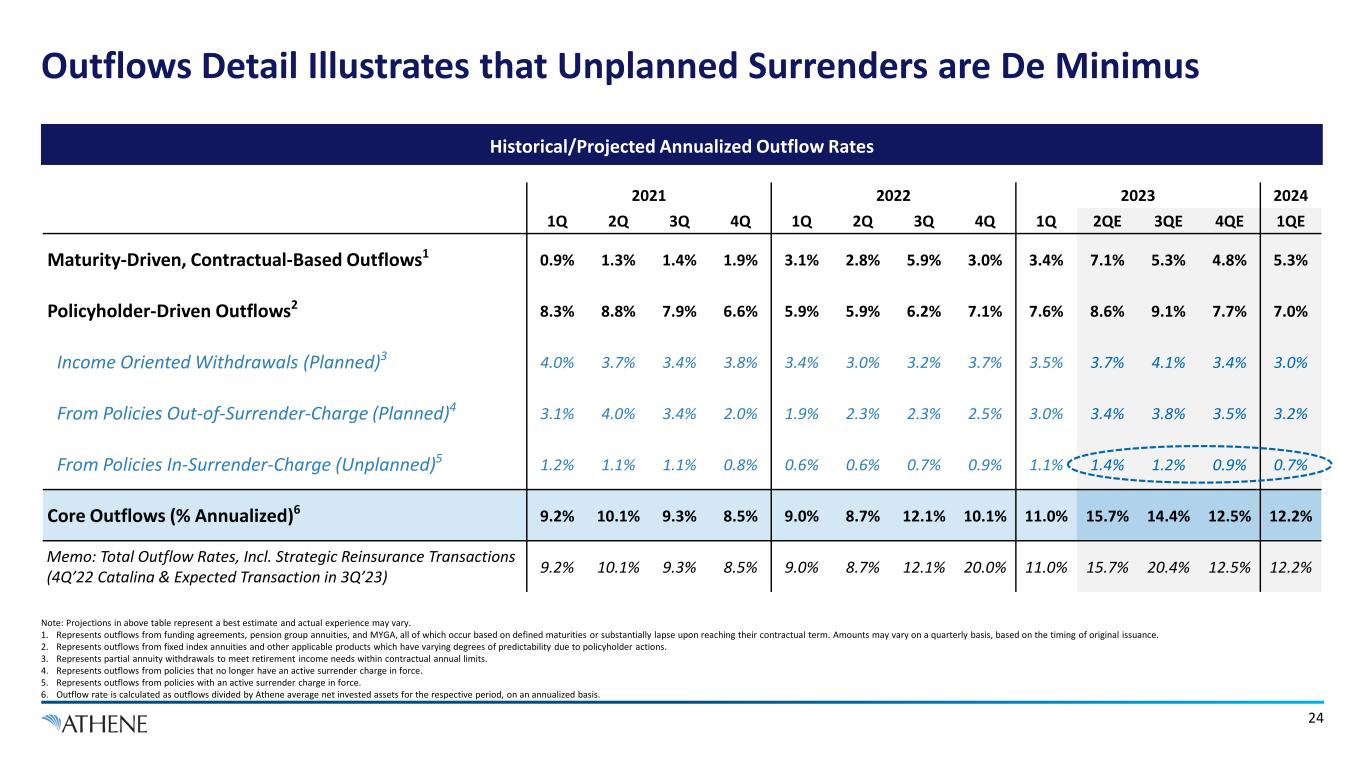
Outflows Detail Illustrates that Unplanned Surrenders are De Minimus Note: Projections in above table represent a best estimate and actual experience may vary. 1. Represents outflows from funding agreements, pension group annuities, and MYGA, all of which occur based on defined maturities or substantially lapse upon reaching their contractual term. Amounts may vary on a quarterly basis, based on the timing of original issuance. 2. Represents outflows from fixed index annuities and other applicable products which have varying degrees of predictability due to policyholder actions. 3. Represents partial annuity withdrawals to meet retirement income needs within contractual annual limits. 4. Represents outflows from policies that no longer have an active surrender charge in force. 5. Represents outflows from policies with an active surrender charge in force. 6. Outflow rate is calculated as outflows divided by Athene average net invested assets for the respective period, on an annualized basis. 24 2021 2022 2023 2024 1Q 2Q 3Q 4Q 1Q 2Q 3Q 4Q 1Q 2QE 3QE 4QE 1QE Maturity-Driven, Contractual-Based Outflows1 0.9% 1.3% 1.4% 1.9% 3.1% 2.8% 5.9% 3.0% 3.4% 7.1% 5.3% 4.8% 5.3% Policyholder-Driven Outflows2 8.3% 8.8% 7.9% 6.6% 5.9% 5.9% 6.2% 7.1% 7.6% 8.6% 9.1% 7.7% 7.0% Income Oriented Withdrawals (Planned)3 4.0% 3.7% 3.4% 3.8% 3.4% 3.0% 3.2% 3.7% 3.5% 3.7% 4.1% 3.4% 3.0% From Policies Out-of-Surrender-Charge (Planned)4 3.1% 4.0% 3.4% 2.0% 1.9% 2.3% 2.3% 2.5% 3.0% 3.4% 3.8% 3.5% 3.2% From Policies In-Surrender-Charge (Unplanned)5 1.2% 1.1% 1.1% 0.8% 0.6% 0.6% 0.7% 0.9% 1.1% 1.4% 1.2% 0.9% 0.7% Core Outflows (% Annualized)6 9.2% 10.1% 9.3% 8.5% 9.0% 8.7% 12.1% 10.1% 11.0% 15.7% 14.4% 12.5% 12.2% Memo: Total Outflow Rates, Incl. Strategic Reinsurance Transactions (4Q’22 Catalina & Expected Transaction in 3Q’23) 9.2% 10.1% 9.3% 8.5% 9.0% 8.7% 12.1% 20.0% 11.0% 15.7% 20.4% 12.5% 12.2% Historical/Projected Annualized Outflow Rates
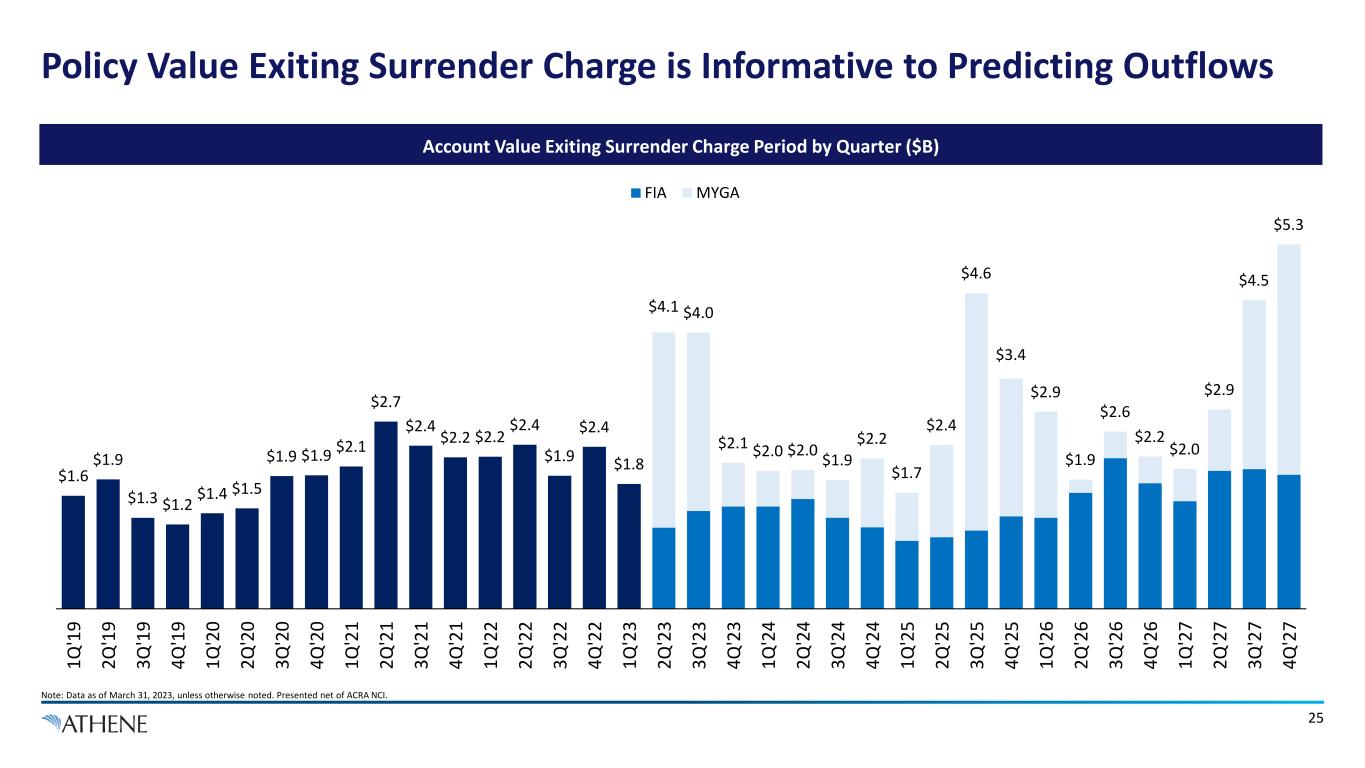
Policy Value Exiting Surrender Charge is Informative to Predicting Outflows Account Value Exiting Surrender Charge Period by Quarter ($B) Note: Data as of March 31, 2023, unless otherwise noted. Presented net of ACRA NCI. 25 $1.6 $1.9 $1.3 $1.2 $1.4 $1.5 $1.9 $1.9 $2.1 $2.7 $2.4 $2.2 $2.2 $2.4 $1.9 $2.4 $1.8 $4.1 $4.0 $2.1 $2.0 $2.0 $1.9 $2.2 $1.7 $2.4 $4.6 $3.4 $2.9 $1.9 $2.6 $2.2 $2.0 $2.9 $4.5 $5.3 1Q '1 9 2Q '1 9 3Q '1 9 4Q '1 9 1Q '2 0 2Q '2 0 3Q '2 0 4Q '2 0 1Q '2 1 2Q '2 1 3Q '2 1 4Q '2 1 1Q '2 2 2Q '2 2 3Q '2 2 4Q '2 2 1Q '2 3 2Q '2 3 3Q '2 3 4Q '2 3 1Q '2 4 2Q '2 4 3Q '2 4 4Q '2 4 1Q '2 5 2Q '2 5 3Q '2 5 4Q '2 5 1Q '2 6 2Q '2 6 3Q '2 6 4Q '2 6 1Q '2 7 2Q '2 7 3Q '2 7 4Q '2 7 FIA MYGA
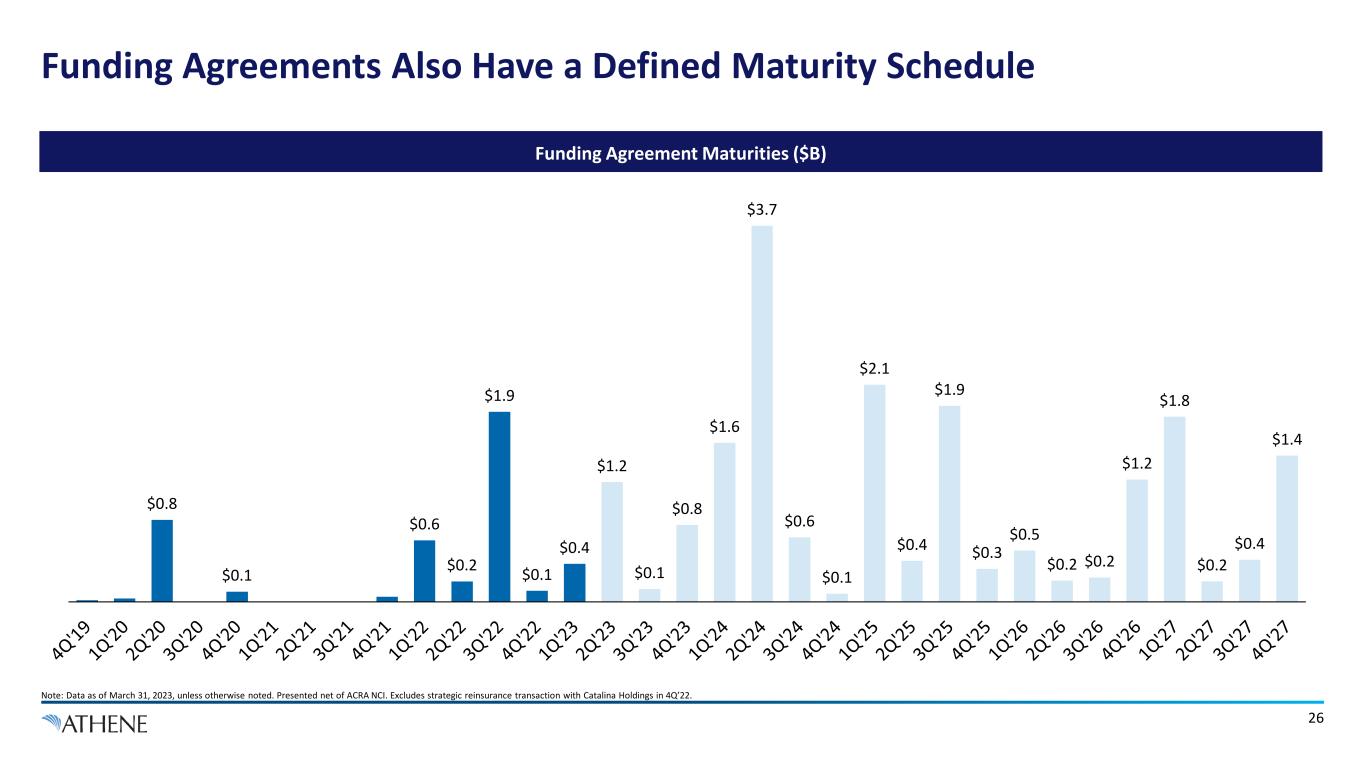
$0.8 $0.1 $0.6 $0.2 $1.9 $0.1 $0.4 $1.2 $0.1 $0.8 $1.6 $3.7 $0.6 $0.1 $2.1 $0.4 $1.9 $0.3 $0.5 $0.2 $0.2 $1.2 $1.8 $0.2 $0.4 $1.4 Funding Agreements Also Have a Defined Maturity Schedule 26 Funding Agreement Maturities ($B) Note: Data as of March 31, 2023, unless otherwise noted. Presented net of ACRA NCI. Excludes strategic reinsurance transaction with Catalina Holdings in 4Q’22.
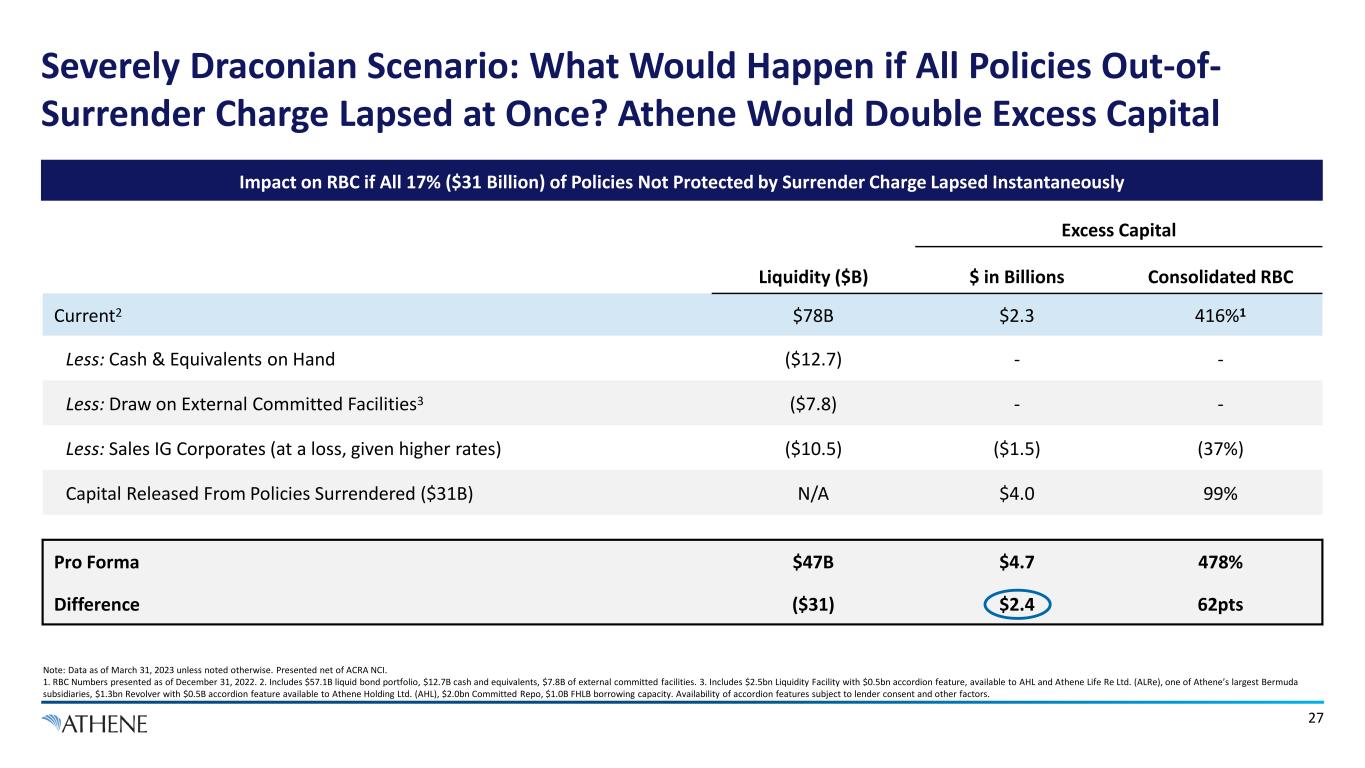
Severely Draconian Scenario: What Would Happen if All Policies Out-of- Surrender Charge Lapsed at Once? Athene Would Double Excess Capital Note: Data as of March 31, 2023 unless noted otherwise. Presented net of ACRA NCI. 1. RBC Numbers presented as of December 31, 2022. 2. Includes $57.1B liquid bond portfolio, $12.7B cash and equivalents, $7.8B of external committed facilities. 3. Includes $2.5bn Liquidity Facility with $0.5bn accordion feature, available to AHL and Athene Life Re Ltd. (ALRe), one of Athene’s largest Bermuda subsidiaries, $1.3bn Revolver with $0.5B accordion feature available to Athene Holding Ltd. (AHL), $2.0bn Committed Repo, $1.0B FHLB borrowing capacity. Availability of accordion features subject to lender consent and other factors. Excess Capital Liquidity ($B) $ in Billions Consolidated RBC Current2 $78B $2.3 416%1 Less: Cash & Equivalents on Hand ($12.7) - - Less: Draw on External Committed Facilities3 ($7.8) - - Less: Sales IG Corporates (at a loss, given higher rates) ($10.5) ($1.5) (37%) Capital Released From Policies Surrendered ($31B) N/A $4.0 99% Pro Forma $47B $4.7 478% Difference ($31) $2.4 62pts Impact on RBC if All 17% ($31 Billion) of Policies Not Protected by Surrender Charge Lapsed Instantaneously 27
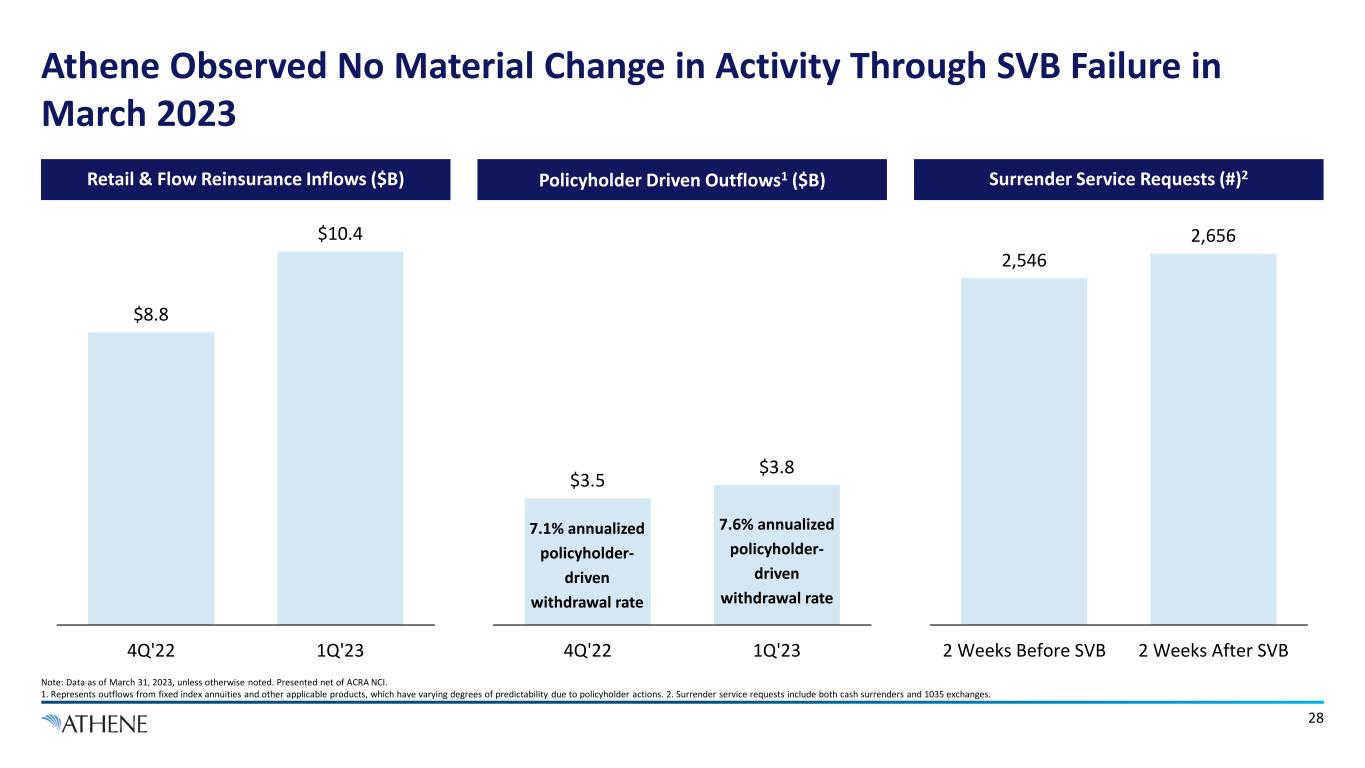
Athene Observed No Material Change in Activity Through SVB Failure in March 2023 $3.5 $3.8 4Q'22 1Q'23 7.1% annualized policyholder- driven withdrawal rate 7.6% annualized policyholder- driven withdrawal rate Policyholder Driven Outflows1 ($B) 28 Note: Data as of March 31, 2023, unless otherwise noted. Presented net of ACRA NCI. 1. Represents outflows from fixed index annuities and other applicable products, which have varying degrees of predictability due to policyholder actions. 2. Surrender service requests include both cash surrenders and 1035 exchanges. Retail & Flow Reinsurance Inflows ($B) $8.8 $10.4 4Q'22 1Q'23 Surrender Service Requests (#)2 2,546 2,656 2 Weeks Before SVB 2 Weeks After SVB
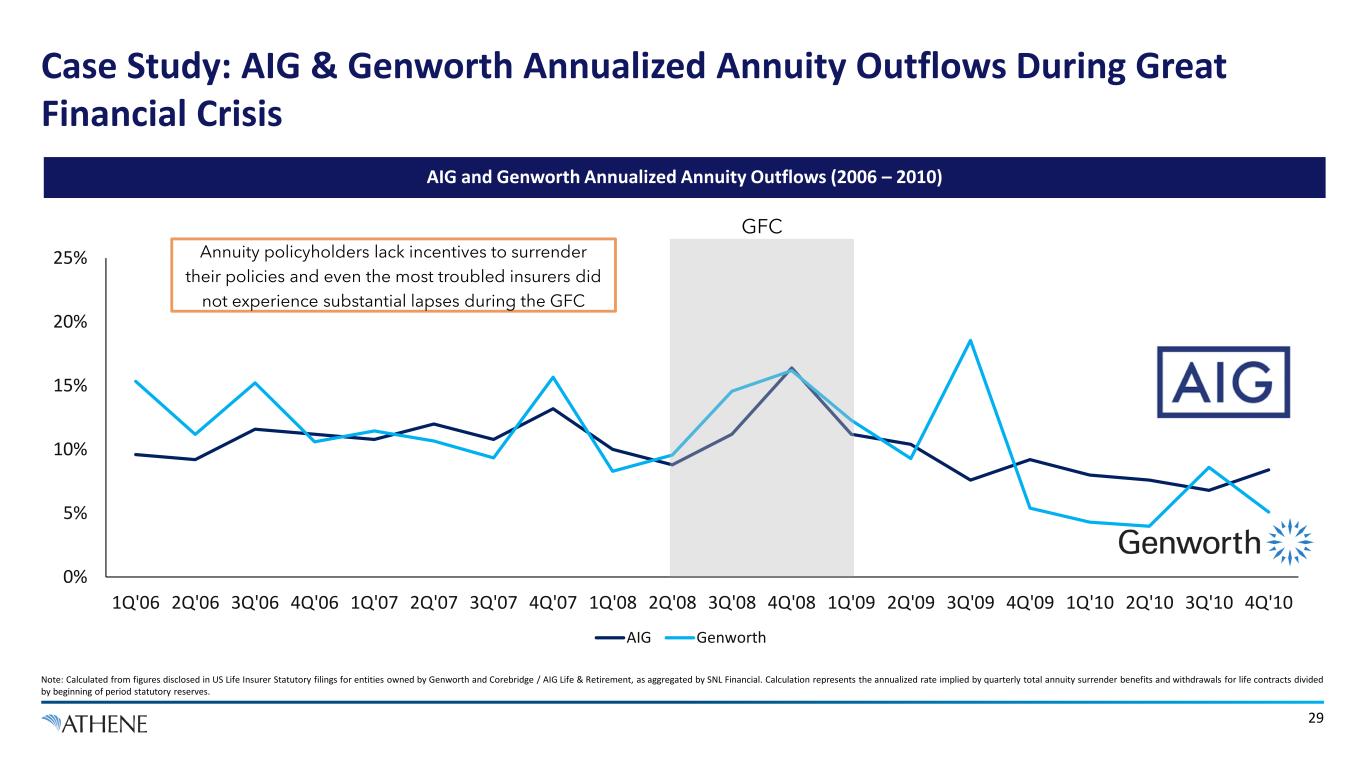
Case Study: AIG & Genworth Annualized Annuity Outflows During Great Financial Crisis Note: Calculated from figures disclosed in US Life Insurer Statutory filings for entities owned by Genworth and Corebridge / AIG Life & Retirement, as aggregated by SNL Financial. Calculation represents the annualized rate implied by quarterly total annuity surrender benefits and withdrawals for life contracts divided by beginning of period statutory reserves. 0% 5% 10% 15% 20% 25% 1Q'06 2Q'06 3Q'06 4Q'06 1Q'07 2Q'07 3Q'07 4Q'07 1Q'08 2Q'08 3Q'08 4Q'08 1Q'09 2Q'09 3Q'09 4Q'09 1Q'10 2Q'10 3Q'10 4Q'10 AIG Genworth AIG and Genworth Annualized Annuity Outflows (2006 – 2010) Annuity policyholders lack incentives to surrender their policies and even the most troubled insurers did not experience substantial lapses during the GFC GFC 29

Appendix
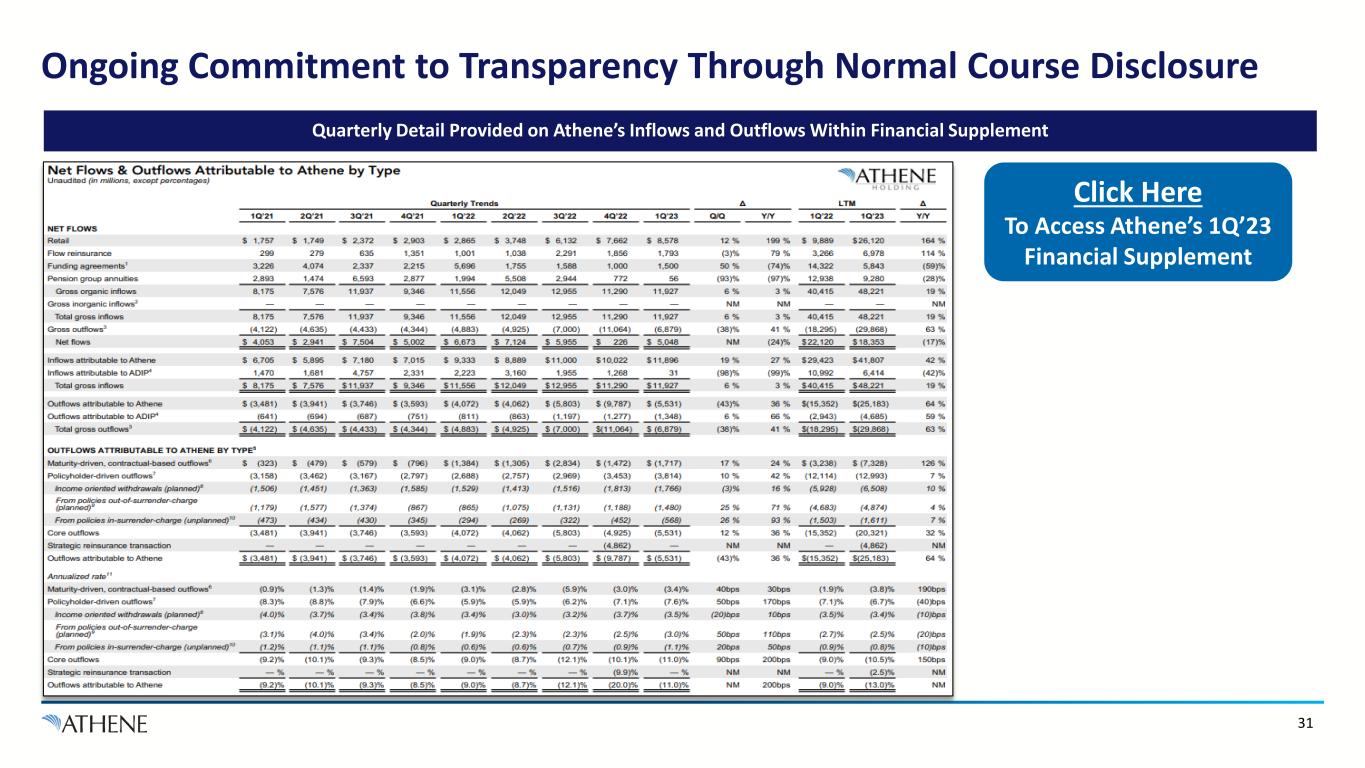
Ongoing Commitment to Transparency Through Normal Course Disclosure 31 Click Here To Access Athene’s 1Q’23 Financial Supplement Quarterly Detail Provided on Athene’s Inflows and Outflows Within Financial Supplement
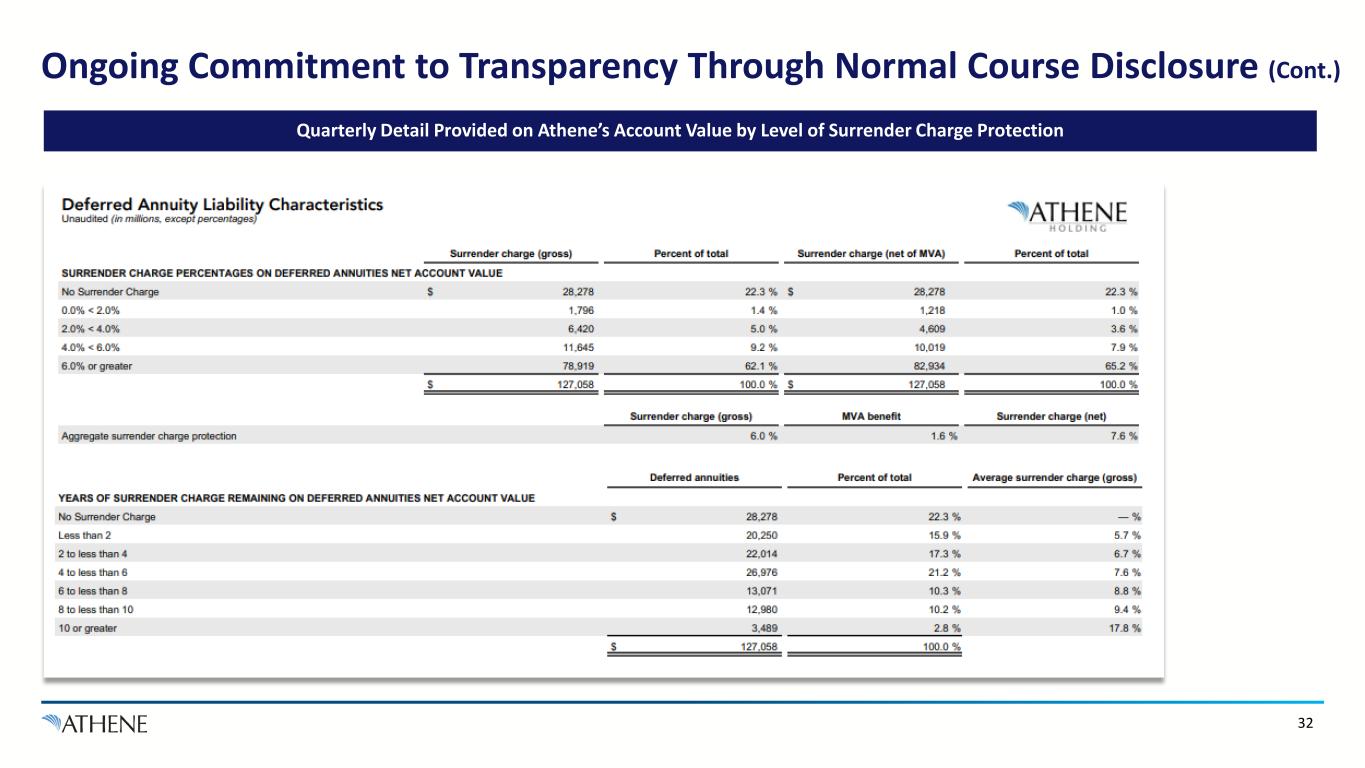
Ongoing Commitment to Transparency Through Normal Course Disclosure (Cont.) 32 Quarterly Detail Provided on Athene’s Account Value by Level of Surrender Charge Protection
33 Non-GAAP Measures & Definitions Non-GAAP Definitions In addition to our results presented in accordance with accounting principles generally accepted in the United States of America (US GAAP), we present certain financial information that includes non-GAAP measures. Management believes the use of these non-GAAP measures, together with the relevant US GAAP measures, provides information that may enhance an investor’s understanding of our results of operations and the underlying profitability drivers of our business. The majority of these non-GAAP measures are intended to remove from the results of operations the impact of market volatility (other than with respect to alternative investments) as well as integration, restructuring and certain other expenses which are not part of our underlying profitability drivers, as such items fluctuate from period to period in a manner inconsistent with these drivers. These measures should be considered supplementary to our results in accordance with US GAAP and should not be viewed as a substitute for the corresponding US GAAP measures. Net Reserve Liabilities In managing our business, we also analyze net reserve liabilities, which does not correspond to total liabilities as disclosed in our consolidated financial statements and notes thereto. Net reserve liabilities represent our policyholder liability obligations net of reinsurance and is used to analyze the costs of our liabilities. Net reserve liabilities include (a) interest sensitive contract liabilities, (b) future policy benefits, (c) net market risk benefits, (d) long-term repurchase obligations, (e) dividends payable to policyholders and (f) other policy claims and benefits, offset by reinsurance recoverable, excluding policy loans ceded. Net reserve liabilities include our proportionate share of ACRA reserve liabilities, based on our economic ownership, but do not include the proportionate share of reserve liabilities associated with the noncontrolling interest. Net reserve liabilities is net of the ceded liabilities to third-party reinsurers as the costs of the liabilities are passed to such reinsurers and, therefore, we have no net economic exposure to such liabilities, assuming our reinsurance counterparties perform under our agreements. The majority of our ceded reinsurance is a result of reinsuring large blocks of life business following acquisitions. For such transactions, US GAAP requires the ceded liabilities and related reinsurance recoverables to continue to be recorded in our consolidated financial statements despite the transfer of economic risk to the counterparty in connection with the reinsurance transaction. While we believe net reserve liabilities is a meaningful financial metric and enhances our understanding of the underlying profitability drivers of our business, it should not be used as a substitute for total liabilities presented under US GAAP. Sales Sales statistics do not correspond to revenues under US GAAP but are used as relevant measures to understand our business performance as it relates to inflows generated during a specific period of time. Our sales statistics include inflows for fixed rate annuities and FIAs and align with the LIMRA definition of all money paid into an individual annuity, including money paid into new contracts with initial purchase occurring in the specified period and existing contracts with initial purchase occurring prior to the specified period (excluding internal transfers). We believe sales is a meaningful metric that enhances our understanding of our business performance and is not the same as premiums presented in our condensed consolidated statements of income (loss). performance and is not the same as premiums presented in our consolidated statements of income (loss).
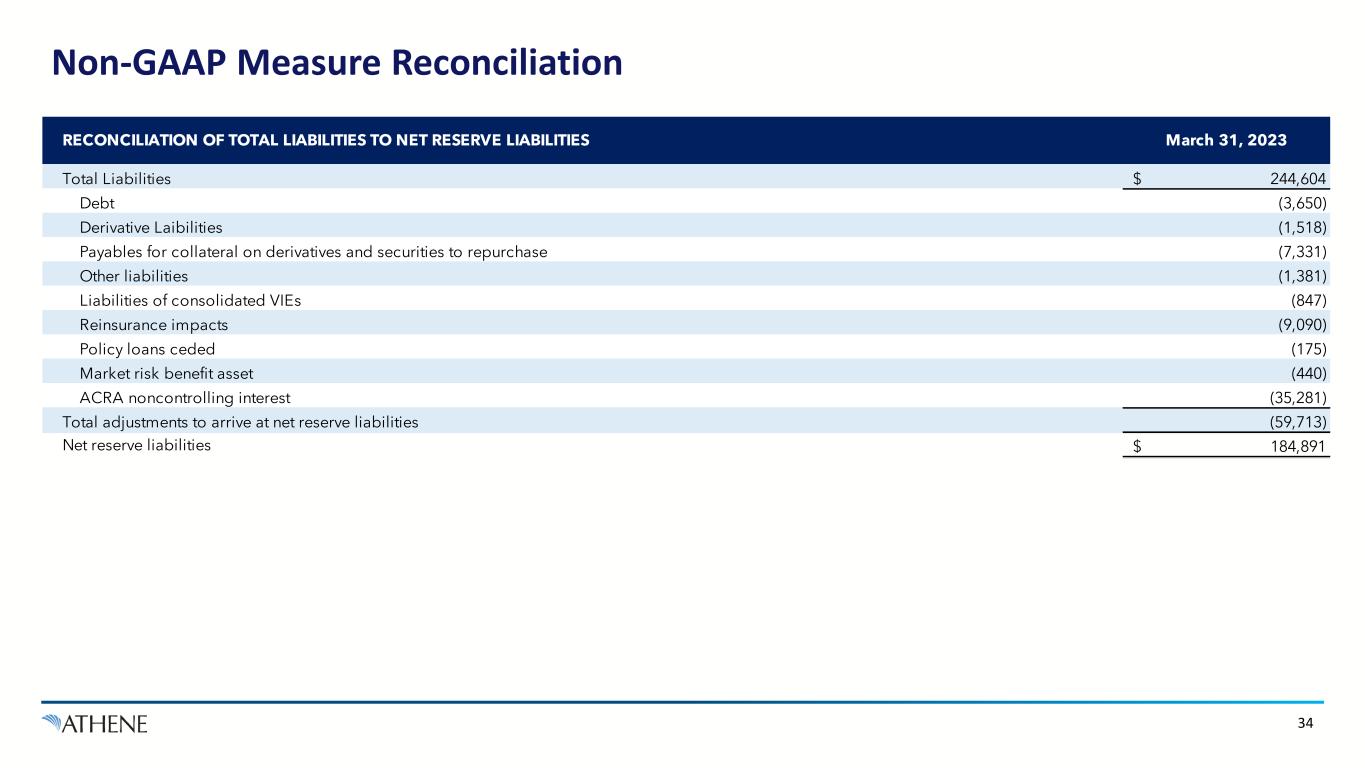
34 Non-GAAP Measure Reconciliation Total Liabilities Debt Derivative Laibilities Payables for collateral on derivatives and securities to repurchase Other liabilities Liabilities of consolidated VIEs Reinsurance impacts Policy loans ceded Market risk benefit asset ACRA noncontrolling interest Total adjustments to arrive at net reserve liabilities Net reserve liabilities $ 184,891 (440) (35,281) (59,713) (175) RECONCILIATION OF TOTAL LIABILITIES TO NET RESERVE LIABILITIES March 31, 2023 $ 244,604 (3,650) (1,518) (7,331) (1,381) (847) (9,090)