EX-99.2
Published on March 8, 2021
March 8, 2021 Apollo and Athene to Merge in All Stock Transaction March 8, 2021 Unless otherwise noted, information as of March 2021. It should not be assumed that investments made in the future will be profitable or will equal the performance of the investments shown in this document. To the extent distributed in the U.S., this presentation is distributed by Apollo Global Securities, LLC (“AGS”), a broker-dealer registered with the U.S. Securities and Exchange Commission and a member of FINRA. Exhibit 99.2
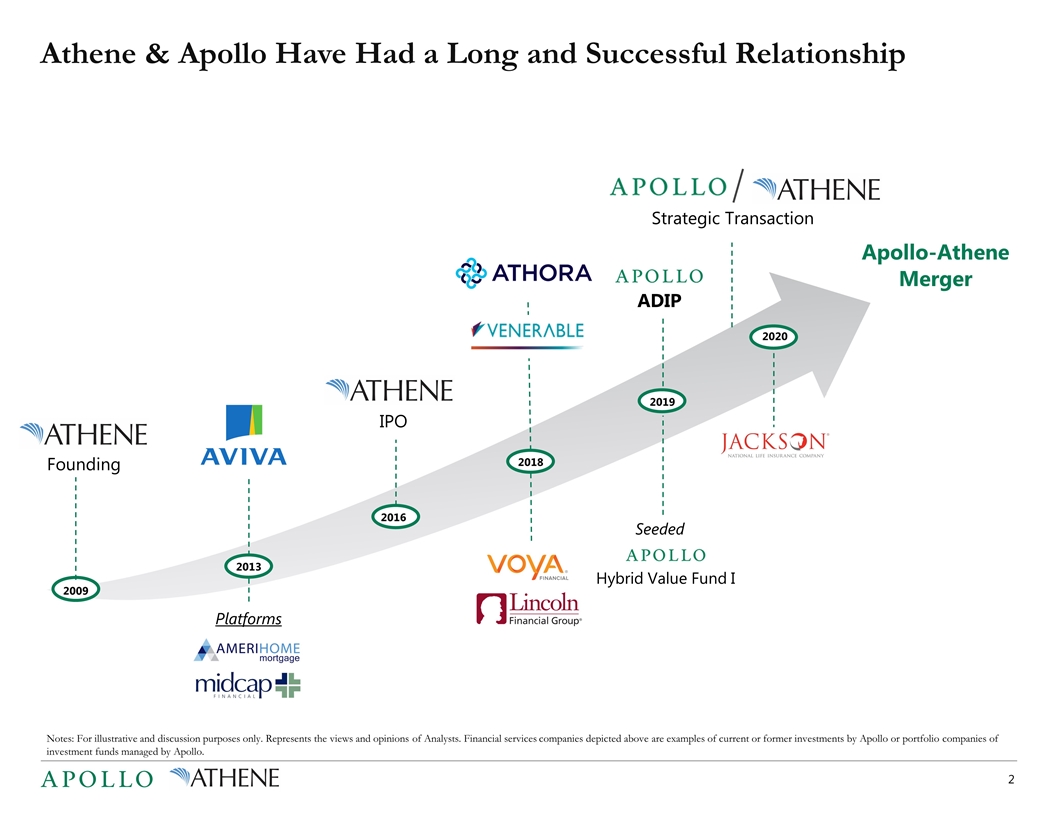
Athene & Apollo Have Had a Long and Successful Relationship Founding 2009 2013 2018 2019 2020 IPO 2016 Hybrid Value Fund I Strategic Transaction ADIP Platforms Apollo-Athene Merger Seeded Notes: For illustrative and discussion purposes only. Represents the views and opinions of Analysts. Financial services companies depicted above are examples of current or former investments by Apollo or portfolio companies of investment funds managed by Apollo.
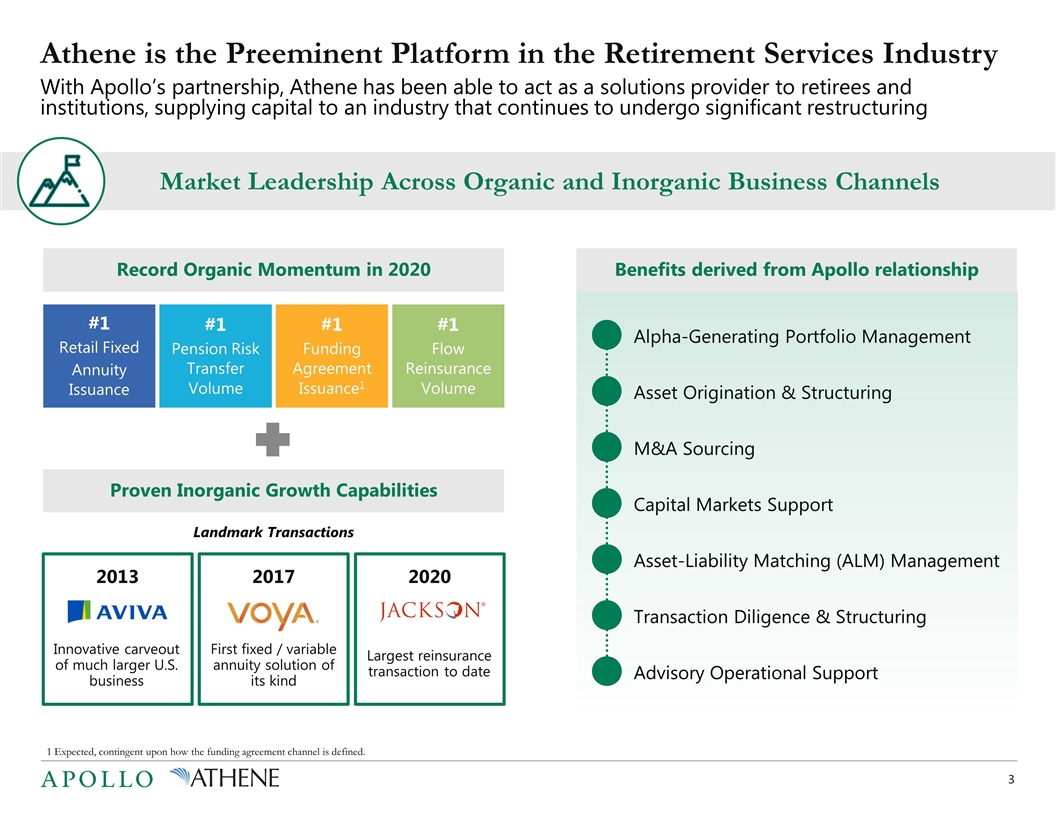
With Apollo’s partnership, Athene has been able to act as a solutions provider to retirees and institutions, supplying capital to an industry that continues to undergo significant restructuring Athene is the Preeminent Platform in the Retirement Services Industry #1 Retail Fixed Annuity Issuance #1 Pension Risk Transfer Volume #1 Funding Agreement Issuance1 #1 Flow Reinsurance Volume Record Organic Momentum in 2020 Market Leadership Across Organic and Inorganic Business Channels Advisory Operational Support Asset Origination & Structuring M&A Sourcing Transaction Diligence & Structuring Asset-Liability Matching (ALM) Management Capital Markets Support Alpha-Generating Portfolio Management 2013 2017 2020 Proven Inorganic Growth Capabilities Landmark Transactions Benefits derived from Apollo relationship First fixed / variable annuity solution of its kind Largest reinsurance transaction to date Innovative carveout of much larger U.S. business 1 Expected, contingent upon how the funding agreement channel is defined.
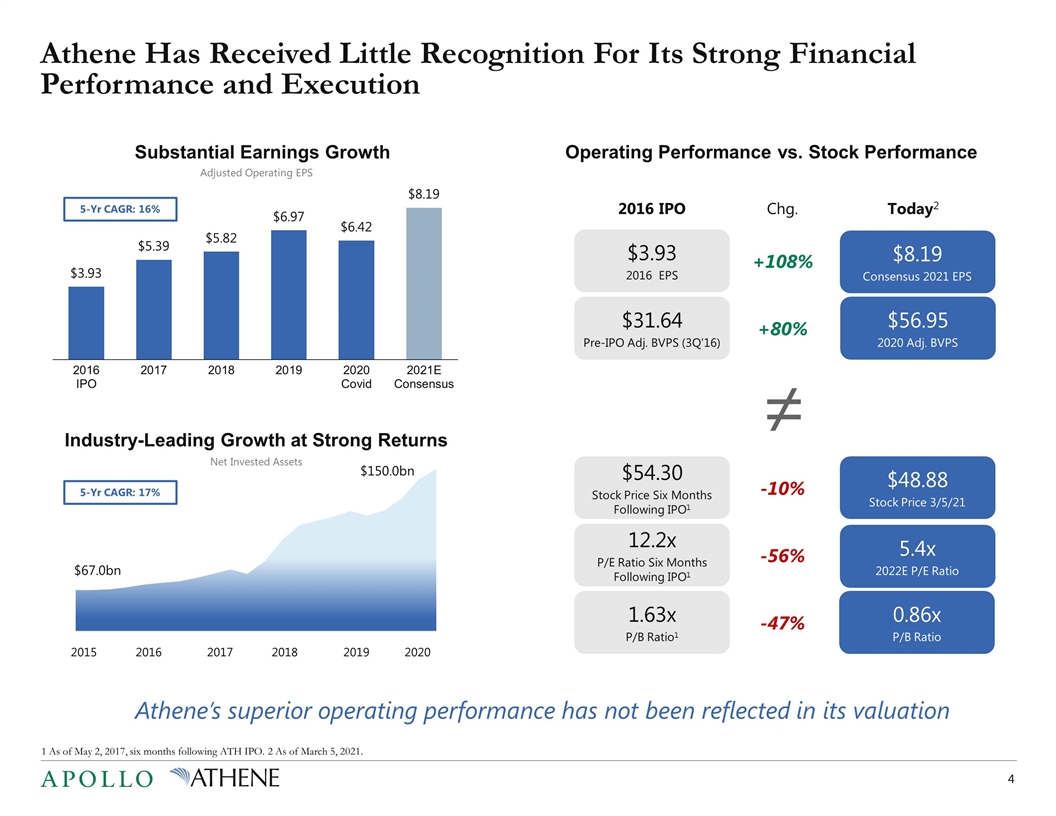
2016 2017 2018 2019 2020 Athene’s superior operating performance has not been reflected in its valuation Substantial Earnings Growth Industry-Leading Growth at Strong Returns Operating Performance vs. Stock Performance $54.30 Stock Price Six Months Following IPO1 2016 IPO 12.2x P/E Ratio Six Months Following IPO1 1.63x P/B Ratio1 $3.93 2016 EPS $31.64 Pre-IPO Adj. BVPS (3Q'16) $48.88 Stock Price 3/5/21 Today2 5.4x 2022E P/E Ratio $8.19 Consensus 2021 EPS $56.95 2020 Adj. BVPS 0.86x P/B Ratio Chg. +108% +80% -10% -56% -47% ≠ 5-Yr CAGR: 16% Adjusted Operating EPS 5-Yr CAGR: 17% Net Invested Assets 1 As of May 2, 2017, six months following ATH IPO. 2 As of March 5, 2021. Athene Has Received Little Recognition For Its Strong Financial Performance and Execution
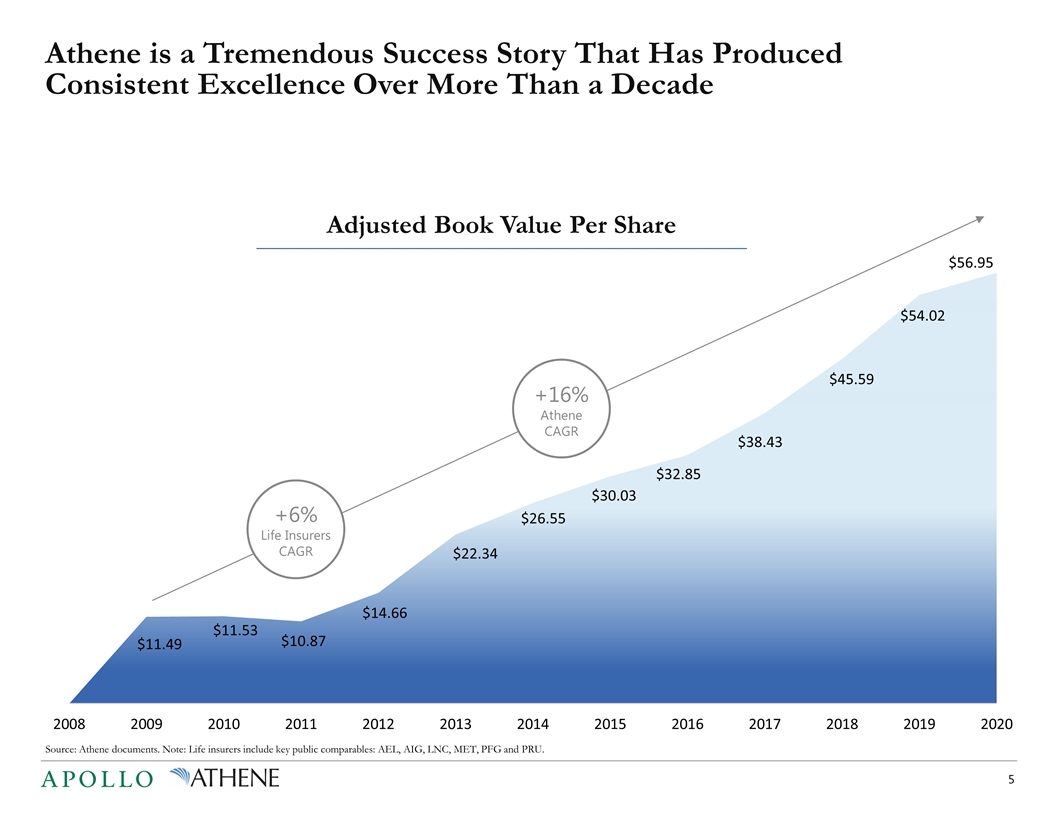
Athene is a Tremendous Success Story That Has Produced Consistent Excellence Over More Than a Decade +6% Life Insurers CAGR +16% Athene CAGR Adjusted Book Value Per Share Source: Athene documents. Note: Life insurers include key public comparables: AEL, AIG, LNC, MET, PFG and PRU.
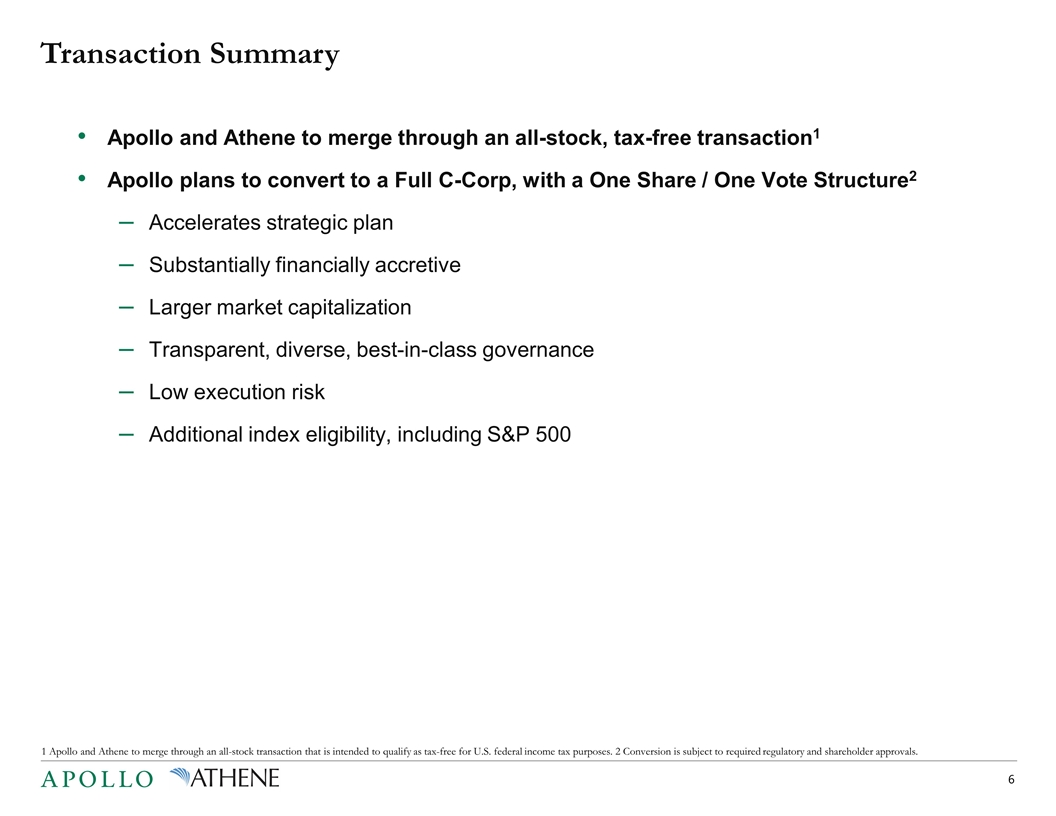
Transaction Summary Apollo and Athene to merge through an all-stock, tax-free transaction1 Apollo plans to convert to a Full C-Corp, with a One Share / One Vote Structure2 Accelerates strategic plan Substantially financially accretive Larger market capitalization Transparent, diverse, best-in-class governance Low execution risk Additional index eligibility, including S&P 500 1 Apollo and Athene to merge through an all-stock transaction that is intended to qualify as tax-free for U.S. federal income tax purposes. 2 Conversion is subject to required regulatory and shareholder approvals.
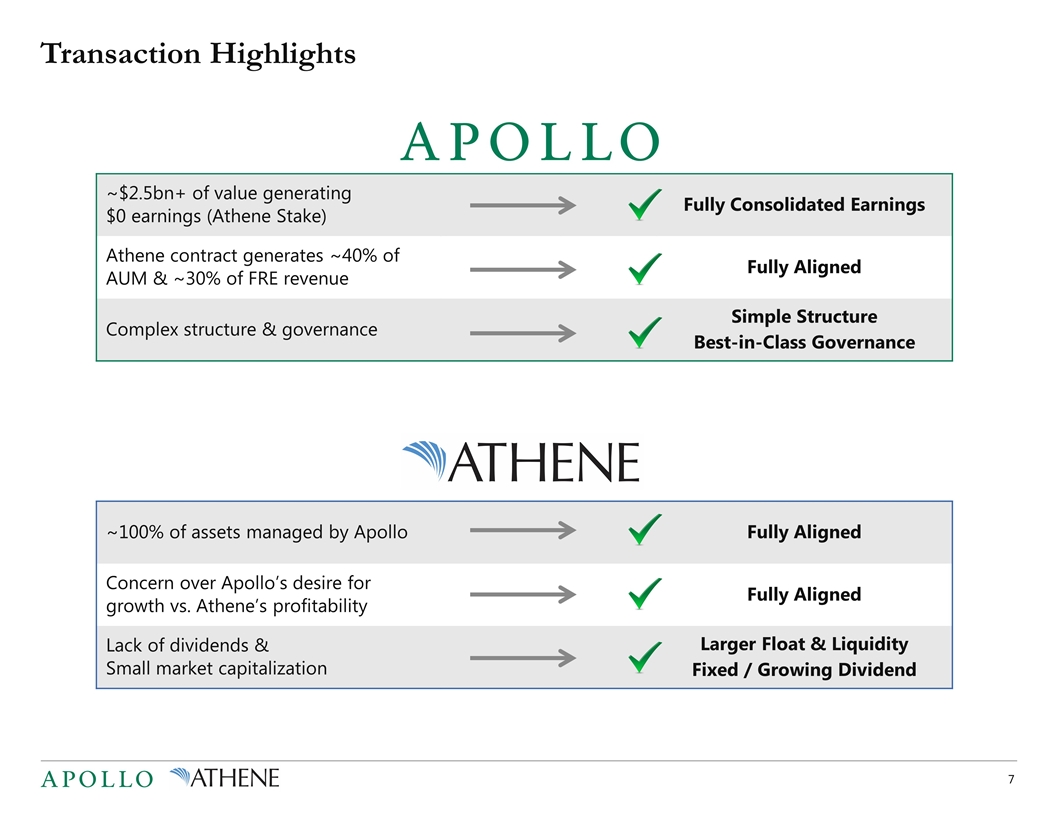
Transaction Highlights ~$2.5bn+ of value generating $0 earnings (Athene Stake) Fully Consolidated Earnings Athene contract generates ~40% of AUM & ~30% of FRE revenue Fully Aligned Complex structure & governance Simple Structure Best-in-Class Governance ~100% of assets managed by Apollo Fully Aligned Concern over Apollo’s desire for growth vs. Athene’s profitability Fully Aligned Lack of dividends & Small market capitalization Larger Float & Liquidity Fixed / Growing Dividend
Transaction Rationale This is about harnessing Apollo’s unique ability to generate excess returns at every point across the risk / reward spectrum (yield, hybrid, opportunistic) for the benefit of our insurance and asset management clients.
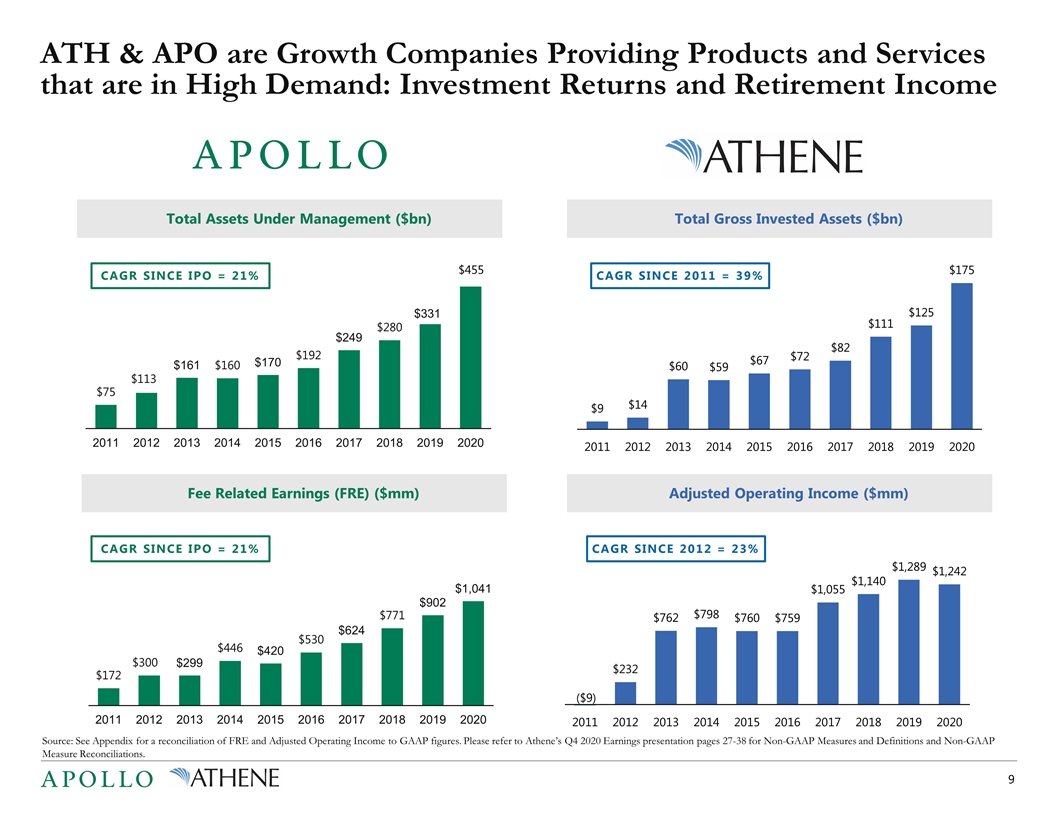
ATH & APO are Growth Companies Providing Products and Services that are in High Demand: Investment Returns and Retirement Income $455 Fee Related Earnings (FRE) ($mm) Total Assets Under Management ($bn) Total Gross Invested Assets ($bn) Adjusted Operating Income ($mm) CAGR SINCE IPO = 21% CAGR SINCE IPO = 21% CAGR SINCE 2011 = 39% CAGR SINCE 2012 = 23% Source: See Appendix for a reconciliation of FRE and Adjusted Operating Income to GAAP figures. Please refer to Athene’s Q4 2020 Earnings presentation pages 27-38 for Non-GAAP Measures and Definitions and Non-GAAP Measure Reconciliations.
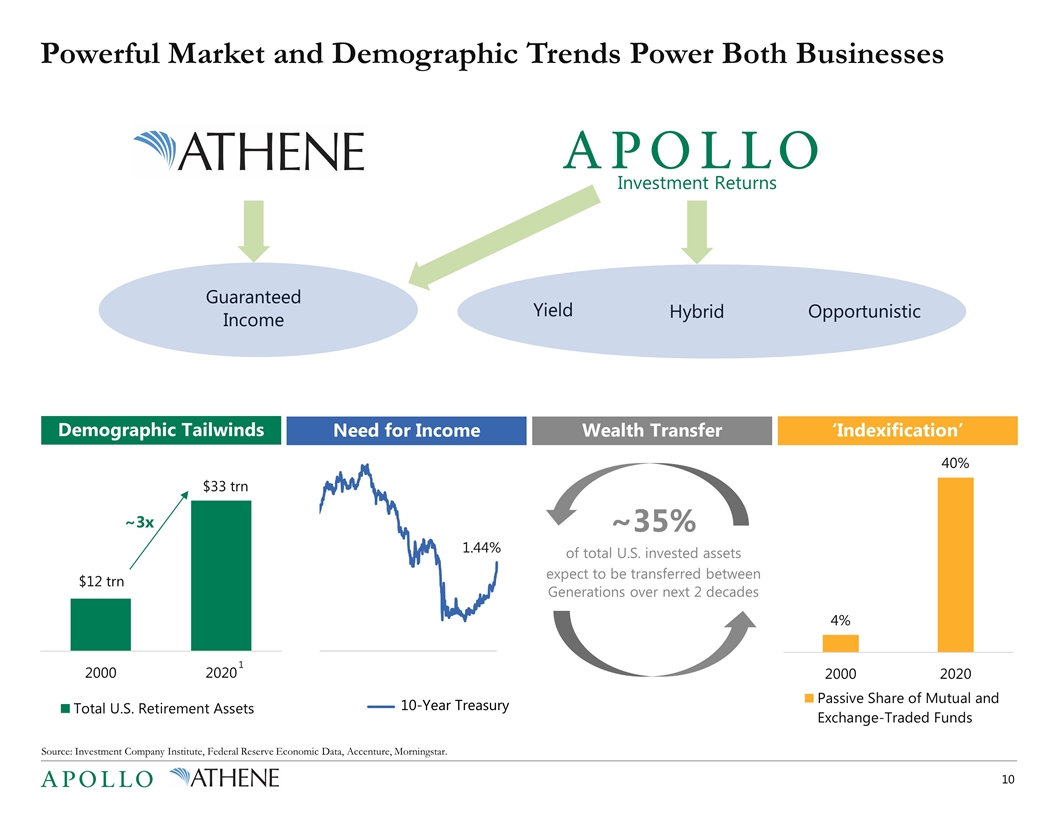
Powerful Market and Demographic Trends Power Both Businesses Guaranteed Income Investment Returns Yield Hybrid Opportunistic ~35% of total U.S. invested assets expect to be transferred between Generations over next 2 decades ~3x 1 Demographic Tailwinds Need for Income ‘Indexification’ Wealth Transfer Source: Investment Company Institute, Federal Reserve Economic Data, Accenture, Morningstar. 10-Year Treasury
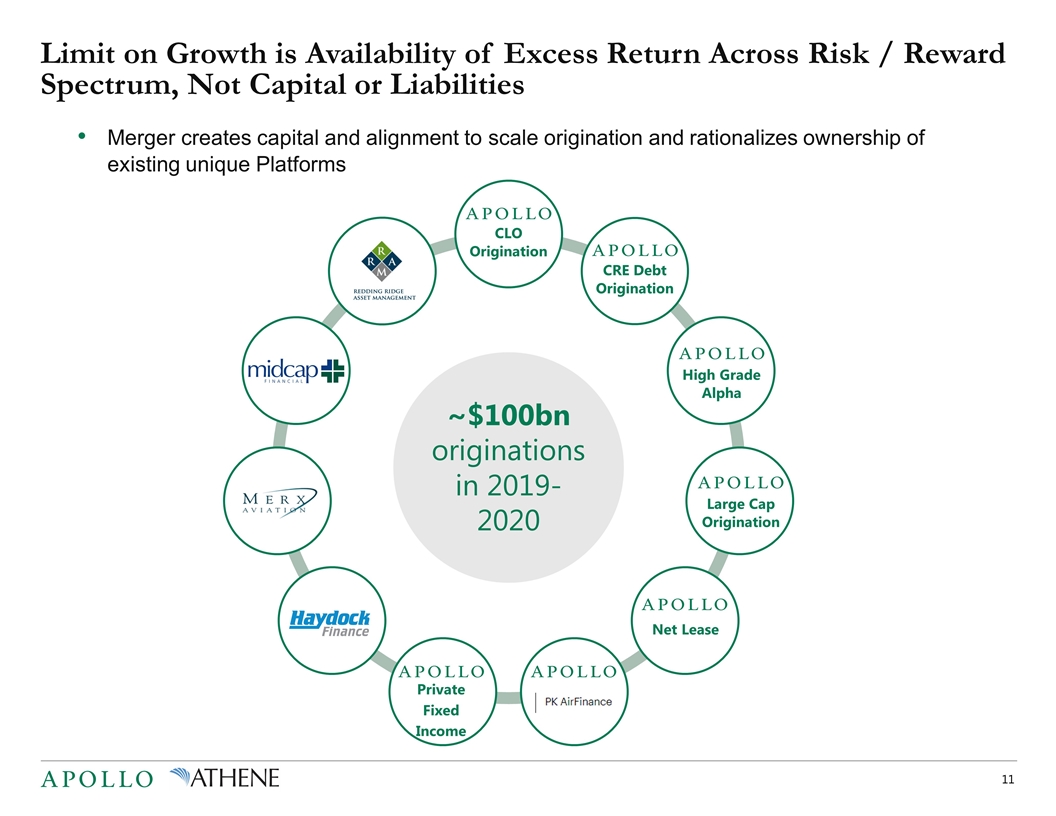
Limit on Growth is Availability of Excess Return Across Risk / Reward Spectrum, Not Capital or Liabilities Merger creates capital and alignment to scale origination and rationalizes ownership of existing unique Platforms CRE Debt Origination CLO Origination Large Cap Origination Private Fixed Income Net Lease High Grade Alpha ~$100bn originations in 2019-2020
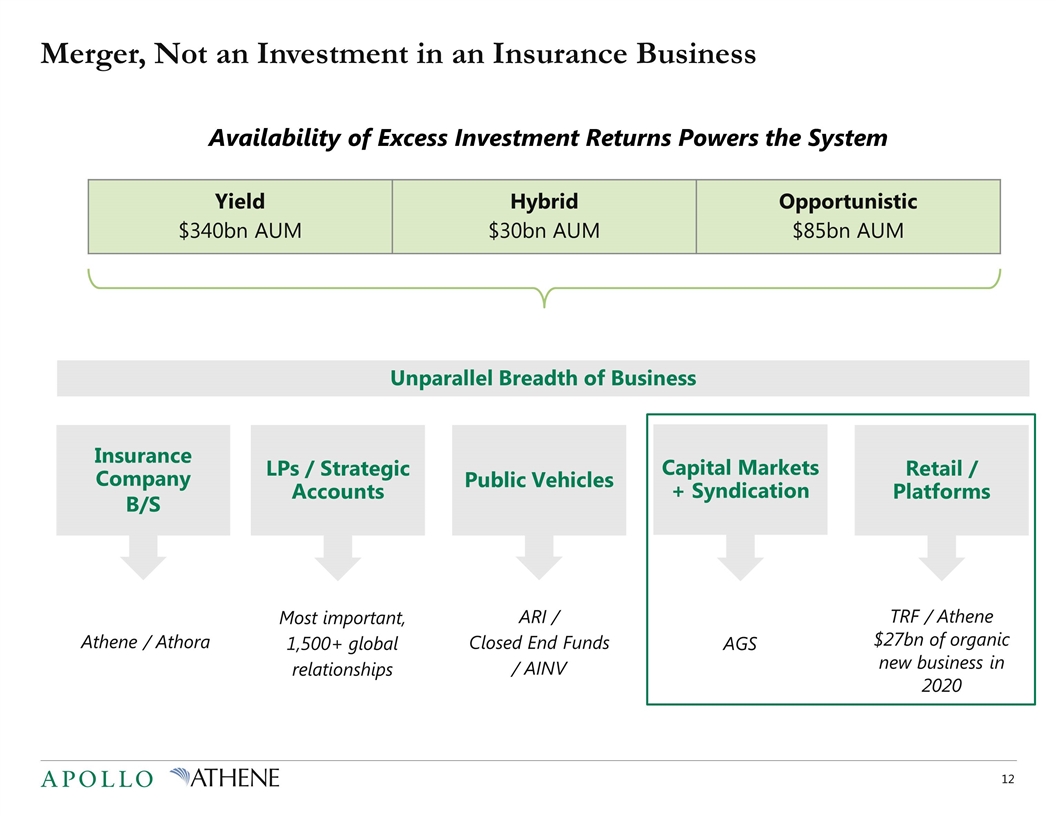
Merger, Not an Investment in an Insurance Business Availability of Excess Investment Returns Powers the System Athene / Athora Most important, 1,500+ global relationships ARI / Closed End Funds / AINV AGS TRF / Athene $27bn of organic new business in 2020 Yield $340bn AUM Hybrid $30bn AUM Opportunistic $85bn AUM Insurance Company B/S LPs / Strategic Accounts Public Vehicles Capital Markets + Syndication Retail / Platforms Unparallel Breadth of Business
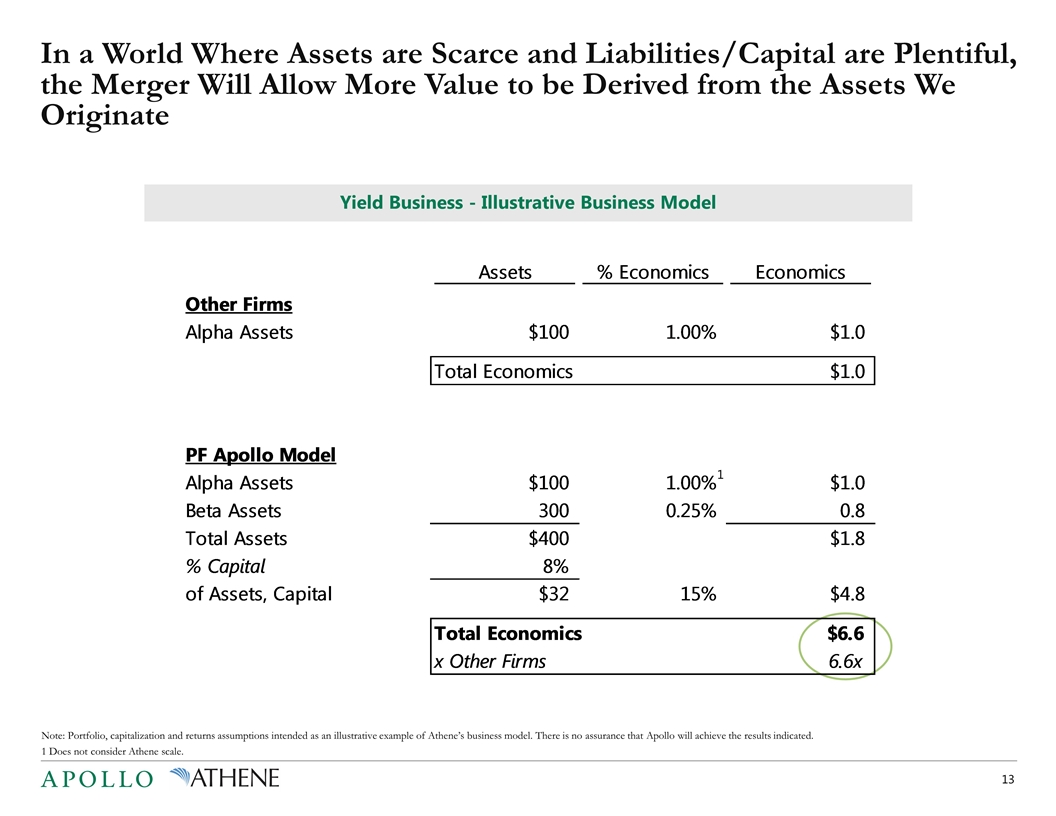
In a World Where Assets are Scarce and Liabilities/Capital are Plentiful, the Merger Will Allow More Value to be Derived from the Assets We Originate Yield Business - Illustrative Business Model Note: Portfolio, capitalization and returns assumptions intended as an illustrative example of Athene’s business model. There is no assurance that Apollo will achieve the results indicated. 1 Does not consider Athene scale. 1
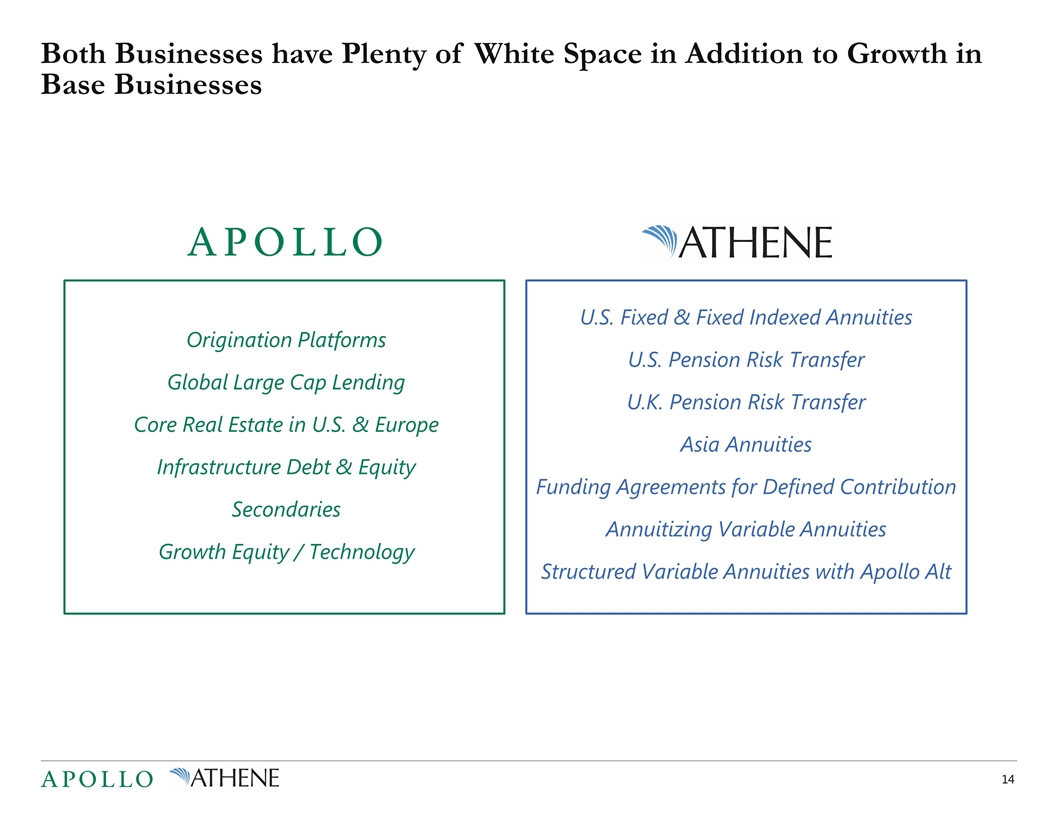
Both Businesses have Plenty of White Space in Addition to Growth in Base Businesses Origination Platforms Global Large Cap Lending Core Real Estate in U.S. & Europe Infrastructure Debt & Equity Secondaries Growth Equity / Technology $650 bn $500 bn U.S. Fixed & Fixed Indexed Annuities U.S. Pension Risk Transfer U.K. Pension Risk Transfer Asia Annuities Funding Agreements for Defined Contribution Annuitizing Variable Annuities Structured Variable Annuities with Apollo Alt
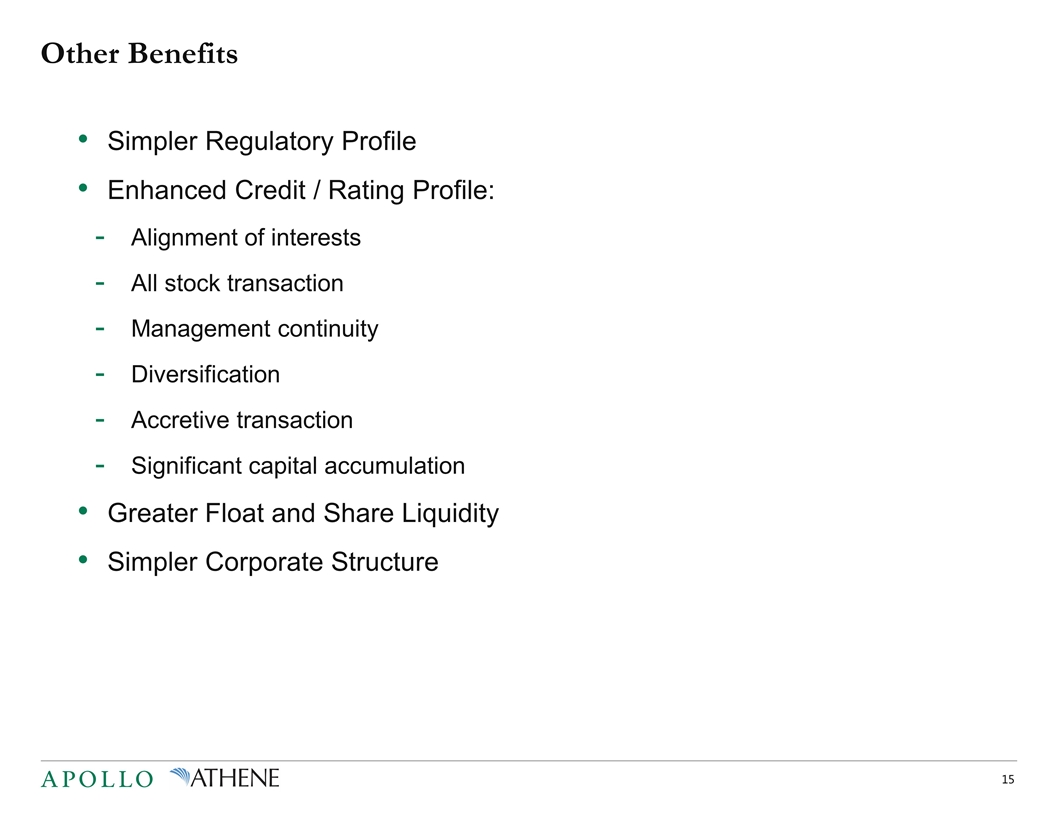
Other Benefits Simpler Regulatory Profile Enhanced Credit / Rating Profile: Alignment of interests All stock transaction Management continuity Diversification Accretive transaction Significant capital accumulation Greater Float and Share Liquidity Simpler Corporate Structure
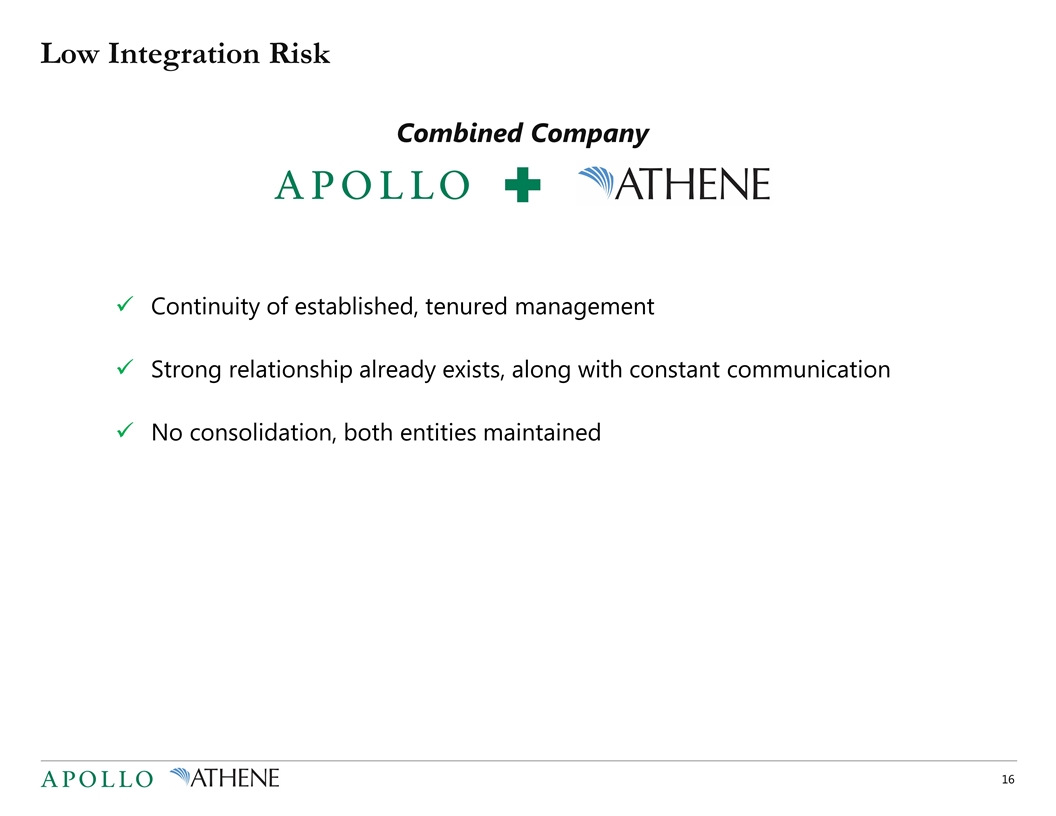
Low Integration Risk Continuity of established, tenured management Strong relationship already exists, along with constant communication No consolidation, both entities maintained Combined Company
Employees: This Transaction is About Coordination, Not Consolidation Vision. Deep sense of purpose to protect the livelihoods of retirees around the world Culture. Complete continuity of leadership and teams. Shared commitment to building a modern, high-performing culture Growth. Accelerates investment to support growth initiatives across all business lines. Combined Company
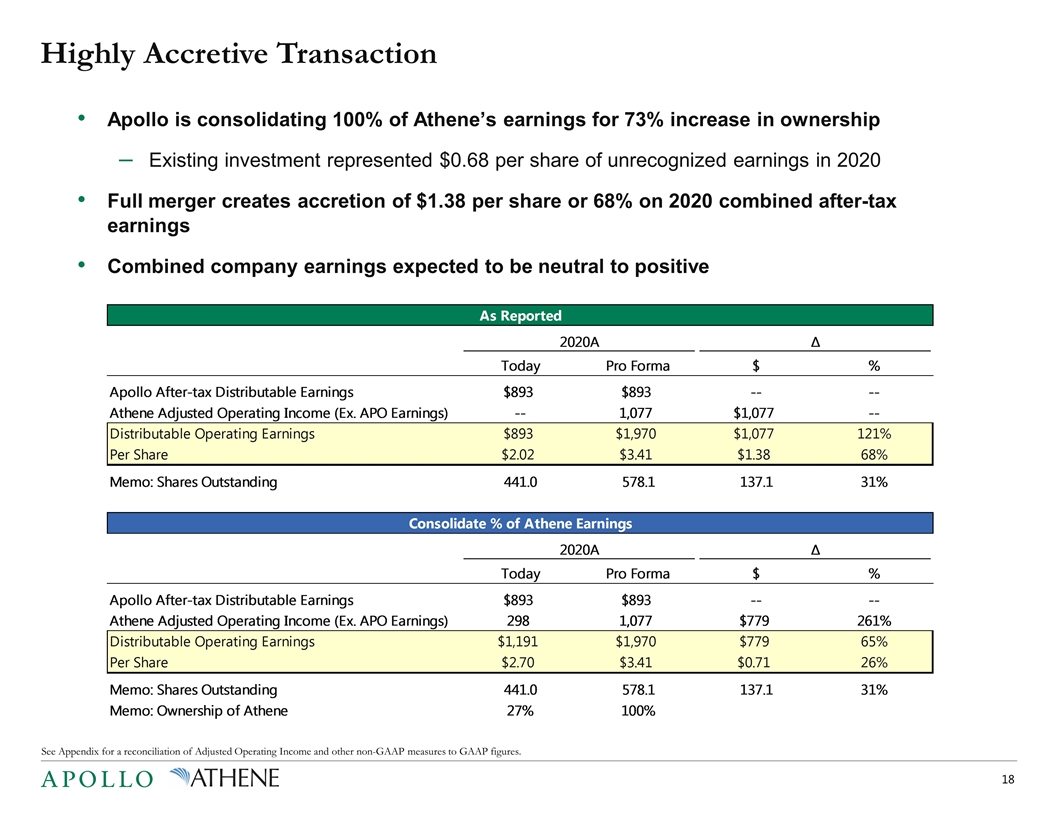
Highly Accretive Transaction Apollo is consolidating 100% of Athene’s earnings for 73% increase in ownership Existing investment represented $0.68 per share of unrecognized earnings in 2020 Full merger creates accretion of $1.38 per share or 68% on 2020 combined after-tax earnings Combined company earnings expected to be neutral to positive See Appendix for a reconciliation of Adjusted Operating Income and other non-GAAP measures to GAAP figures.
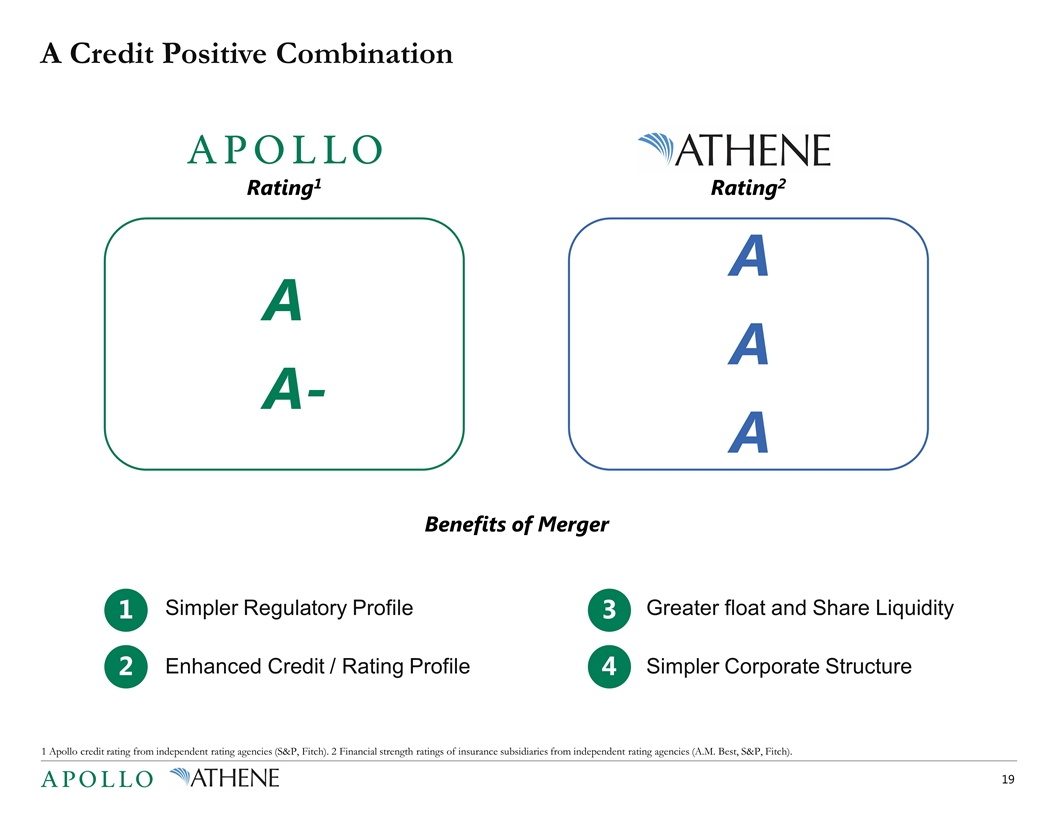
A Credit Positive Combination A A- Rating1 Rating2 A A A Benefits of Merger 1 2 Simpler Regulatory Profile Enhanced Credit / Rating Profile Greater float and Share Liquidity Simpler Corporate Structure 3 4 1 Apollo credit rating from independent rating agencies (S&P, Fitch). 2 Financial strength ratings of insurance subsidiaries from independent rating agencies (A.M. Best, S&P, Fitch).
Tax-Free Combination The merger is intended to qualify as a tax-free transaction for U.S. federal income tax purposes for all Apollo and Athene common shareholders Shareholders will have basis in New TopCo shares equal to their basis in their existing Apollo or Athene shares A shareholder’s holding period in their New TopCo shares will include the period they held their exchanged Apollo or Athene shares Distributions from New TopCo generally are expected to be treated as “qualified dividends” for U.S. federal income tax purposes
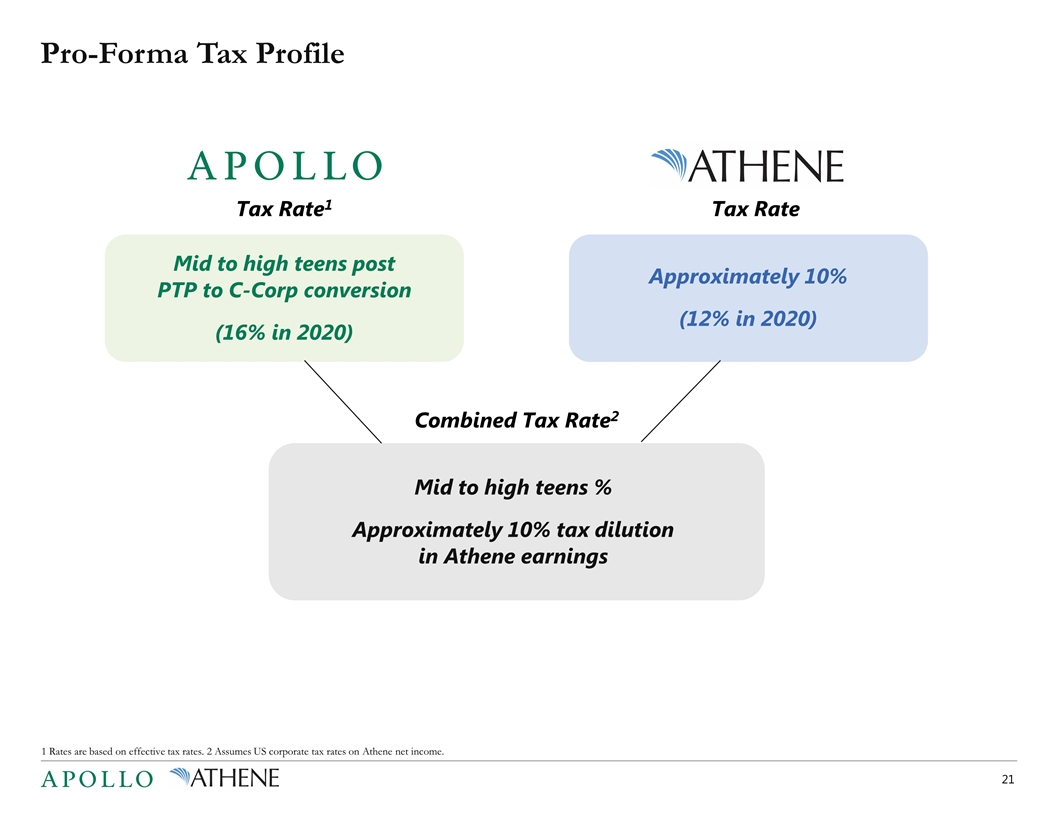
Pro-Forma Tax Profile Tax Rate1 Combined Tax Rate2 Tax Rate Approximately 10% (12% in 2020) Mid to high teens post PTP to C-Corp conversion (16% in 2020) Mid to high teens % Approximately 10% tax dilution in Athene earnings 1 Rates are based on effective tax rates. 2 Assumes US corporate tax rates on Athene net income.
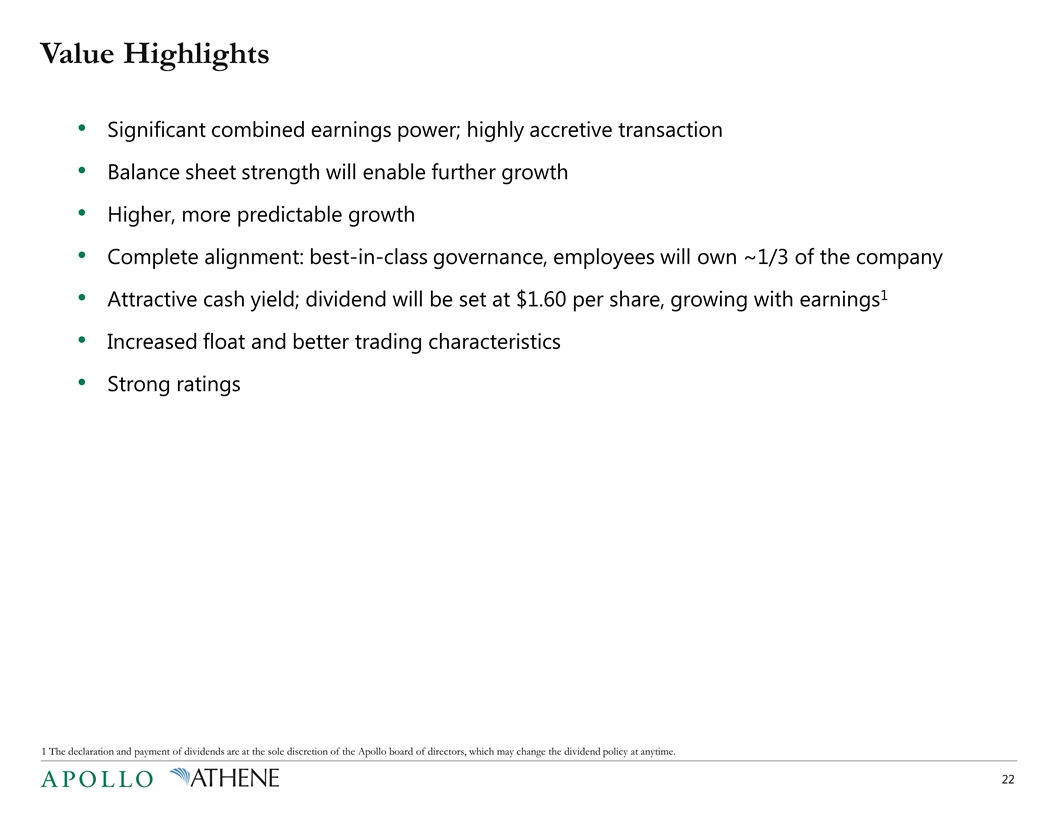
Value Highlights Significant combined earnings power; highly accretive transaction Balance sheet strength will enable further growth Higher, more predictable growth Complete alignment: best-in-class governance, employees will own ~1/3 of the company Attractive cash yield; dividend will be set at $1.60 per share, growing with earnings1 Increased float and better trading characteristics Strong ratings 1 The declaration and payment of dividends are at the sole discretion of the Apollo board of directors, which may change the dividend policy at anytime.

Appendix
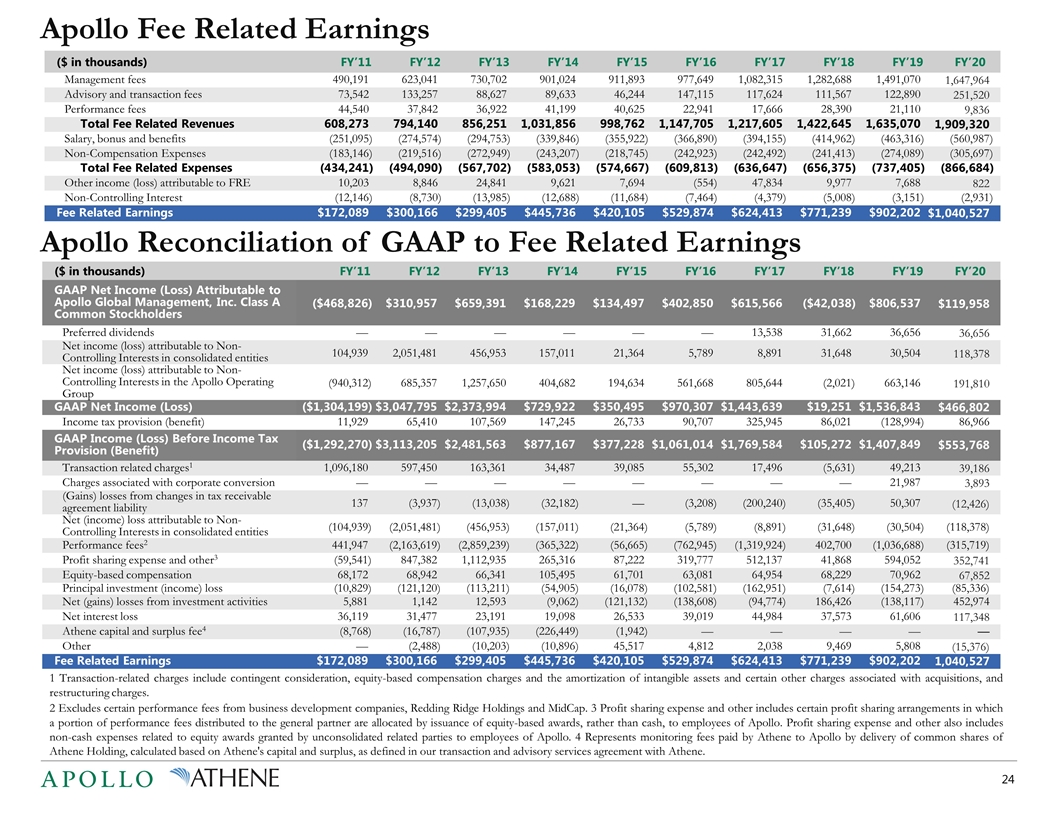
Apollo Fee Related Earnings 1 Transaction-related charges include contingent consideration, equity-based compensation charges and the amortization of intangible assets and certain other charges associated with acquisitions, and restructuring charges. 2 Excludes certain performance fees from business development companies, Redding Ridge Holdings and MidCap. 3 Profit sharing expense and other includes certain profit sharing arrangements in which a portion of performance fees distributed to the general partner are allocated by issuance of equity-based awards, rather than cash, to employees of Apollo. Profit sharing expense and other also includes non-cash expenses related to equity awards granted by unconsolidated related parties to employees of Apollo. 4 Represents monitoring fees paid by Athene to Apollo by delivery of common shares of Athene Holding, calculated based on Athene's capital and surplus, as defined in our transaction and advisory services agreement with Athene. ($ in thousands) FY’11 FY’12 FY’13 FY’14 FY’15 FY’16 FY’17 FY’18 FY’19 FY’20 Management fees 490,191 623,041 730,702 901,024 911,893 977,649 1,082,315 1,282,688 1,491,070 1,647,964 Advisory and transaction fees 73,542 133,257 88,627 89,633 46,244 147,115 117,624 111,567 122,890 251,520 Performance fees 44,540 37,842 36,922 41,199 40,625 22,941 17,666 28,390 21,110 9,836 Total Fee Related Revenues 608,273 794,140 856,251 1,031,856 998,762 1,147,705 1,217,605 1,422,645 1,635,070 1,909,320 Salary, bonus and benefits (251,095 ) (274,574 ) (294,753 ) (339,846 ) (355,922 ) (366,890 ) (394,155 ) (414,962 ) (463,316 ) (560,987 ) Non-Compensation Expenses (183,146 ) (219,516 ) (272,949 ) (243,207 ) (218,745 ) (242,923 ) (242,492 ) (241,413 ) (274,089 ) (305,697 ) Total Fee Related Expenses (434,241 ) (494,090 ) (567,702 ) (583,053 ) (574,667 ) (609,813 ) (636,647 ) (656,375 ) (737,405 ) (866,684 ) Other income (loss) attributable to FRE 10,203 8,846 24,841 9,621 7,694 (554 ) 47,834 9,977 7,688 822 Non-Controlling Interest (12,146 ) (8,730 ) (13,985 ) (12,688 ) (11,684 ) (7,464 ) (4,379 ) (5,008 ) (3,151 ) (2,931 ) Fee Related Earnings $172,089 $300,166 $299,405 $445,736 $420,105 $529,874 $624,413 $771,239 $902,202 $1,040,527 Apollo Reconciliation of GAAP to Fee Related Earnings ($ in thousands) FY’11 FY’12 FY’13 FY’14 FY’15 FY’16 FY’17 FY’18 FY’19 FY’20 GAAP Net Income (Loss) Attributable to Apollo Global Management, Inc. Class A Common Stockholders ($468,826 ) $310,957 $659,391 $168,229 $134,497 $402,850 $615,566 ($42,038 ) $806,537 $119,958 Preferred dividends — — — — — — 13,538 31,662 36,656 36,656 Net income (loss) attributable to Non-Controlling Interests in consolidated entities 104,939 2,051,481 456,953 157,011 21,364 5,789 8,891 31,648 30,504 118,378 Net income (loss) attributable to Non-Controlling Interests in the Apollo Operating Group (940,312 ) 685,357 1,257,650 404,682 194,634 561,668 805,644 (2,021 ) 663,146 191,810 GAAP Net Income (Loss) ($1,304,199 ) $3,047,795 $2,373,994 $729,922 $350,495 $970,307 $1,443,639 $19,251 $1,536,843 $466,802 Income tax provision (benefit) 11,929 65,410 107,569 147,245 26,733 90,707 325,945 86,021 (128,994 ) 86,966 GAAP Income (Loss) Before Income Tax Provision (Benefit) ($1,292,270 ) $3,113,205 $2,481,563 $877,167 $377,228 $1,061,014 $1,769,584 $105,272 $1,407,849 $553,768 Transaction related charges1 1,096,180 597,450 163,361 34,487 39,085 55,302 17,496 (5,631 ) 49,213 39,186 Charges associated with corporate conversion — — — — — — — — 21,987 3,893 (Gains) losses from changes in tax receivable agreement liability 137 (3,937 ) (13,038 ) (32,182 ) — (3,208 ) (200,240 ) (35,405 ) 50,307 (12,426) Net (income) loss attributable to Non-Controlling Interests in consolidated entities (104,939 ) (2,051,481 ) (456,953 ) (157,011 ) (21,364 ) (5,789 ) (8,891 ) (31,648 ) (30,504 ) (118,378) Performance fees2 441,947 (2,163,619 ) (2,859,239 ) (365,322 ) (56,665 ) (762,945 ) (1,319,924 ) 402,700 (1,036,688 ) (315,719) Profit sharing expense and other3 (59,541 ) 847,382 1,112,935 265,316 87,222 319,777 512,137 41,868 594,052 352,741 Equity-based compensation 68,172 68,942 66,341 105,495 61,701 63,081 64,954 68,229 70,962 67,852 Principal investment (income) loss (10,829 ) (121,120 ) (113,211 ) (54,905 ) (16,078 ) (102,581 ) (162,951 ) (7,614 ) (154,273 ) (85,336) Net (gains) losses from investment activities 5,881 1,142 12,593 (9,062 ) (121,132 ) (138,608 ) (94,774 ) 186,426 (138,117 ) 452,974 Net interest loss 36,119 31,477 23,191 19,098 26,533 39,019 44,984 37,573 61,606 117,348 Athene capital and surplus fee4 (8,768 ) (16,787 ) (107,935 ) (226,449 ) (1,942 ) — — — — — Other — (2,488 ) (10,203 ) (10,896 ) 45,517 4,812 2,038 9,469 5,808 (15,376) Fee Related Earnings $172,089 $300,166 $299,405 $445,736 $420,105 $529,874 $624,413 $771,239 $902,202 1,040,527
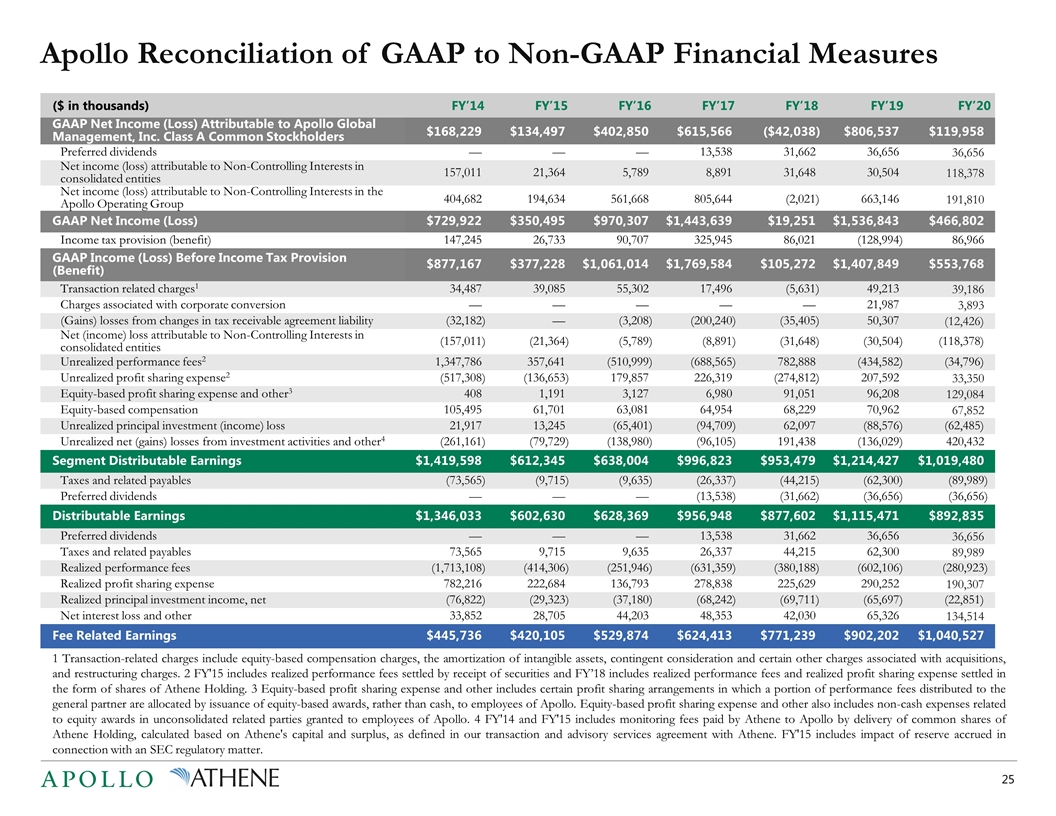
Apollo Reconciliation of GAAP to Non-GAAP Financial Measures ($ in thousands) FY’14 FY’15 FY’16 FY’17 FY’18 FY’19 FY’20 GAAP Net Income (Loss) Attributable to Apollo Global Management, Inc. Class A Common Stockholders $168,229 $134,497 $402,850 $615,566 ($42,038 ) $806,537 $119,958 Preferred dividends — — — 13,538 31,662 36,656 36,656 Net income (loss) attributable to Non-Controlling Interests in consolidated entities 157,011 21,364 5,789 8,891 31,648 30,504 118,378 Net income (loss) attributable to Non-Controlling Interests in the Apollo Operating Group 404,682 194,634 561,668 805,644 (2,021 ) 663,146 191,810 GAAP Net Income (Loss) $729,922 $350,495 $970,307 $1,443,639 $19,251 $1,536,843 $466,802 Income tax provision (benefit) 147,245 26,733 90,707 325,945 86,021 (128,994 ) 86,966 GAAP Income (Loss) Before Income Tax Provision (Benefit) $877,167 $377,228 $1,061,014 $1,769,584 $105,272 $1,407,849 $553,768 Transaction related charges1 34,487 39,085 55,302 17,496 (5,631 ) 49,213 39,186 Charges associated with corporate conversion — — — — — 21,987 3,893 (Gains) losses from changes in tax receivable agreement liability (32,182 ) — (3,208 ) (200,240 ) (35,405 ) 50,307 (12,426) Net (income) loss attributable to Non-Controlling Interests in consolidated entities (157,011 ) (21,364 ) (5,789 ) (8,891 ) (31,648 ) (30,504 ) (118,378) Unrealized performance fees2 1,347,786 357,641 (510,999 ) (688,565 ) 782,888 (434,582 ) (34,796) Unrealized profit sharing expense2 (517,308 ) (136,653 ) 179,857 226,319 (274,812 ) 207,592 33,350 Equity-based profit sharing expense and other3 408 1,191 3,127 6,980 91,051 96,208 129,084 Equity-based compensation 105,495 61,701 63,081 64,954 68,229 70,962 67,852 Unrealized principal investment (income) loss 21,917 13,245 (65,401 ) (94,709 ) 62,097 (88,576 ) (62,485) Unrealized net (gains) losses from investment activities and other4 (261,161 ) (79,729 ) (138,980 ) (96,105 ) 191,438 (136,029 ) 420,432 Segment Distributable Earnings $1,419,598 $612,345 $638,004 $996,823 $953,479 $1,214,427 $1,019,480 Taxes and related payables (73,565 ) (9,715 ) (9,635 ) (26,337 ) (44,215 ) (62,300 ) (89,989 ) Preferred dividends — — — (13,538 ) (31,662 ) (36,656 ) (36,656 ) Distributable Earnings $1,346,033 $602,630 $628,369 $956,948 $877,602 $1,115,471 $892,835 Preferred dividends — — — 13,538 31,662 36,656 36,656 Taxes and related payables 73,565 9,715 9,635 26,337 44,215 62,300 89,989 Realized performance fees (1,713,108 ) (414,306 ) (251,946 ) (631,359 ) (380,188 ) (602,106 ) (280,923 ) Realized profit sharing expense 782,216 222,684 136,793 278,838 225,629 290,252 190,307 Realized principal investment income, net (76,822 ) (29,323 ) (37,180 ) (68,242 ) (69,711 ) (65,697 ) (22,851) Net interest loss and other 33,852 28,705 44,203 48,353 42,030 65,326 134,514 Fee Related Earnings $445,736 $420,105 $529,874 $624,413 $771,239 $902,202 $1,040,527 1 Transaction-related charges include equity-based compensation charges, the amortization of intangible assets, contingent consideration and certain other charges associated with acquisitions, and restructuring charges. 2 FY'15 includes realized performance fees settled by receipt of securities and FY’18 includes realized performance fees and realized profit sharing expense settled in the form of shares of Athene Holding. 3 Equity-based profit sharing expense and other includes certain profit sharing arrangements in which a portion of performance fees distributed to the general partner are allocated by issuance of equity-based awards, rather than cash, to employees of Apollo. Equity-based profit sharing expense and other also includes non-cash expenses related to equity awards in unconsolidated related parties granted to employees of Apollo. 4 FY'14 and FY'15 includes monitoring fees paid by Athene to Apollo by delivery of common shares of Athene Holding, calculated based on Athene's capital and surplus, as defined in our transaction and advisory services agreement with Athene. FY'15 includes impact of reserve accrued in connection with an SEC regulatory matter.
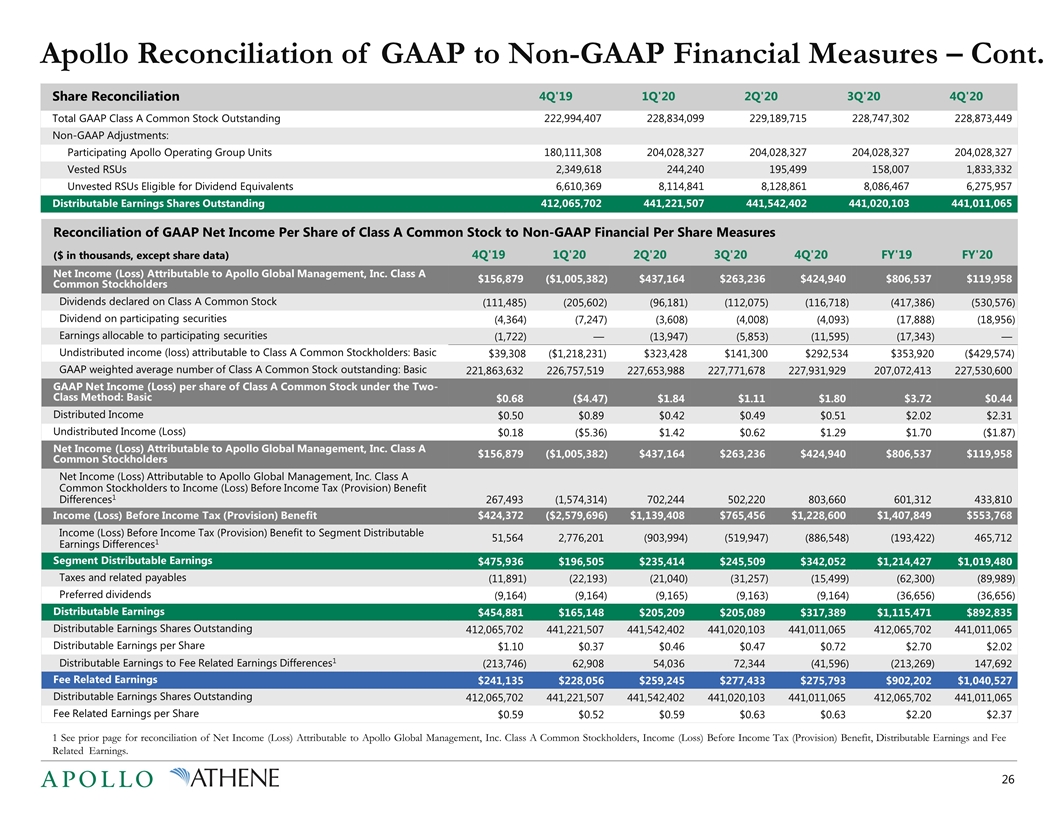
Apollo Reconciliation of GAAP to Non-GAAP Financial Measures – Cont. 1 See prior page for reconciliation of Net Income (Loss) Attributable to Apollo Global Management, Inc. Class A Common Stockholders, Income (Loss) Before Income Tax (Provision) Benefit, Distributable Earnings and Fee Related Earnings. Share Reconciliation 4Q'19 1Q'20 2Q'20 3Q'20 4Q'20 Total GAAP Class A Common Stock Outstanding 222,994,407 228,834,099 229,189,715 228,747,302 228,873,449 Non-GAAP Adjustments: Participating Apollo Operating Group Units 180,111,308 204,028,327 204,028,327 204,028,327 204,028,327 Vested RSUs 2,349,618 244,240 195,499 158,007 1,833,332 Unvested RSUs Eligible for Dividend Equivalents 6,610,369 8,114,841 8,128,861 8,086,467 6,275,957 Distributable Earnings Shares Outstanding 412,065,702 441,221,507 441,542,402 441,020,103 441,011,065 Reconciliation of GAAP Net Income Per Share of Class A Common Stock to Non-GAAP Financial Per Share Measures ($ in thousands, except share data) 4Q'19 1Q'20 2Q'20 3Q'20 4Q'20 FY'19 FY'20 Net Income (Loss) Attributable to Apollo Global Management, Inc. Class A Common Stockholders $156,879 ($1,005,382 ) $437,164 $263,236 $424,940 $806,537 $119,958 Dividends declared on Class A Common Stock (111,485 ) (205,602 ) (96,181 ) (112,075 ) (116,718 ) (417,386 ) (530,576 ) Dividend on participating securities (4,364 ) (7,247 ) (3,608 ) (4,008 ) (4,093 ) (17,888 ) (18,956 ) Earnings allocable to participating securities (1,722 ) — (13,947 ) (5,853 ) (11,595 ) (17,343 ) — Undistributed income (loss) attributable to Class A Common Stockholders: Basic $39,308 ($1,218,231) $323,428 $141,300 $292,534 $353,920 ($429,574) GAAP weighted average number of Class A Common Stock outstanding: Basic 221,863,632 226,757,519 227,653,988 227,771,678 227,931,929 207,072,413 227,530,600 GAAP Net Income (Loss) per share of Class A Common Stock under the Two-Class Method: Basic $0.68 ($4.47 ) $1.84 $1.11 $1.80 $3.72 $0.44 Distributed Income $0.50 $0.89 $0.42 $0.49 $0.51 $2.02 $2.31 Undistributed Income (Loss) $0.18 ($5.36 ) $1.42 $0.62 $1.29 $1.70 ($1.87 ) Net Income (Loss) Attributable to Apollo Global Management, Inc. Class A Common Stockholders $156,879 ($1,005,382 ) $437,164 $263,236 $424,940 $806,537 $119,958 Net Income (Loss) Attributable to Apollo Global Management, Inc. Class A Common Stockholders to Income (Loss) Before Income Tax (Provision) Benefit Differences1 267,493 (1,574,314 ) 702,244 502,220 803,660 601,312 433,810 Income (Loss) Before Income Tax (Provision) Benefit $424,372 ($2,579,696 ) $1,139,408 $765,456 $1,228,600 $1,407,849 $553,768 Income (Loss) Before Income Tax (Provision) Benefit to Segment Distributable Earnings Differences1 51,564 2,776,201 (903,994 ) (519,947 ) (886,548 ) (193,422 ) 465,712 Segment Distributable Earnings $475,936 $196,505 $235,414 $245,509 $342,052 $1,214,427 $1,019,480 Taxes and related payables (11,891 ) (22,193 ) (21,040 ) (31,257 ) (15,499 ) (62,300 ) (89,989 ) Preferred dividends (9,164 ) (9,164 ) (9,165 ) (9,163 ) (9,164 ) (36,656 ) (36,656 ) Distributable Earnings $454,881 $165,148 $205,209 $205,089 $317,389 $1,115,471 $892,835 Distributable Earnings Shares Outstanding 412,065,702 441,221,507 441,542,402 441,020,103 441,011,065 412,065,702 441,011,065 Distributable Earnings per Share $1.10 $0.37 $0.46 $0.47 $0.72 $2.70 $2.02 Distributable Earnings to Fee Related Earnings Differences1 (213,746 ) 62,908 54,036 72,344 (41,596 ) (213,269 ) 147,692 Fee Related Earnings $241,135 $228,056 $259,245 $277,433 $275,793 $902,202 $1,040,527 Distributable Earnings Shares Outstanding 412,065,702 441,221,507 441,542,402 441,020,103 441,011,065 412,065,702 441,011,065 Fee Related Earnings per Share $0.59 $0.52 $0.59 $0.63 $0.63 $2.20 $2.37
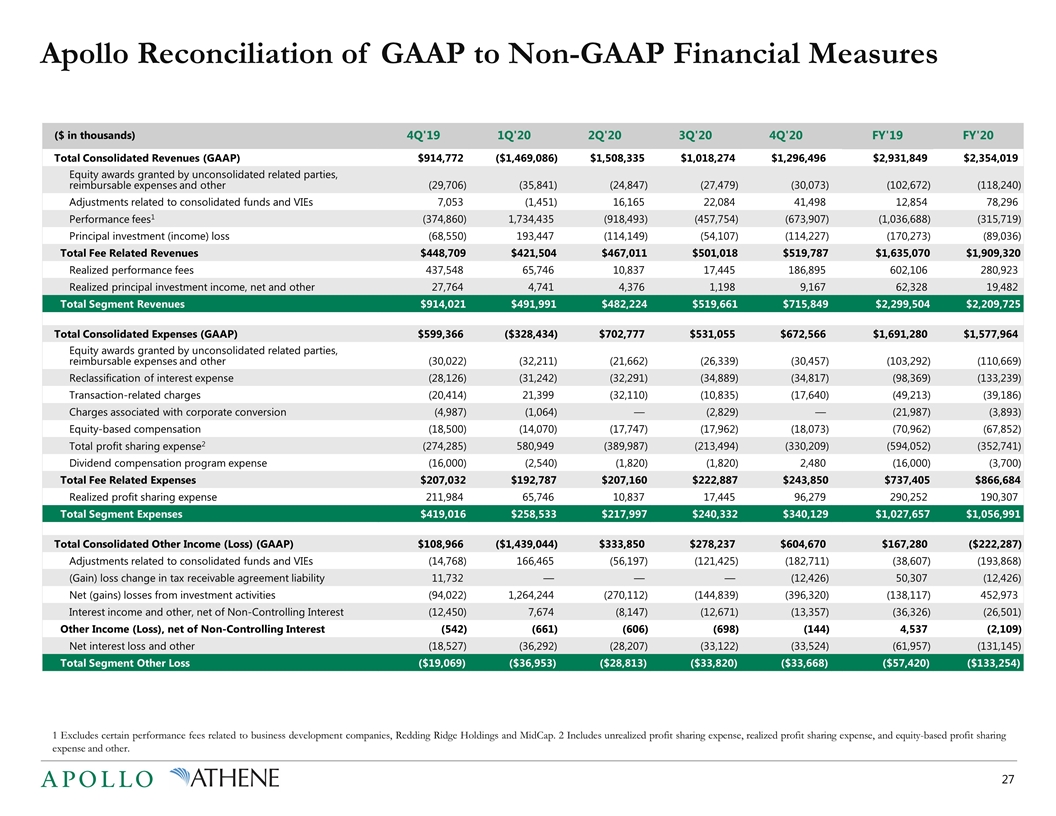
Apollo Reconciliation of GAAP to Non-GAAP Financial Measures ($ in thousands) 4Q'19 1Q'20 2Q'20 3Q'20 4Q'20 FY'19 FY'20 Total Consolidated Revenues (GAAP) $914,772 ($1,469,086 ) $1,508,335 $1,018,274 $1,296,496 $2,931,849 $2,354,019 Equity awards granted by unconsolidated related parties, reimbursable expenses and other (29,706 ) (35,841 ) (24,847 ) (27,479 ) (30,073 ) (102,672 ) (118,240 ) Adjustments related to consolidated funds and VIEs 7,053 (1,451 ) 16,165 22,084 41,498 12,854 78,296 Performance fees1 (374,860 ) 1,734,435 (918,493 ) (457,754 ) (673,907 ) (1,036,688 ) (315,719 ) Principal investment (income) loss (68,550 ) 193,447 (114,149 ) (54,107 ) (114,227 ) (170,273 ) (89,036 ) Total Fee Related Revenues $448,709 $421,504 $467,011 $501,018 $519,787 $1,635,070 $1,909,320 Realized performance fees 437,548 65,746 10,837 17,445 186,895 602,106 280,923 Realized principal investment income, net and other 27,764 4,741 4,376 1,198 9,167 62,328 19,482 Total Segment Revenues $914,021 $491,991 $482,224 $519,661 $715,849 $2,299,504 $2,209,725 Total Consolidated Expenses (GAAP) $599,366 ($328,434 ) $702,777 $531,055 $672,566 $1,691,280 $1,577,964 Equity awards granted by unconsolidated related parties, reimbursable expenses and other (30,022 ) (32,211 ) (21,662 ) (26,339 ) (30,457 ) (103,292 ) (110,669 ) Reclassification of interest expense (28,126 ) (31,242 ) (32,291 ) (34,889 ) (34,817 ) (98,369 ) (133,239 ) Transaction-related charges (20,414 ) 21,399 (32,110 ) (10,835 ) (17,640 ) (49,213 ) (39,186 ) Charges associated with corporate conversion (4,987 ) (1,064 ) — (2,829 ) — (21,987 ) (3,893 ) Equity-based compensation (18,500 ) (14,070 ) (17,747 ) (17,962 ) (18,073 ) (70,962 ) (67,852 ) Total profit sharing expense2 (274,285 ) 580,949 (389,987 ) (213,494 ) (330,209 ) (594,052 ) (352,741 ) Dividend compensation program expense (16,000 ) (2,540 ) (1,820 ) (1,820 ) 2,480 (16,000 ) (3,700 ) Total Fee Related Expenses $207,032 $192,787 $207,160 $222,887 $243,850 $737,405 $866,684 Realized profit sharing expense 211,984 65,746 10,837 17,445 96,279 290,252 190,307 Total Segment Expenses $419,016 $258,533 $217,997 $240,332 $340,129 $1,027,657 $1,056,991 Total Consolidated Other Income (Loss) (GAAP) $108,966 ($1,439,044 ) $333,850 $278,237 $604,670 $167,280 ($222,287 ) Adjustments related to consolidated funds and VIEs (14,768 ) 166,465 (56,197 ) (121,425 ) (182,711 ) (38,607 ) (193,868 ) (Gain) loss change in tax receivable agreement liability 11,732 — — — (12,426 ) 50,307 (12,426 ) Net (gains) losses from investment activities (94,022 ) 1,264,244 (270,112 ) (144,839 ) (396,320 ) (138,117 ) 452,973 Interest income and other, net of Non-Controlling Interest (12,450 ) 7,674 (8,147 ) (12,671 ) (13,357 ) (36,326 ) (26,501 ) Other Income (Loss), net of Non-Controlling Interest (542 ) (661 ) (606 ) (698 ) (144 ) 4,537 (2,109 ) Net interest loss and other (18,527 ) (36,292 ) (28,207 ) (33,122 ) (33,524 ) (61,957 ) (131,145 ) Total Segment Other Loss ($19,069) ($36,953) ($28,813) ($33,820) ($33,668) ($57,420) ($133,254) 1 Excludes certain performance fees related to business development companies, Redding Ridge Holdings and MidCap. 2 Includes unrealized profit sharing expense, realized profit sharing expense, and equity-based profit sharing expense and other.
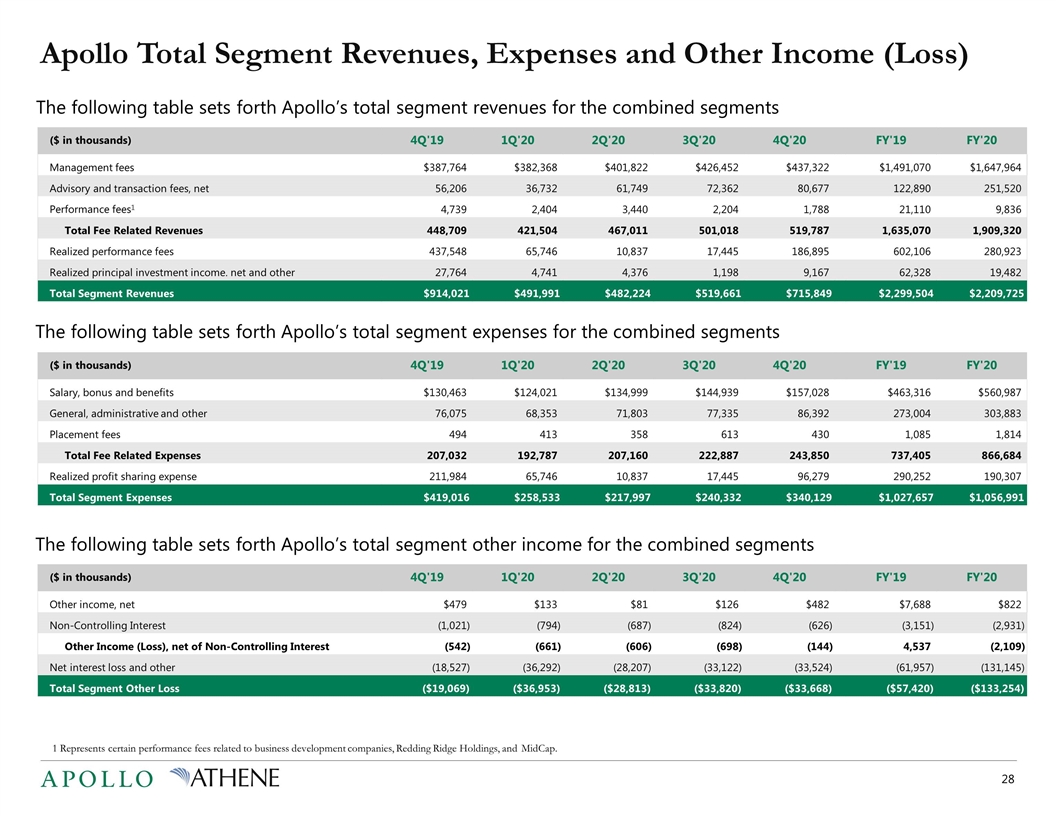
Apollo Total Segment Revenues, Expenses and Other Income (Loss) ($ in thousands) 4Q'19 1Q'20 2Q'20 3Q'20 4Q'20 FY'19 FY'20 Management fees $387,764 $382,368 $401,822 $426,452 $437,322 $1,491,070 $1,647,964 Advisory and transaction fees, net 56,206 36,732 61,749 72,362 80,677 122,890 251,520 Performance fees1 4,739 2,404 3,440 2,204 1,788 21,110 9,836 Total Fee Related Revenues 448,709 421,504 467,011 501,018 519,787 1,635,070 1,909,320 Realized performance fees 437,548 65,746 10,837 17,445 186,895 602,106 280,923 Realized principal investment income. net and other 27,764 4,741 4,376 1,198 9,167 62,328 19,482 Total Segment Revenues $914,021 $491,991 $482,224 $519,661 $715,849 $2,299,504 $2,209,725 ($ in thousands) 4Q'19 1Q'20 2Q'20 3Q'20 4Q'20 FY'19 FY'20 Salary, bonus and benefits $130,463 $124,021 $134,999 $144,939 $157,028 $463,316 $560,987 General, administrative and other 76,075 68,353 71,803 77,335 86,392 273,004 303,883 Placement fees 494 413 358 613 430 1,085 1,814 Total Fee Related Expenses 207,032 192,787 207,160 222,887 243,850 737,405 866,684 Realized profit sharing expense 211,984 65,746 10,837 17,445 96,279 290,252 190,307 Total Segment Expenses $419,016 $258,533 $217,997 $240,332 $340,129 $1,027,657 $1,056,991 ($ in thousands) 4Q'19 1Q'20 2Q'20 3Q'20 4Q'20 FY'19 FY'20 Other income, net $479 $133 $81 $126 $482 $7,688 $822 Non-Controlling Interest (1,021 ) (794 ) (687 ) (824 ) (626 ) (3,151 ) (2,931 ) Other Income (Loss), net of Non-Controlling Interest (542 ) (661 ) (606 ) (698 ) (144 ) 4,537 (2,109 ) Net interest loss and other (18,527 ) (36,292 ) (28,207 ) (33,122 ) (33,524 ) (61,957 ) (131,145 ) Total Segment Other Loss ($19,069) ($36,953) ($28,813) ($33,820) ($33,668) ($57,420) ($133,254) The following table sets forth Apollo’s total segment expenses for the combined segments The following table sets forth Apollo’s total segment revenues for the combined segments The following table sets forth Apollo’s total segment other income for the combined segments 1 Represents certain performance fees related to business development companies, Redding Ridge Holdings, and MidCap.
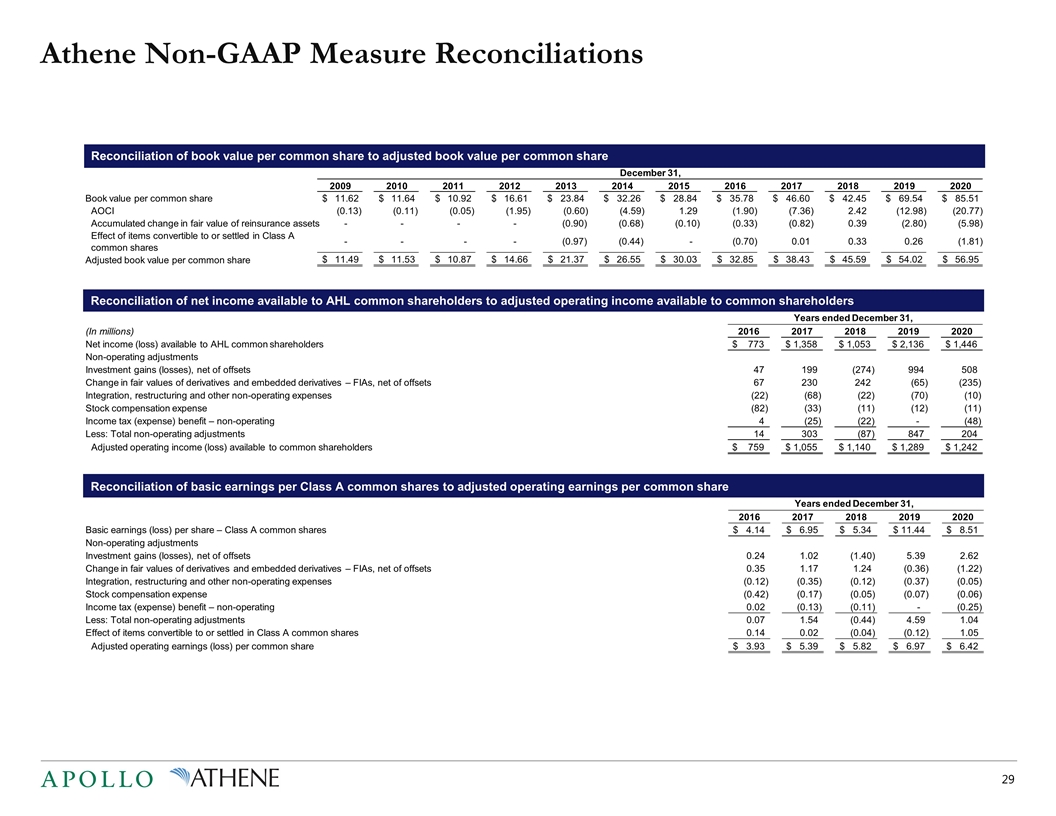
Athene Non-GAAP Measure Reconciliations Reconciliation of book value per common share to adjusted book value per common share Reconciliation of basic earnings per Class A common shares to adjusted operating earnings per common share 2009 2010 2011 2012 2013 2014 2015 2016 2017 2018 2019 2020 Book value per common share 11.62 $ 11.64 $ 10.92 $ 16.61 $ $ 23.84 $ 32.26 $ 28.84 $ 35.78 $ 46.60 $ 42.45 $ 69.54 $ 85.51 AOCI (0.13) (0.11) (0.05) (1.95) (0.60) (4.59) 1.29 (1.90) (7.36) 2.42 (12.98) (20.77) Accumulated change in fair value of reinsurance assets - - - - (0.90) (0.68) (0.10) (0.33) (0.82) 0.39 (2.80) (5.98) Effect of items convertible to or settled in Class A common shares - - - - (0.97) (0.44) - (0.70) 0.01 0.33 0.26 (1.81) Adjusted book value per common share 11.49 $ 11.53 $ 10.87 $ 14.66 $ 21.37 $ 26.55 $ 30.03 $ 32.85 $ 38.43 $ 45.59 $ 54.02 $ 56.95 $ December 31, Reconciliation of net income available to AHL common shareholders to adjusted operating income available to common shareholders (In millions) 2016 2017 2018 2019 2020 Net income (loss) available to AHL common shareholders $ 773 $ 1,358 $ 1,053 $ 2,136 $ 1,446 Non-operating adjustments Investment gains (losses), net of offsets 47 199 (274) 994 508 Change in fair values of derivatives and embedded derivatives – FIAs, net of offsets 67 230 242 (65) (235) Integration, restructuring and other non-operating expenses (22) (68) (22) (70) (10) Stock compensation expense (82) (33) (11) (12) (11) Income tax (expense) benefit – non-operating 4 (25) (22) - (48) Less: Total non-operating adjustments 14 303 (87) 847 204 Adjusted operating income (loss) available to common shareholders $ 759 $ 1,055 $ 1,140 $ 1,289 $ 1,242 Years ended December 31, 2016 2017 2018 2019 2020 Basic earnings (loss) per share – Class A common shares $ 4.14 $ 6.95 $ 5.34 $ 11.44 $ 8.51 Non-operating adjustments Investment gains (losses), net of offsets 0.24 1.02 (1.40) 5.39 2.62 Change in fair values of derivatives and embedded derivatives – FIAs, net of offsets 0.35 1.17 1.24 (0.36) (1.22) Integration, restructuring and other non-operating expenses (0.12) (0.35) (0.12) (0.37) (0.05) Stock compensation expense (0.42) (0.17) (0.05) (0.07) (0.06) Income tax (expense) benefit – non-operating 0.02 (0.13) (0.11) - (0.25) Less: Total non-operating adjustments 0.07 1.54 (0.44) 4.59 1.04 Effect of items convertible to or settled in Class A common shares 0.14 0.02 (0.04) (0.12) 1.05 Adjusted operating earnings (loss) per common share $ 3.93 $ 5.39 $ 5.82 $ 6.97 $ 6.42 Years ended December 31,
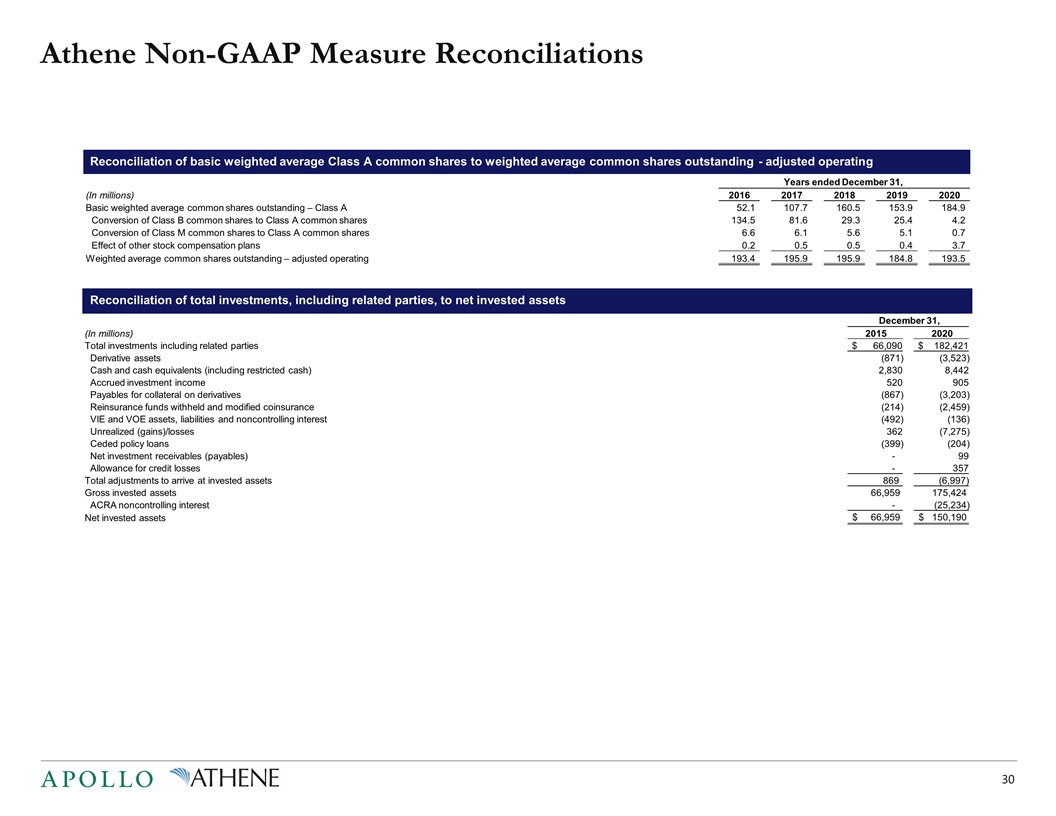
Athene Non-GAAP Measure Reconciliations Reconciliation of basic weighted average Class A common shares to weighted average common shares outstanding - adjusted operatin g (In millions) 2016 2017 2018 2019 2020 Basic weighted average common shares outstanding – Class A 52.1 107.7 160.5 153.9 184.9 Conversion of Class B common shares to Class A common shares 134.5 81.6 29.3 25.4 4.2 Conversion of Class M common shares to Class A common shares 6.6 6.1 5.6 5.1 0.7 Effect of other stock compensation plans 0.2 0.5 0.5 0.4 3.7 Weighted average common shares outstanding – adjusted operating 193.4 195.9 195.9 184.8 193.5 Years ended December 31, (In millions) 2015 2020 Total investments including related parties $ 66,090 $ 182,421 Derivative assets (871) (3,523) Cash and cash equivalents (including restricted cash) 2,830 8,442 Accrued investment income 520 905 Payables for collateral on derivatives (867) (3,203) Reinsurance funds withheld and modified coinsurance (214) (2,459) VIE and VOE assets, liabilities and noncontrolling interest (492) (136) Unrealized (gains)/losses 362 (7,275) Ceded policy loans (399) (204) Net investment receivables (payables) - 99 Allowance for credit losses - 357 Total adjustments to arrive at invested assets 869 (6,997) Gross invested assets 66,959 175,424 ACRA noncontrolling interest - (25,234) Net invested assets 66,959 $ 150,190 $ December 31, Reconciliation of total investments, including related parties, to net invested assets
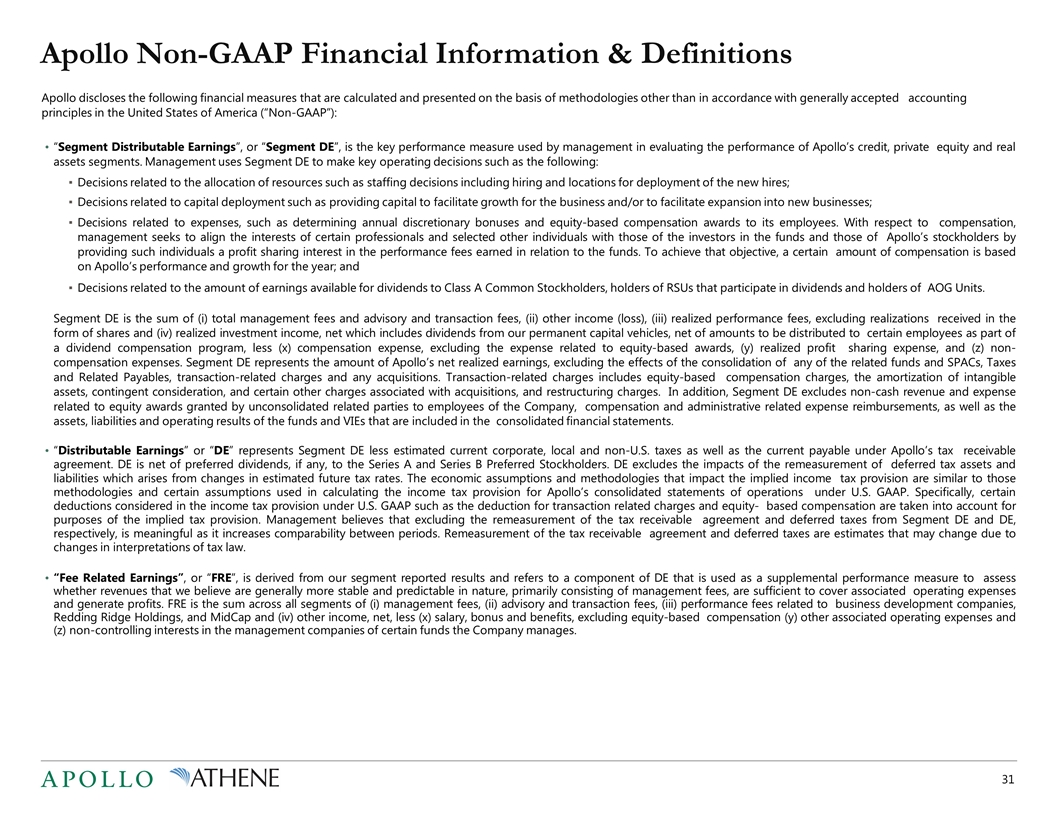
Apollo Non-GAAP Financial Information & Definitions Apollo discloses the following financial measures that are calculated and presented on the basis of methodologies other than in accordance with generally accepted accounting principles in the United States of America (“Non-GAAP”): “Segment Distributable Earnings”, or “Segment DE”, is the key performance measure used by management in evaluating the performance of Apollo’s credit, private equity and real assets segments. Management uses Segment DE to make key operating decisions such as the following: Decisions related to the allocation of resources such as staffing decisions including hiring and locations for deployment of the new hires; Decisions related to capital deployment such as providing capital to facilitate growth for the business and/or to facilitate expansion into new businesses; Decisions related to expenses, such as determining annual discretionary bonuses and equity-based compensation awards to its employees. With respect to compensation, management seeks to align the interests of certain professionals and selected other individuals with those of the investors in the funds and those of Apollo’s stockholders by providing such individuals a profit sharing interest in the performance fees earned in relation to the funds. To achieve that objective, a certain amount of compensation is based on Apollo’s performance and growth for the year; and Decisions related to the amount of earnings available for dividends to Class A Common Stockholders, holders of RSUs that participate in dividends and holders of AOG Units. Segment DE is the sum of (i) total management fees and advisory and transaction fees, (ii) other income (loss), (iii) realized performance fees, excluding realizations received in the form of shares and (iv) realized investment income, net which includes dividends from our permanent capital vehicles, net of amounts to be distributed to certain employees as part of a dividend compensation program, less (x) compensation expense, excluding the expense related to equity-based awards, (y) realized profit sharing expense, and (z) non-compensation expenses. Segment DE represents the amount of Apollo’s net realized earnings, excluding the effects of the consolidation of any of the related funds and SPACs, Taxes and Related Payables, transaction-related charges and any acquisitions. Transaction-related charges includes equity-based compensation charges, the amortization of intangible assets, contingent consideration, and certain other charges associated with acquisitions, and restructuring charges. In addition, Segment DE excludes non-cash revenue and expense related to equity awards granted by unconsolidated related parties to employees of the Company, compensation and administrative related expense reimbursements, as well as the assets, liabilities and operating results of the funds and VIEs that are included in the consolidated financial statements. “Distributable Earnings” or “DE” represents Segment DE less estimated current corporate, local and non-U.S. taxes as well as the current payable under Apollo’s tax receivable agreement. DE is net of preferred dividends, if any, to the Series A and Series B Preferred Stockholders. DE excludes the impacts of the remeasurement of deferred tax assets and liabilities which arises from changes in estimated future tax rates. The economic assumptions and methodologies that impact the implied income tax provision are similar to those methodologies and certain assumptions used in calculating the income tax provision for Apollo’s consolidated statements of operations under U.S. GAAP. Specifically, certain deductions considered in the income tax provision under U.S. GAAP such as the deduction for transaction related charges and equity- based compensation are taken into account for purposes of the implied tax provision. Management believes that excluding the remeasurement of the tax receivable agreement and deferred taxes from Segment DE and DE, respectively, is meaningful as it increases comparability between periods. Remeasurement of the tax receivable agreement and deferred taxes are estimates that may change due to changes in interpretations of tax law. “Fee Related Earnings”, or “FRE”, is derived from our segment reported results and refers to a component of DE that is used as a supplemental performance measure to assess whether revenues that we believe are generally more stable and predictable in nature, primarily consisting of management fees, are sufficient to cover associated operating expenses and generate profits. FRE is the sum across all segments of (i) management fees, (ii) advisory and transaction fees, (iii) performance fees related to business development companies, Redding Ridge Holdings, and MidCap and (iv) other income, net, less (x) salary, bonus and benefits, excluding equity-based compensation (y) other associated operating expenses and (z) non-controlling interests in the management companies of certain funds the Company manages.
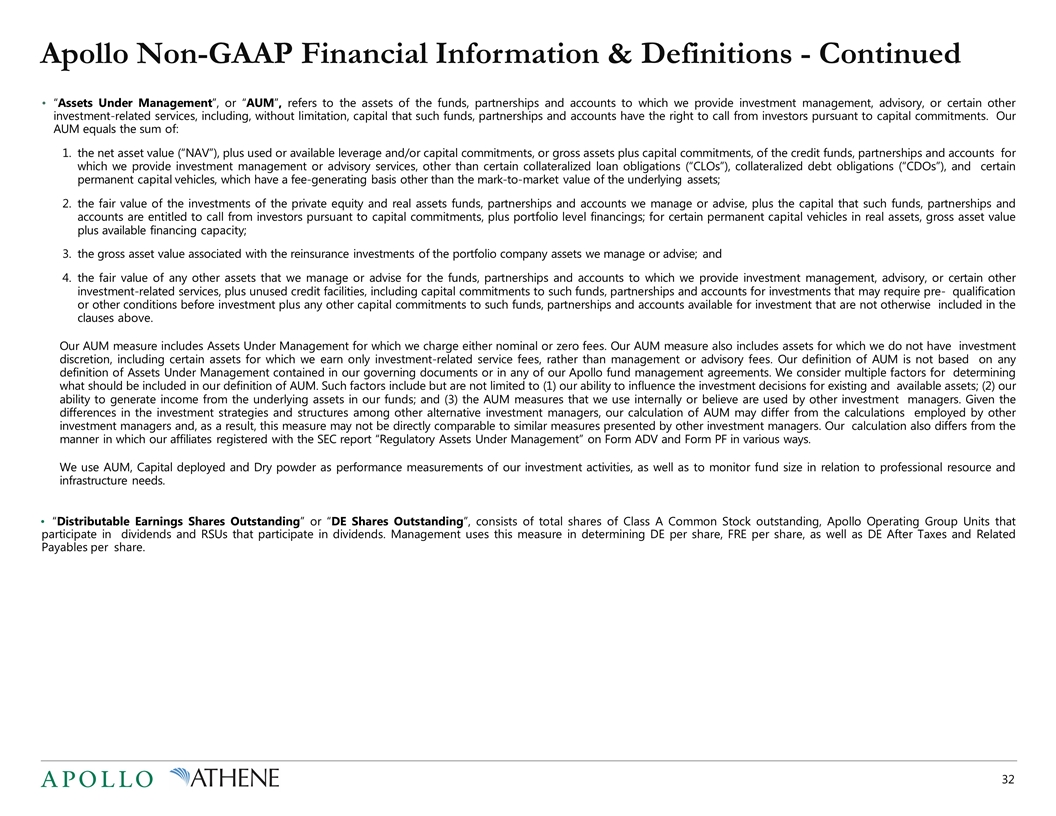
Apollo Non-GAAP Financial Information & Definitions - Continued “Assets Under Management”, or “AUM”, refers to the assets of the funds, partnerships and accounts to which we provide investment management, advisory, or certain other investment-related services, including, without limitation, capital that such funds, partnerships and accounts have the right to call from investors pursuant to capital commitments. Our AUM equals the sum of: the net asset value (“NAV”), plus used or available leverage and/or capital commitments, or gross assets plus capital commitments, of the credit funds, partnerships and accounts for which we provide investment management or advisory services, other than certain collateralized loan obligations (“CLOs”), collateralized debt obligations (“CDOs”), and certain permanent capital vehicles, which have a fee-generating basis other than the mark-to-market value of the underlying assets; the fair value of the investments of the private equity and real assets funds, partnerships and accounts we manage or advise, plus the capital that such funds, partnerships and accounts are entitled to call from investors pursuant to capital commitments, plus portfolio level financings; for certain permanent capital vehicles in real assets, gross asset value plus available financing capacity; the gross asset value associated with the reinsurance investments of the portfolio company assets we manage or advise; and the fair value of any other assets that we manage or advise for the funds, partnerships and accounts to which we provide investment management, advisory, or certain other investment-related services, plus unused credit facilities, including capital commitments to such funds, partnerships and accounts for investments that may require pre- qualification or other conditions before investment plus any other capital commitments to such funds, partnerships and accounts available for investment that are not otherwise included in the clauses above. Our AUM measure includes Assets Under Management for which we charge either nominal or zero fees. Our AUM measure also includes assets for which we do not have investment discretion, including certain assets for which we earn only investment-related service fees, rather than management or advisory fees. Our definition of AUM is not based on any definition of Assets Under Management contained in our governing documents or in any of our Apollo fund management agreements. We consider multiple factors for determining what should be included in our definition of AUM. Such factors include but are not limited to (1) our ability to influence the investment decisions for existing and available assets; (2) our ability to generate income from the underlying assets in our funds; and (3) the AUM measures that we use internally or believe are used by other investment managers. Given the differences in the investment strategies and structures among other alternative investment managers, our calculation of AUM may differ from the calculations employed by other investment managers and, as a result, this measure may not be directly comparable to similar measures presented by other investment managers. Our calculation also differs from the manner in which our affiliates registered with the SEC report “Regulatory Assets Under Management” on Form ADV and Form PF in various ways. We use AUM, Capital deployed and Dry powder as performance measurements of our investment activities, as well as to monitor fund size in relation to professional resource and infrastructure needs. “Distributable Earnings Shares Outstanding” or “DE Shares Outstanding”, consists of total shares of Class A Common Stock outstanding, Apollo Operating Group Units that participate in dividends and RSUs that participate in dividends. Management uses this measure in determining DE per share, FRE per share, as well as DE After Taxes and Related Payables per share.
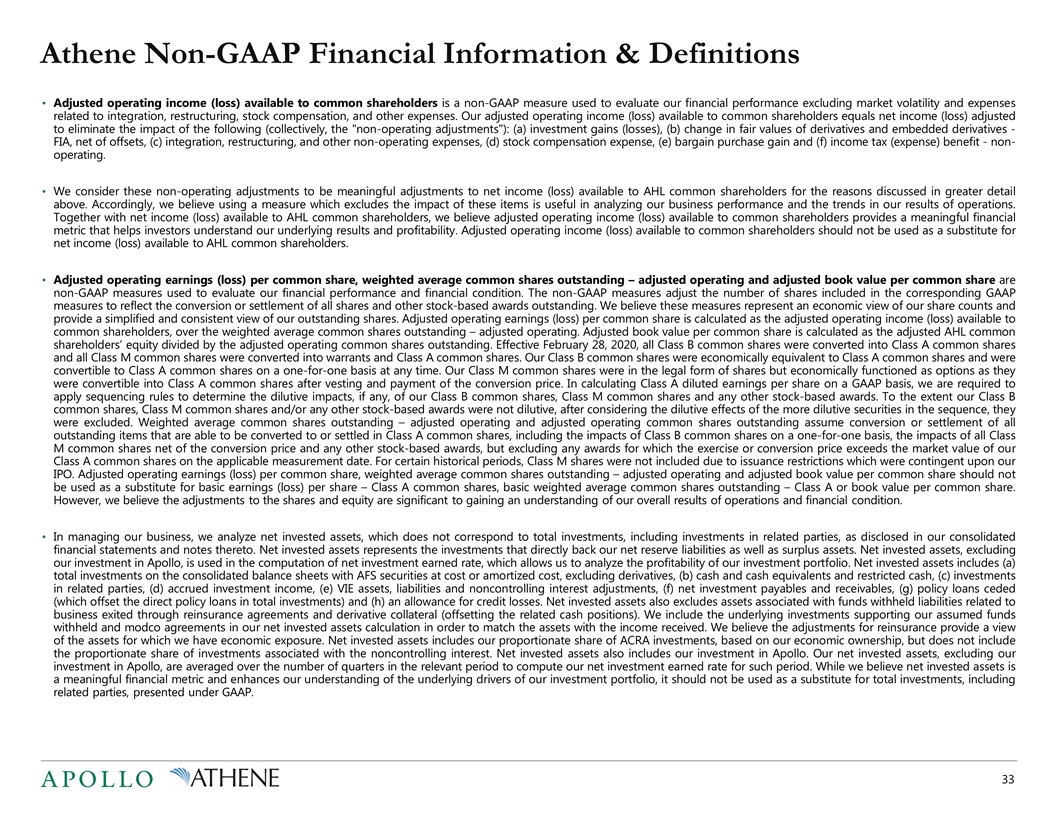
Athene Non-GAAP Financial Information & Definitions Adjusted operating income (loss) available to common shareholders is a non-GAAP measure used to evaluate our financial performance excluding market volatility and expenses related to integration, restructuring, stock compensation, and other expenses. Our adjusted operating income (loss) available to common shareholders equals net income (loss) adjusted to eliminate the impact of the following (collectively, the "non-operating adjustments"): (a) investment gains (losses), (b) change in fair values of derivatives and embedded derivatives - FIA, net of offsets, (c) integration, restructuring, and other non-operating expenses, (d) stock compensation expense, (e) bargain purchase gain and (f) income tax (expense) benefit - non-operating. We consider these non-operating adjustments to be meaningful adjustments to net income (loss) available to AHL common shareholders for the reasons discussed in greater detail above. Accordingly, we believe using a measure which excludes the impact of these items is useful in analyzing our business performance and the trends in our results of operations. Together with net income (loss) available to AHL common shareholders, we believe adjusted operating income (loss) available to common shareholders provides a meaningful financial metric that helps investors understand our underlying results and profitability. Adjusted operating income (loss) available to common shareholders should not be used as a substitute for net income (loss) available to AHL common shareholders. Adjusted operating earnings (loss) per common share, weighted average common shares outstanding – adjusted operating and adjusted book value per common share are non-GAAP measures used to evaluate our financial performance and financial condition. The non-GAAP measures adjust the number of shares included in the corresponding GAAP measures to reflect the conversion or settlement of all shares and other stock-based awards outstanding. We believe these measures represent an economic view of our share counts and provide a simplified and consistent view of our outstanding shares. Adjusted operating earnings (loss) per common share is calculated as the adjusted operating income (loss) available to common shareholders, over the weighted average common shares outstanding – adjusted operating. Adjusted book value per common share is calculated as the adjusted AHL common shareholders’ equity divided by the adjusted operating common shares outstanding. Effective February 28, 2020, all Class B common shares were converted into Class A common shares and all Class M common shares were converted into warrants and Class A common shares. Our Class B common shares were economically equivalent to Class A common shares and were convertible to Class A common shares on a one-for-one basis at any time. Our Class M common shares were in the legal form of shares but economically functioned as options as they were convertible into Class A common shares after vesting and payment of the conversion price. In calculating Class A diluted earnings per share on a GAAP basis, we are required to apply sequencing rules to determine the dilutive impacts, if any, of our Class B common shares, Class M common shares and any other stock-based awards. To the extent our Class B common shares, Class M common shares and/or any other stock-based awards were not dilutive, after considering the dilutive effects of the more dilutive securities in the sequence, they were excluded. Weighted average common shares outstanding – adjusted operating and adjusted operating common shares outstanding assume conversion or settlement of all outstanding items that are able to be converted to or settled in Class A common shares, including the impacts of Class B common shares on a one-for-one basis, the impacts of all Class M common shares net of the conversion price and any other stock-based awards, but excluding any awards for which the exercise or conversion price exceeds the market value of our Class A common shares on the applicable measurement date. For certain historical periods, Class M shares were not included due to issuance restrictions which were contingent upon our IPO. Adjusted operating earnings (loss) per common share, weighted average common shares outstanding – adjusted operating and adjusted book value per common share should not be used as a substitute for basic earnings (loss) per share – Class A common shares, basic weighted average common shares outstanding – Class A or book value per common share. However, we believe the adjustments to the shares and equity are significant to gaining an understanding of our overall results of operations and financial condition. In managing our business, we analyze net invested assets, which does not correspond to total investments, including investments in related parties, as disclosed in our consolidated financial statements and notes thereto. Net invested assets represents the investments that directly back our net reserve liabilities as well as surplus assets. Net invested assets, excluding our investment in Apollo, is used in the computation of net investment earned rate, which allows us to analyze the profitability of our investment portfolio. Net invested assets includes (a) total investments on the consolidated balance sheets with AFS securities at cost or amortized cost, excluding derivatives, (b) cash and cash equivalents and restricted cash, (c) investments in related parties, (d) accrued investment income, (e) VIE assets, liabilities and noncontrolling interest adjustments, (f) net investment payables and receivables, (g) policy loans ceded (which offset the direct policy loans in total investments) and (h) an allowance for credit losses. Net invested assets also excludes assets associated with funds withheld liabilities related to business exited through reinsurance agreements and derivative collateral (offsetting the related cash positions). We include the underlying investments supporting our assumed funds withheld and modco agreements in our net invested assets calculation in order to match the assets with the income received. We believe the adjustments for reinsurance provide a view of the assets for which we have economic exposure. Net invested assets includes our proportionate share of ACRA investments, based on our economic ownership, but does not include the proportionate share of investments associated with the noncontrolling interest. Net invested assets also includes our investment in Apollo. Our net invested assets, excluding our investment in Apollo, are averaged over the number of quarters in the relevant period to compute our net investment earned rate for such period. While we believe net invested assets is a meaningful financial metric and enhances our understanding of the underlying drivers of our investment portfolio, it should not be used as a substitute for total investments, including related parties, presented under GAAP.
Disclaimers About Apollo Apollo is a leading global investment manager with assets under management of approximately $455 billion as of December 31, 2020 in credit, private equity, and real assets funds. For more information about Apollo, please visit www.Apollo.com. About Athene Athene, through its subsidiaries, is a leading retirement services company with total assets of $202.8 billion as of December 31, 2020 and operations in the United States, Bermuda, and Canada. Athene specializes in helping its customers achieve financial security and is a solutions provider to institutions. Founded in 2009, Athene is Driven to Do More for our policyholders, business partners, shareholders, and the communities in which we work and live. For more information, please visit www.athene.com. Additional Information Regarding the Transaction and Where to Find It This presentation is being made in respect of the proposed transaction involving Apollo; Athene and a holding company (“HoldCo”). The proposed transaction will be submitted to the stockholders of Apollo and the shareholders of Athene for their respective consideration. In connection therewith, the parties intend to file relevant materials with the Securities and Exchange Commission (the “SEC”), including a definitive joint proxy statement / prospectus, which will be mailed to the stockholders of Apollo and the shareholders of Athene. However, such documents are not currently available. BEFORE MAKING ANY VOTING OR ANY INVESTMENT DECISION, AS APPLICABLE, INVESTORS AND SECURITY HOLDERS OF APOLLO AND ATHENE ARE URGED TO READ THE DEFINITIVE JOINT PROXY STATEMENT / PROSPECTUS REGARDING THE PROPOSED TRANSACTION AND ANY OTHER RELEVANT DOCUMENTS FILED OR TO BE FILED WITH THE SEC CAREFULLY AND IN THEIR ENTIRETY WHEN THEY BECOME AVAILABLE BECAUSE THEY WILL CONTAIN IMPORTANT INFORMATION ABOUT THE PROPOSED TRANSACTION. Investors and security holders may obtain free copies of the definitive joint proxy statement, any amendments or supplements thereto and other documents containing important information about Apollo and Athene, once such documents are filed with the SEC, through the website maintained by the SEC at www.sec.gov. Copies of the documents filed with the SEC by Apollo will be available free of charge under the “Stockholders” section of Apollo’s website located at http://www.apollo.com or by contacting Apollo’s Investor Relations Department at (212) 822-0528 or APOInvestorRelations@apollo.com. Copies of the documents filed with the SEC by Athene will be available free of charge under the “Investors” section of Athene’s website located at http://www.athene.com or by contacting Athene’s Investor Relations Department at (441) 279-8531 or ir@athene.com. Participants in the Solicitation Apollo, Athene, HoldCo and their respective directors, executive officers, members of management and employees may, under the rules of the SEC, be deemed to be participants in the solicitation of proxies in connection with the proposed transaction. Information about the directors and executive officers of Apollo and HoldCo is set forth in Apollo’s proxy statement for its 2020 annual meeting of stockholders, which was filed with the SEC on August 20, 2020, its annual report on Form 10-K for the fiscal year ended December 31, 2020, which was filed with the SEC on February 19, 2021, and in subsequent documents filed with the SEC, each of which can be obtained free of charge from the sources indicated above. Information about the directors and executive officers of Athene is set forth in Athene’s proxy statement for its 2020 annual meeting of shareholders, which was filed with the SEC on April 21, 2020, its annual report on Form 10-K for the fiscal year ended December 31, 2020, which was filed with the SEC on February 19, 2021, and in subsequent documents filed with the SEC, each of which can be obtained free of charge from the sources indicated above. Other information regarding the participants in the proxy solicitations of the stockholders of Apollo and the shareholders of Athene, and a description of their direct and indirect interests, by security holdings or otherwise, will be contained in the preliminary and definitive joint proxy statement / prospectus and other relevant materials to be filed with the SEC when they become available.
Disclaimers No Offer or Solicitation This presentation is for informational purposes only and not intended to and does not constitute an offer to subscribe for, buy or sell, the solicitation of an offer to subscribe for, buy or sell or an invitation to subscribe for, buy or sell any securities or the solicitation of any vote or approval in any jurisdiction pursuant to or in connection with the proposed transaction or otherwise, nor shall there be any sale, issuance or transfer of securities in any jurisdiction in contravention of applicable law. Disclaimers Related to Apollo Apollo Safe Harbor for Forward Looking Statements. This presentation contains forward-looking statements that are within the meaning of Section 27A of the Securities Act of 1933, as amended, and Section 21E of the Securities Exchange Act of 1934, as amended. These statements include, but are not limited to, discussions related to Apollo’s expectations regarding the performance of its business, its liquidity and capital resources and the other non-historical statements in the discussion and analysis. These forward-looking statements are based on management’s beliefs, as well as assumptions made by, and information currently available to, management. When used in this presentation, the words “believe,” “anticipate,” “estimate,” “expect,” “intend” and similar expressions are intended to identify forward-looking statements. Although management believes that the expectations reflected in these forward-looking statements are reasonable, it can give no assurance that these expectations will prove to have been correct. It is possible that actual results will differ, possibly materially, from the anticipated results indicated in these statements. These statements are subject to certain risks, uncertainties and assumptions, including risks relating to Apollo’s dependence on certain key personnel, Apollo’s ability to raise new private equity, credit or real assets funds, the impact of COVID-19, the impact of energy market dislocation, market conditions, generally, Apollo’s ability to manage its growth, fund performance, changes in Apollo’s regulatory environment and tax status, the variability of Apollo’s revenues, net income and cash flow, Apollo’s use of leverage to finance its businesses and investments by Apollo funds, litigation risks and potential governance changes and related transactions which are subject to regulatory, corporate and shareholder approvals, among others. Due to the COVID-19 pandemic, there has been uncertainty and disruption in the global economy and financial markets. While Apollo is unable to accurately predict the full impact that COVID-19 will have on Apollo’s results from operations, financial condition, liquidity and cash flows due to numerous uncertainties, including the duration and severity of the pandemic and containment measures, Apollo’s compliance with these measures has impacted Apollo’s day-to-day operations and could disrupt Apollo’s business and operations, as well as that of the Apollo funds and their portfolio companies, for an indefinite period of time. Apollo believes these factors include but are not limited to those described under the section entitled “Risk Factors” in Apollo’s annual report on Form 10-K filed with the SEC on February 19, 2021, as such factors may be updated from time to time in Apollo’s periodic filings with the SEC, which are accessible on the SEC’s website at www.sec.gov. These factors should not be construed as exhaustive and should be read in conjunction with the other cautionary statements that are included in this presentation and in other filings. The proposed transaction is subject to risks, uncertainties and assumptions, which include, but are not limited to: (i) that Apollo may be unable to complete the proposed transaction because, among other reasons, conditions to the closing of the proposed transaction may not be satisfied or waived, including that a governmental entity may prohibit, delay or refuse to grant or place material restrictions on its approval for the consummation of the proposed transaction; (ii) uncertainty as to the timing of completion of the proposed transaction; (iii) the inability to complete the proposed transaction due to the failure to obtain Apollo stockholder approval and Athene shareholder approval for the proposed transaction; (iv) the occurrence of any event, change or other circumstances that could give rise to the termination of the merger agreement; (v) risks related to disruption of management’s attention from Apollo’s ongoing business operations due to the proposed transaction; (vi) the effect of the announcement of the proposed transaction on Apollo’s relationships with its clients, operating results and business generally; (vii) the outcome of any legal proceedings to the extent initiated against Apollo or others following the announcement of the proposed transaction, as well as Apollo’s management’s response to any of the aforementioned factors; and (viii) industry conditions. Apollo undertakes no obligation to publicly update or review any forward-looking statements, whether as a result of new information, future developments or otherwise, except as required by applicable law. This presentation does not constitute an offer of any Apollo fund. Non-GAAP Financial Measures. This presentation contains information regarding Apollo and Athene’s financial results that is calculated and presented on the basis of methodologies other than in accordance with accounting principles generally accepted in the United States (“non-GAAP financial measures”). The non-GAAP measures presented herein include Distributable Earnings, or “DE”, Fee Related Earnings, or “FRE”, among others. These non-GAAP financial measures should be considered in addition to and not as a substitute for, or superior to, financial measures presented in accordance with GAAP. Refer to the definitions of the non-GAAP financial measures presented herein and to the Reconciliation of GAAP to non-GAAP Financial Measures slides. Performance Information. Information contained herein includes information respecting prior performance of Apollo and Athene. Past performance is not indicative nor a guarantee of future results. Actual outcomes may differ materially from historic, pro forma or projected results indicated herein.
Disclaimers Ratings Information. Apollo, its affiliates, and third parties that provide information to Apollo, such as rating agencies, do not guarantee the accuracy, completeness, timeliness or availability of any information, including ratings, and are not responsible for any errors or omissions (negligent or otherwise), regardless of the cause, or the results obtained from the use of such content. Apollo, its affiliates and third party content providers give no express or implied warranties, including, but not limited to, any warranties of merchantability or fitness fora particular purpose or use, and they expressly disclaim any responsibility or liability for direct, indirect, incidental, exemplary, compensatory, punitive, special or consequential damages, costs expenses, legal fees or losses (including lost income or profits and opportunity costs) in connection with the use of the information herein. Credit ratings are statements of opinions and not statements of facts or recommendations to purchase, hold or sell securities. They do not address the suitability of securities for investment purposes and should not be relied on as investment advice. Not an offer. This presentation is for informational purposes only and does not constitute an offer to sell, or the solicitation of any offer to buy, any securities product or service of Apollo or of any Apollo fund, whether an existing or contemplated fund, for which an offer can be made only by such fund’s Confidential Private Placement Memorandum and in compliance with applicable law. General. This presentation is not complete and the information contained herein may change at any time without notice. Except as required by applicable law, Apollo does not have any responsibility to update this presentation to account for such changes. Apollo makes no representation or warranty, express or implied, with respect to the accuracy, reasonableness or completeness of any of the information contained herein, including, but not limited to, information obtained from third parties. The information contained herein is not intended to provide and should not be relied upon for, accounting, legal or tax advice or investment recommendations. Athene Safe Harbor for Forward-Looking Statements This presentation contains, and certain oral statements made by Athene’s representatives from time to time may contain, forward-looking statements within the meaning of the Private Securities Litigation Reform Act of 1995, Section 27A of the Securities Act of 1933, as amended, and Section 21E of the Securities Exchange Act of 1934, as amended. Such statements are subject to risks and uncertainties that could cause actual results, events and developments to differ materially from those set forth in, or implied by, such statements. These statements are based on the beliefs and assumptions of Athene’s management and the management of Athene’s subsidiaries. Generally, forward-looking statements include actions, events, results, strategies and expectations and are often identifiable by use of the words “believes,” “expects,” “intends,” “anticipates,” “plans,” “seeks,” “estimates,” “projects,” “may,” “will,” “could,” “might,” or “continues” or similar expressions. Forward looking statements within this presentation include, but are not limited to, statements regarding: the consummation of the proposed merger and the benefits to be derived therefrom; the future financial performance and growth prospects of the combined entity; the market environment in which the combined entity will operate; future capital allocation decisions, including the payment of dividends; the structure and operation of the company post-merger; and the tax treatment of the proposed transaction. Factors that could cause actual results, events and developments to differ include, without limitation: Athene’s failure to obtain approval of the proposed transaction by its shareholders or regulators; Athene’s failure to recognize the benefits expected to be derived from the proposed transaction; unanticipated difficulties or expenditures relating to the proposed transaction; disruptions of Athene’s current plans, operations and relationships with customers, suppliers and other business partners caused by the announcement and pendency of the proposed transaction; legal proceedings, including those that may be instituted against Athene, Athene’s board of directors or special committee, Athene’s executive officers and others following announcement of the proposed transaction; the accuracy of Athene’s assumptions and estimates; Athene’s ability to maintain or improve financial strength ratings; Athene’s ability to manage its business in a highly regulated industry; regulatory changes or actions; the impact of Athene’s reinsurers failing to meet their assumed obligations; the impact of interest rate fluctuations; changes in the federal income tax laws and regulations; the accuracy of Athene’s interpretation of the Tax Cuts and Jobs Act, litigation (including class action litigation), enforcement investigations or regulatory scrutiny; the performance of third parties; the loss of key personnel; telecommunication, information technology and other operational systems failures; the continued availability of capital; new accounting rules or changes to existing accounting rules; general economic conditions; Athene’s ability to protect its intellectual property; the ability to maintain or obtain approval of the Delaware Department of Insurance, the Iowa Insurance Division and other regulatory authorities as required for Athene’s operations; and other factors discussed from time to time in Athene’s filings with the SEC, including its annual report on Form 10-K for the year ended December 31, 2020, which can be found at the SEC’s website www.sec.gov. All forward-looking statements described herein are qualified by these cautionary statements and there can be no assurance that the actual results, events or developments referenced herein will occur or be realized. Athene does not undertake any obligation to update or revise forward-looking statements to reflect changed assumptions, the occurrence of unanticipated events or changes to future operating results. The contents of any website referenced in this presentation are not incorporated by reference.