EX-99.1
Published on September 20, 2018

Athene Investor Day September 20, 2018 Exhibit 99.1
Disclaimer This presentation does not constitute an offer to sell, or the solicitation of an offer to buy, any security of Athene Holding Ltd. (“Athene”) or Athene Annuity and Life Company. Certain information contained herein and certain oral statements made in reference thereto may be “forward-looking” in nature. These statements include, but are not limited to, discussions related to the financial results to be derived from the reinsurance arrangement with Voya Financial, Inc.; the impact of tax reform on Athene's overall tax rate and on its business more broadly; the impact of a recession on Athene’s business, financial condition and capital; the performance of its business; its liquidity and capital resources; and the other non-historical statements. These forward-looking statements are based on managements beliefs, as well as assumptions made by, and information currently available to, management. When used in this presentation, the words “believe,” “anticipate,” “estimate,” “expect,” “intend” and similar expressions are intended to identify forward-looking statements. Although management believes that the expectations reflected in these forward-looking statements are reasonable, it can give no assurance that these expectations will prove to be correct. These statements are subject to certain risks, uncertainties and assumptions. Specifically, statements regarding the likely impact of a recession on Athene’s business are subject to the risk that the economic environment differs significantly from that assumed in Athene’s models and/or the risk that the assumptions and estimates inherent in Athene’s models are inaccurate. For a discussion of the risks and uncertainties related to Athene's other forward-looking statements, see its annual report on Form 10-K for the year ended December 31, 2017, its quarterly report on Form 10-Q for the quarterly period ended June 30, 2018 and its other SEC filings, which can be found at the SEC’s website www.sec.gov. Due to these various risks, uncertainties and assumptions, actual events or results or the actual performance of Athene may differ materially from that reflected or contemplated in such forward-looking statements. Athene undertakes no obligation to publicly update or review any forward-looking statements, whether as a result of new information, future developments or otherwise. Information contained herein may include information respecting prior performance of Athene. Information respecting prior performance, while a useful tool, is not necessarily indicative of actual results to be achieved in the future, which is dependent upon many factors, many of which are beyond Athene’s control. The information contained herein is not a guarantee of future performance by Athene, and actual outcomes and results may differ materially from any historic, pro forma or projected financial results indicated herein. Certain of the financial information contained herein is unaudited or based on the application of non-GAAP financial measures. These non-GAAP financial measures should be considered in addition to and not as a substitute for, or superior to, financial measures presented in accordance with GAAP. Furthermore, certain financial information is based on estimates of management. These estimates, which are based on the reasonable expectations of management, are subject to change and there can be no assurance that they will prove to be correct. The information contained herein does not purport to be all-inclusive or contain all information that an evaluator may require in order to properly evaluate the business, prospects or value of Athene. Athene does not have any obligation to update this presentation and the information may change at any time without notice. Certain of the information used in preparing this presentation was obtained from third parties or public sources. No representation or warranty, express or implied, is made or given by or on behalf of Athene or any other person as to the accuracy, completeness or fairness of such information, and no responsibility or liability is accepted for any such information. This document is not intended to be, nor should it be construed or used as, financial, legal, tax, insurance or investment advice. There can be no assurance that Athene will achieve its objectives. Past performance is not indicative of future success. All information is as of the dates indicated herein.

Welcome and Introduction Noah Gunn
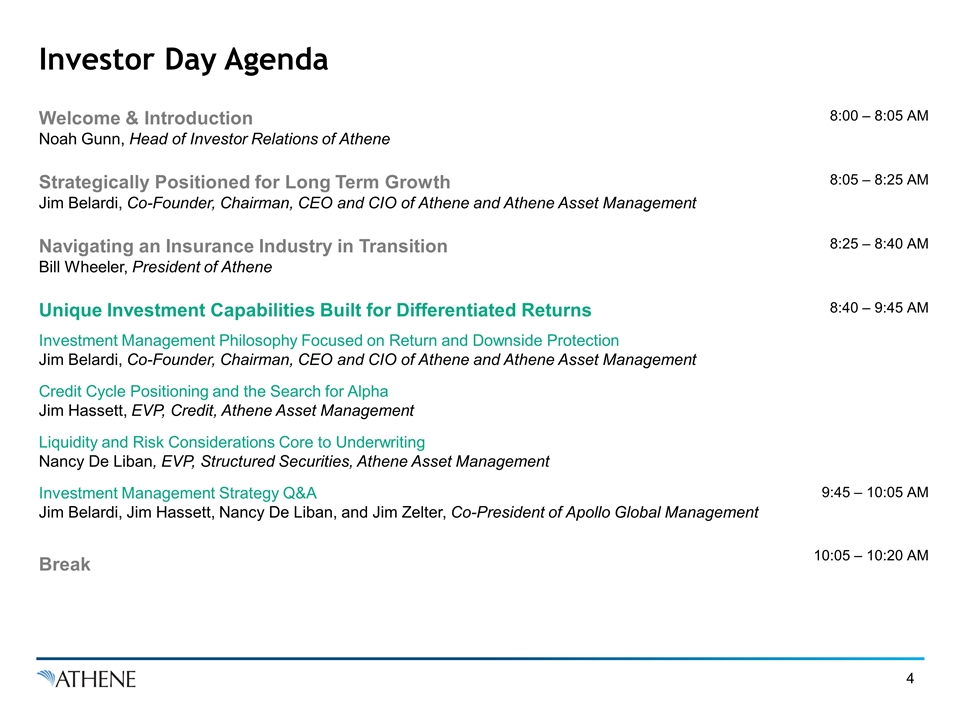
Investor Day Agenda Welcome & Introduction Noah Gunn, Head of Investor Relations of Athene 8:00 – 8:05 AM Strategically Positioned for Long Term Growth Jim Belardi, Co-Founder, Chairman, CEO and CIO of Athene and Athene Asset Management 8:05 – 8:25 AM Navigating an Insurance Industry in Transition Bill Wheeler, President of Athene 8:25 – 8:40 AM Unique Investment Capabilities Built for Differentiated Returns 8:40 – 9:45 AM Investment Management Philosophy Focused on Return and Downside Protection Jim Belardi, Co-Founder, Chairman, CEO and CIO of Athene and Athene Asset Management Credit Cycle Positioning and the Search for Alpha Jim Hassett, EVP, Credit, Athene Asset Management Liquidity and Risk Considerations Core to Underwriting Nancy De Liban, EVP, Structured Securities, Athene Asset Management Investment Management Strategy Q&A Jim Belardi, Jim Hassett, Nancy De Liban, and Jim Zelter, Co-President of Apollo Global Management 9:45 – 10:05 AM Break 10:05 – 10:20 AM
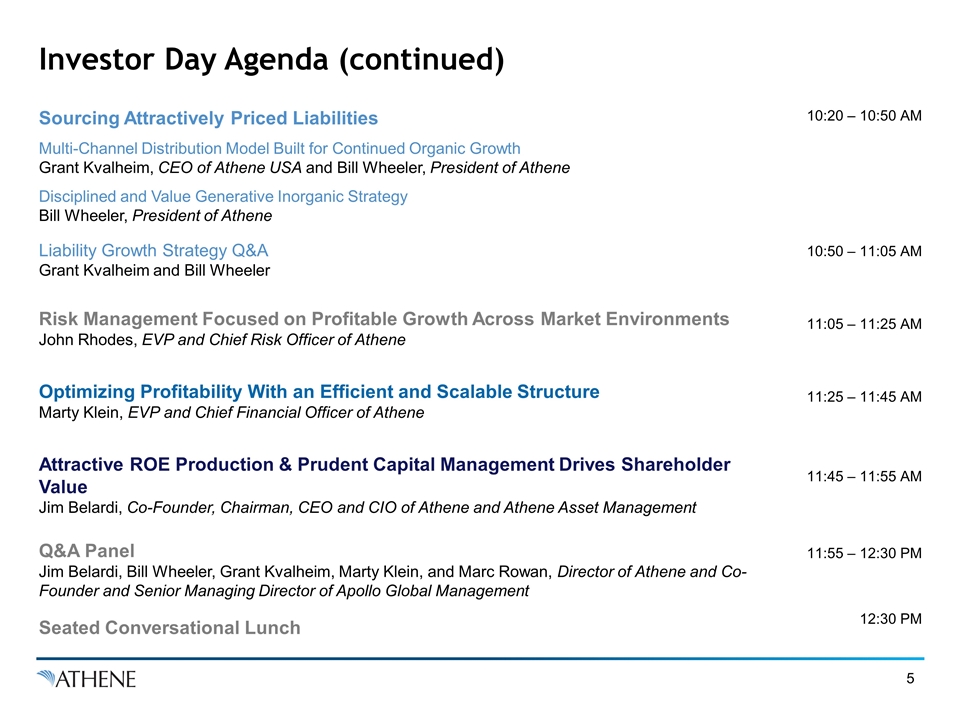
Investor Day Agenda (continued) Sourcing Attractively Priced Liabilities 10:20 – 10:50 AM Multi-Channel Distribution Model Built for Continued Organic Growth Grant Kvalheim, CEO of Athene USA and Bill Wheeler, President of Athene Disciplined and Value Generative Inorganic Strategy Bill Wheeler, President of Athene Liability Growth Strategy Q&A Grant Kvalheim and Bill Wheeler 10:50 – 11:05 AM Risk Management Focused on Profitable Growth Across Market Environments John Rhodes, EVP and Chief Risk Officer of Athene 11:05 – 11:25 AM Optimizing Profitability With an Efficient and Scalable Structure Marty Klein, EVP and Chief Financial Officer of Athene 11:25 – 11:45 AM Attractive ROE Production & Prudent Capital Management Drives Shareholder Value Jim Belardi, Co-Founder, Chairman, CEO and CIO of Athene and Athene Asset Management 11:45 – 11:55 AM Q&A Panel Jim Belardi, Bill Wheeler, Grant Kvalheim, Marty Klein, and Marc Rowan, Director of Athene and Co-Founder and Senior Managing Director of Apollo Global Management 11:55 – 12:30 PM Seated Conversational Lunch 12:30 PM

Strategically Positioned for Long-Term Growth Jim Belardi
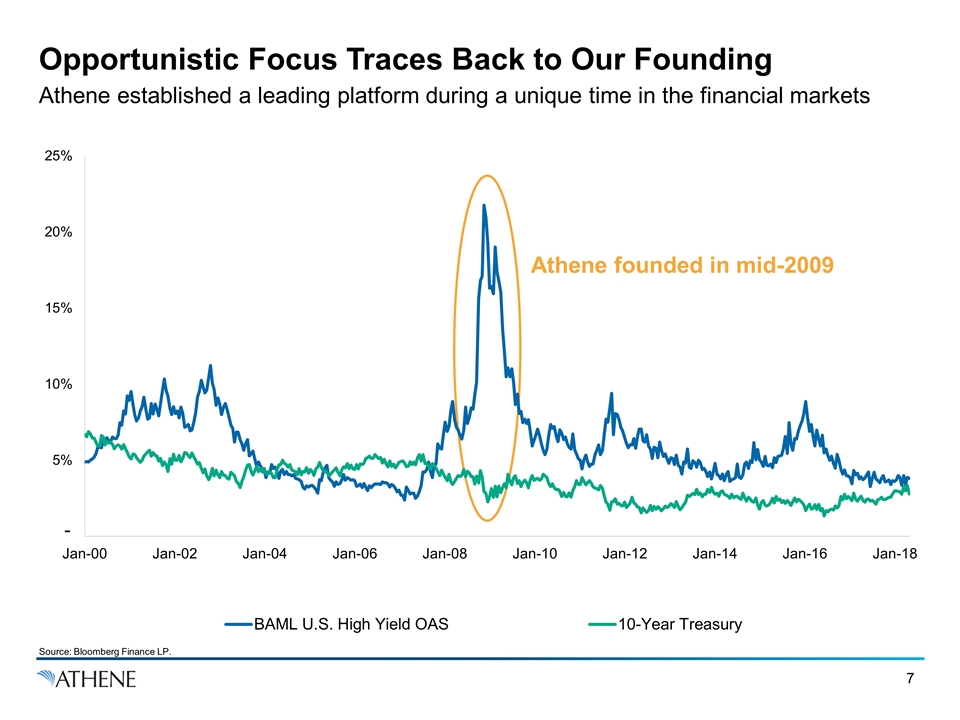
Opportunistic Focus Traces Back to Our Founding Athene established a leading platform during a unique time in the financial markets Athene founded in mid-2009 - Source: Bloomberg Finance LP.
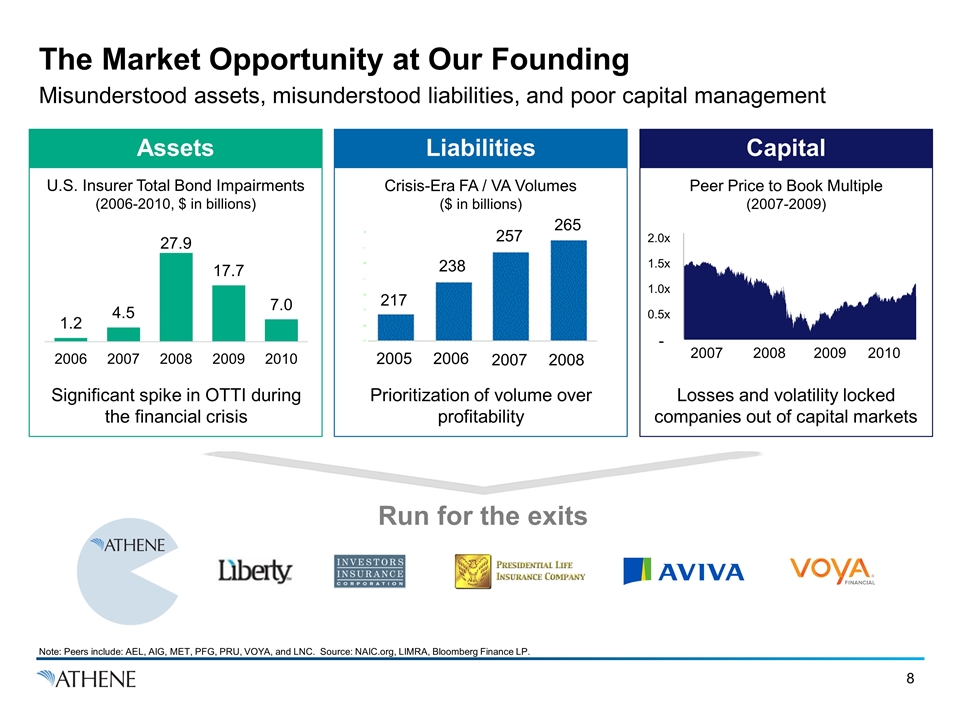
The Market Opportunity at Our Founding Misunderstood assets, misunderstood liabilities, and poor capital management Assets Capital Liabilities U.S. Insurer Total Bond Impairments (2006-2010, $ in billions) Crisis-Era FA / VA Volumes ($ in billions) Peer Price to Book Multiple (2007-2009) Run for the exits Losses and volatility locked companies out of capital markets Prioritization of volume over profitability Significant spike in OTTI during the financial crisis 2007 2008 2009 2010 - Note: Peers include: AEL, AIG, MET, PFG, PRU, VOYA, and LNC. Source: NAIC.org, LIMRA, Bloomberg Finance LP. 217 238 257 265 2005 2006 2007 2008
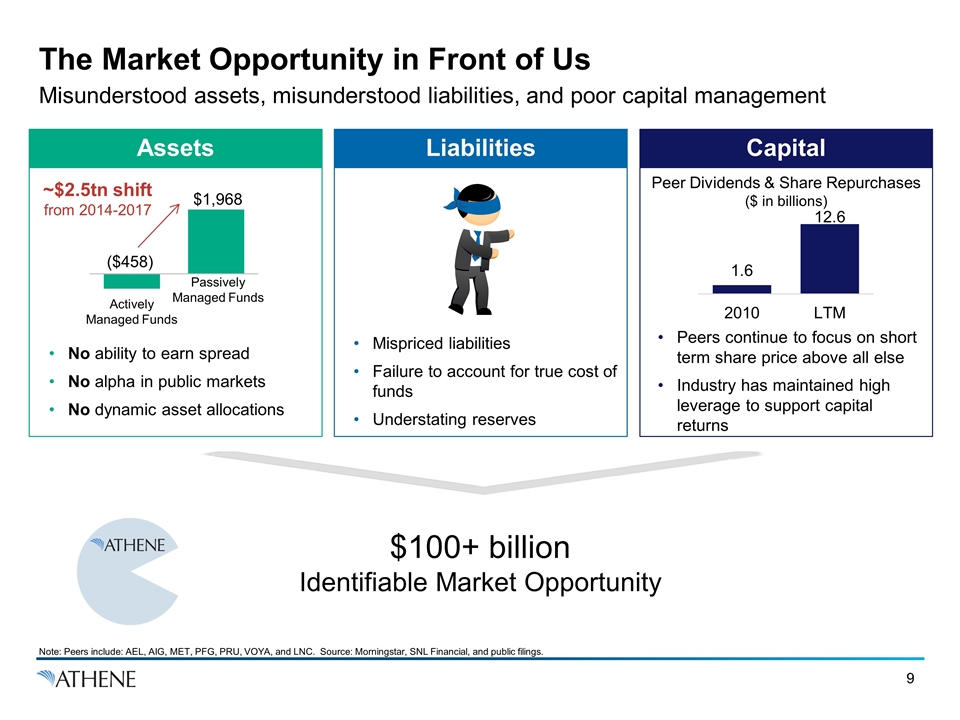
The Market Opportunity in Front of Us Misunderstood assets, misunderstood liabilities, and poor capital management Assets Capital Liabilities Peer Dividends & Share Repurchases ($ in billions) No ability to earn spread No alpha in public markets No dynamic asset allocations $100+ billion Identifiable Market Opportunity Mispriced liabilities Failure to account for true cost of funds Understating reserves Peers continue to focus on short term share price above all else Industry has maintained high leverage to support capital returns ~$2.5tn shift from 2014-2017 Actively Managed Funds Passively Managed Funds Note: Peers include: AEL, AIG, MET, PFG, PRU, VOYA, and LNC. Source: Morningstar, SNL Financial, and public filings.
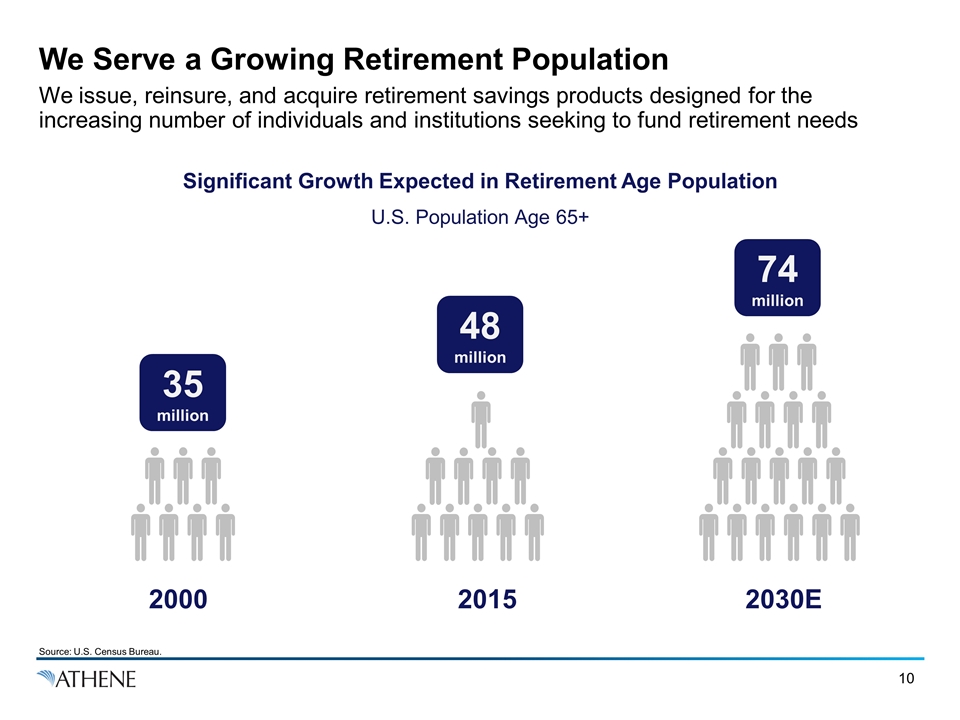
We Serve a Growing Retirement Population We issue, reinsure, and acquire retirement savings products designed for the increasing number of individuals and institutions seeking to fund retirement needs Significant Growth Expected in Retirement Age Population U.S. Population Age 65+ 2000 2015 2030E 35 million 48 million 74 million Source: U.S. Census Bureau.
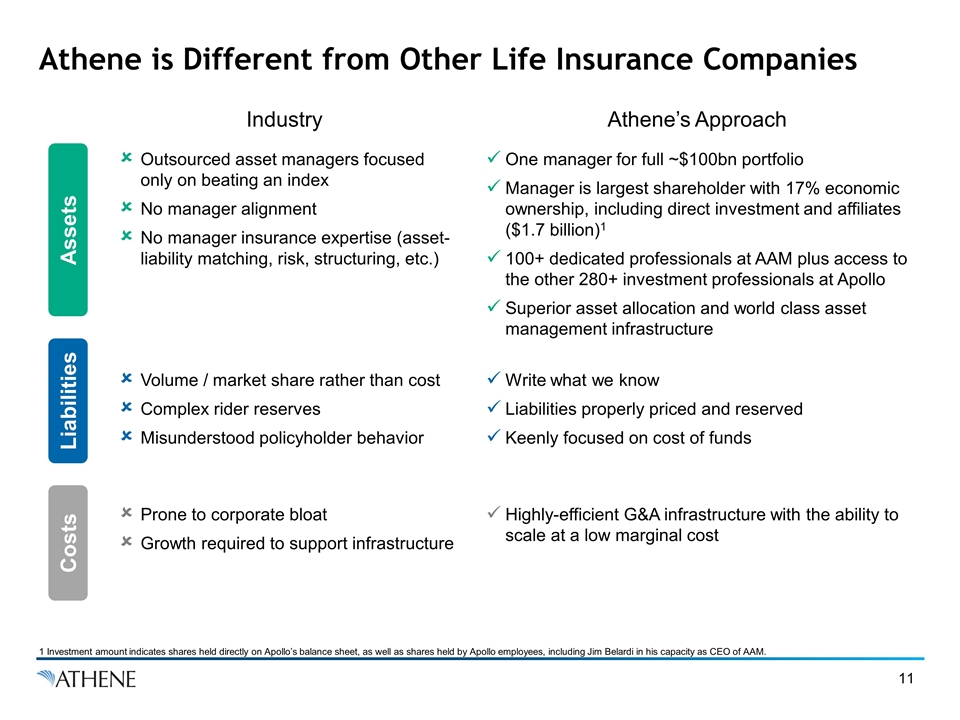
Athene is Different from Other Life Insurance Companies Industry Athene’s Approach Outsourced asset managers focused only on beating an index No manager alignment No manager insurance expertise (asset-liability matching, risk, structuring, etc.) One manager for full ~$100bn portfolio Manager is largest shareholder with 17% economic ownership, including direct investment and affiliates ($1.7 billion)1 100+ dedicated professionals at AAM plus access to the other 280+ investment professionals at Apollo Superior asset allocation and world class asset management infrastructure Volume / market share rather than cost Complex rider reserves Misunderstood policyholder behavior Write what we know Liabilities properly priced and reserved Keenly focused on cost of funds Prone to corporate bloat Growth required to support infrastructure Highly-efficient G&A infrastructure with the ability to scale at a low marginal cost Assets Liabilities Costs 1 Investment amount indicates shares held directly on Apollo’s balance sheet, as well as shares held by Apollo employees, including Jim Belardi in his capacity as CEO of AAM.
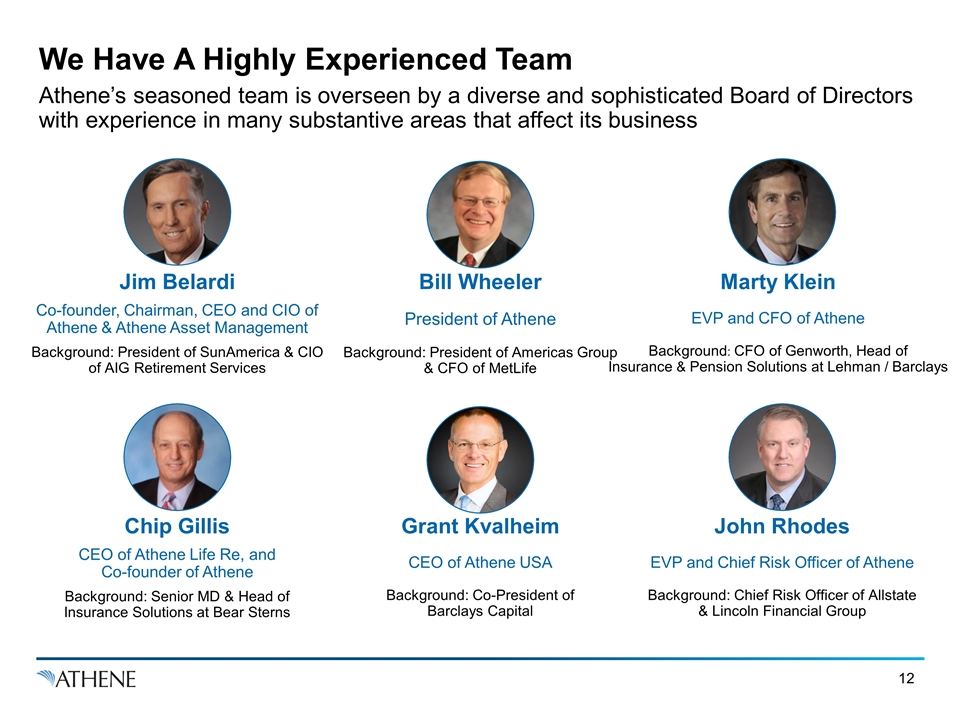
We Have A Highly Experienced Team Athene’s seasoned team is overseen by a diverse and sophisticated Board of Directors with experience in many substantive areas that affect its business Jim Belardi Co-founder, Chairman, CEO and CIO of Athene & Athene Asset Management Background: President of SunAmerica & CIO of AIG Retirement Services Chip Gillis CEO of Athene Life Re, and Co-founder of Athene Background: Senior MD & Head of Insurance Solutions at Bear Sterns Bill Wheeler President of Athene Background: President of Americas Group & CFO of MetLife Grant Kvalheim CEO of Athene USA Background: Co-President of Barclays Capital John Rhodes EVP and Chief Risk Officer of Athene Background: Chief Risk Officer of Allstate & Lincoln Financial Group Marty Klein EVP and CFO of Athene Background: CFO of Genworth, Head of Insurance & Pension Solutions at Lehman / Barclays
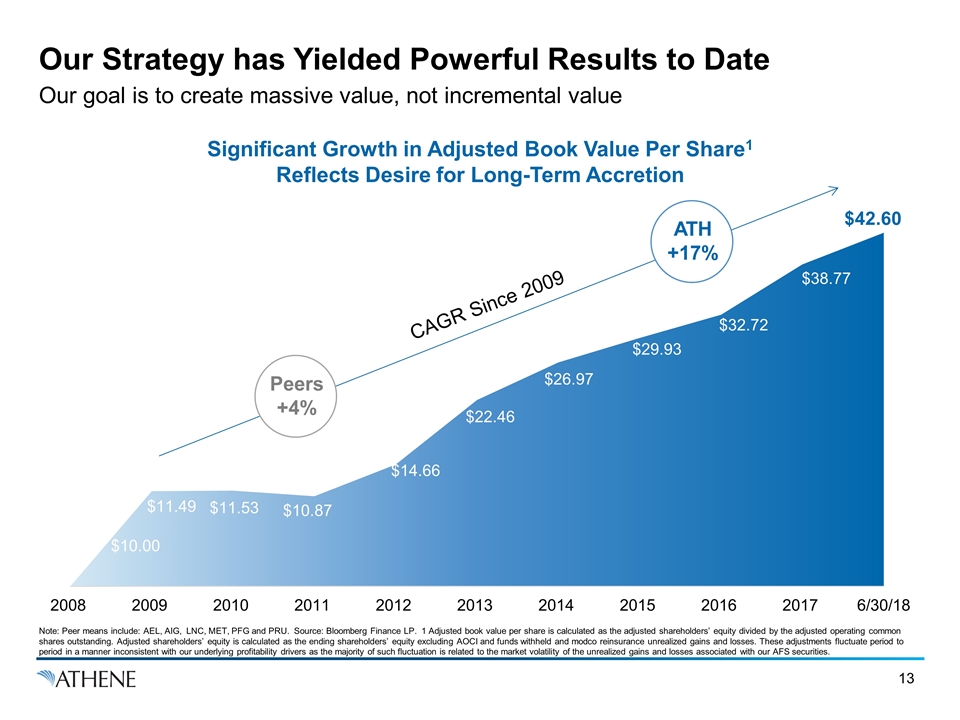
Our Strategy has Yielded Powerful Results to Date Our goal is to create massive value, not incremental value ATH +17% Peers +4% CAGR Since 2009 Significant Growth in Adjusted Book Value Per Share1 Reflects Desire for Long-Term Accretion Note: Peer means include: AEL, AIG, LNC, MET, PFG and PRU. Source: Bloomberg Finance LP. 1 Adjusted book value per share is calculated as the adjusted shareholders’ equity divided by the adjusted operating common shares outstanding. Adjusted shareholders’ equity is calculated as the ending shareholders’ equity excluding AOCI and funds withheld and modco reinsurance unrealized gains and losses. These adjustments fluctuate period to period in a manner inconsistent with our underlying profitability drivers as the majority of such fluctuation is related to the market volatility of the unrealized gains and losses associated with our AFS securities.
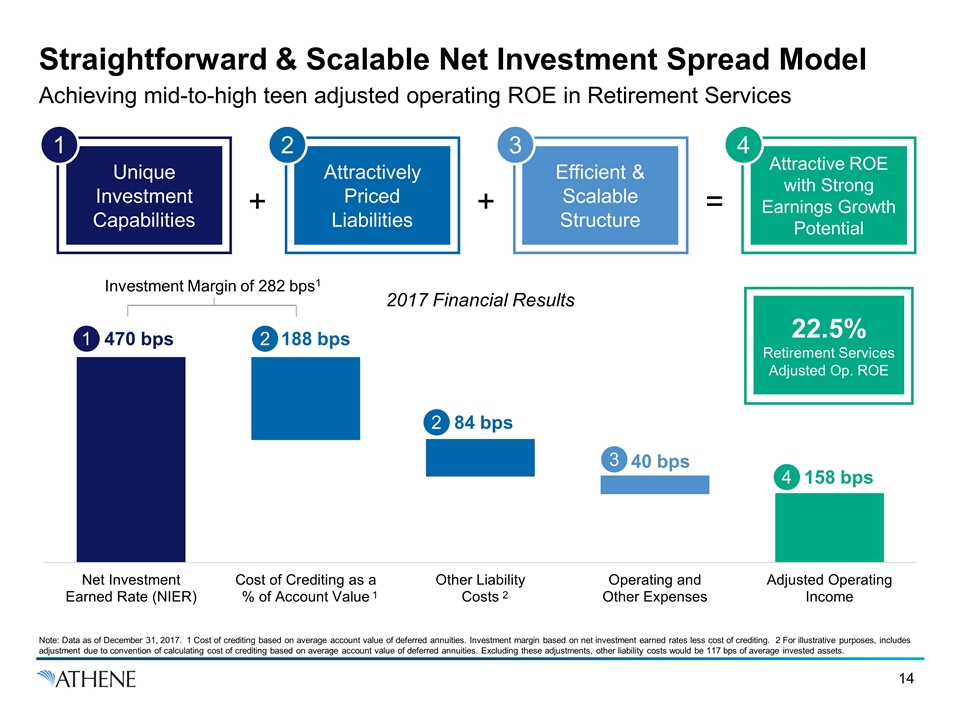
Straightforward & Scalable Net Investment Spread Model Achieving mid-to-high teen adjusted operating ROE in Retirement Services 470 bps 188 bps 2 1 84 bps 2 40 bps 3 158 bps 4 Investment Margin of 282 bps1 Unique Investment Capabilities 1 Attractive ROE with Strong Earnings Growth Potential 4 Attractively Priced Liabilities 2 Efficient & Scalable Structure 3 + + = 22.5% Retirement Services Adjusted Op. ROE 1 2 2017 Financial Results Note: Data as of December 31, 2017. 1 Cost of crediting based on average account value of deferred annuities. Investment margin based on net investment earned rates less cost of crediting. 2 For illustrative purposes, includes adjustment due to convention of calculating cost of crediting based on average account value of deferred annuities. Excluding these adjustments, other liability costs would be 117 bps of average invested assets.
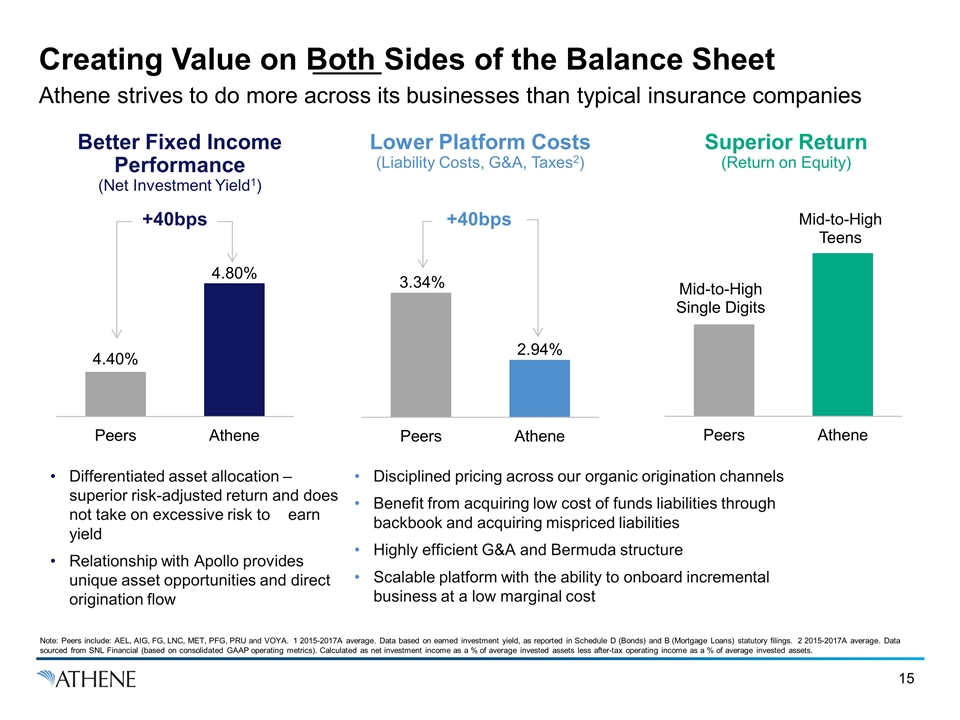
Creating Value on Both Sides of the Balance Sheet Athene strives to do more across its businesses than typical insurance companies +40bps +40bps Better Fixed Income Performance (Net Investment Yield1) Superior Return (Return on Equity) Lower Platform Costs (Liability Costs, G&A, Taxes2) Differentiated asset allocation – superior risk-adjusted return and does not take on excessive risk to earn yield Relationship with Apollo provides unique asset opportunities and direct origination flow Disciplined pricing across our organic origination channels Benefit from acquiring low cost of funds liabilities through backbook and acquiring mispriced liabilities Highly efficient G&A and Bermuda structure Scalable platform with the ability to onboard incremental business at a low marginal cost Note: Peers include: AEL, AIG, FG, LNC, MET, PFG, PRU and VOYA. 1 2015-2017A average. Data based on earned investment yield, as reported in Schedule D (Bonds) and B (Mortgage Loans) statutory filings. 2 2015-2017A average. Data sourced from SNL Financial (based on consolidated GAAP operating metrics). Calculated as net investment income as a % of average invested assets less after-tax operating income as a % of average invested assets.
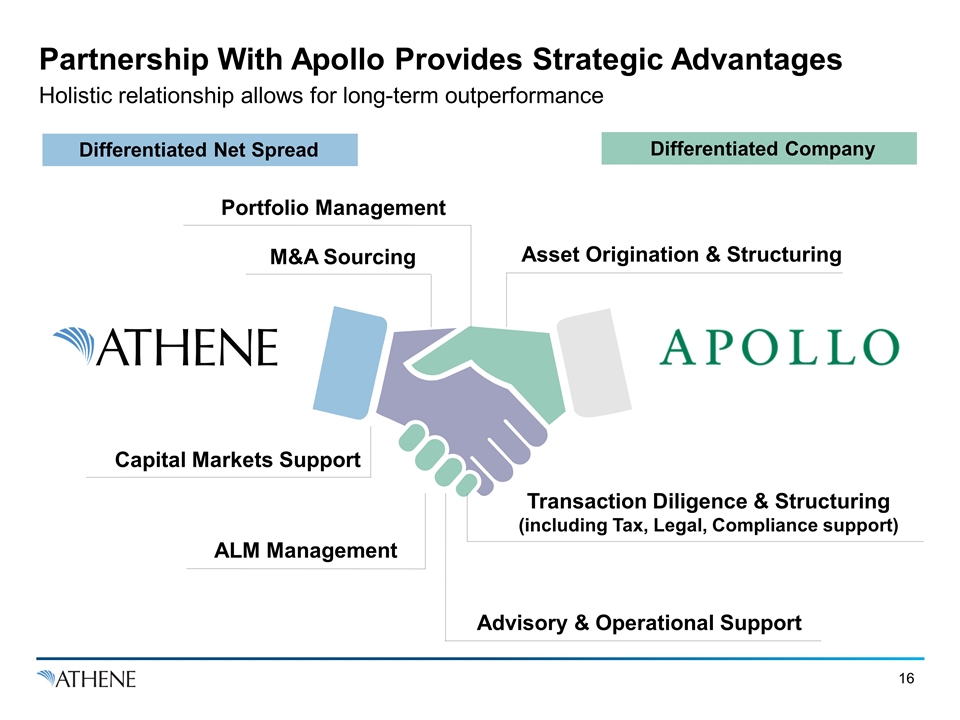
Partnership With Apollo Provides Strategic Advantages Holistic relationship allows for long-term outperformance Portfolio Management Capital Markets Support M&A Sourcing Advisory & Operational Support Asset Origination & Structuring Differentiated Net Spread Differentiated Company ALM Management Transaction Diligence & Structuring (including Tax, Legal, Compliance support)
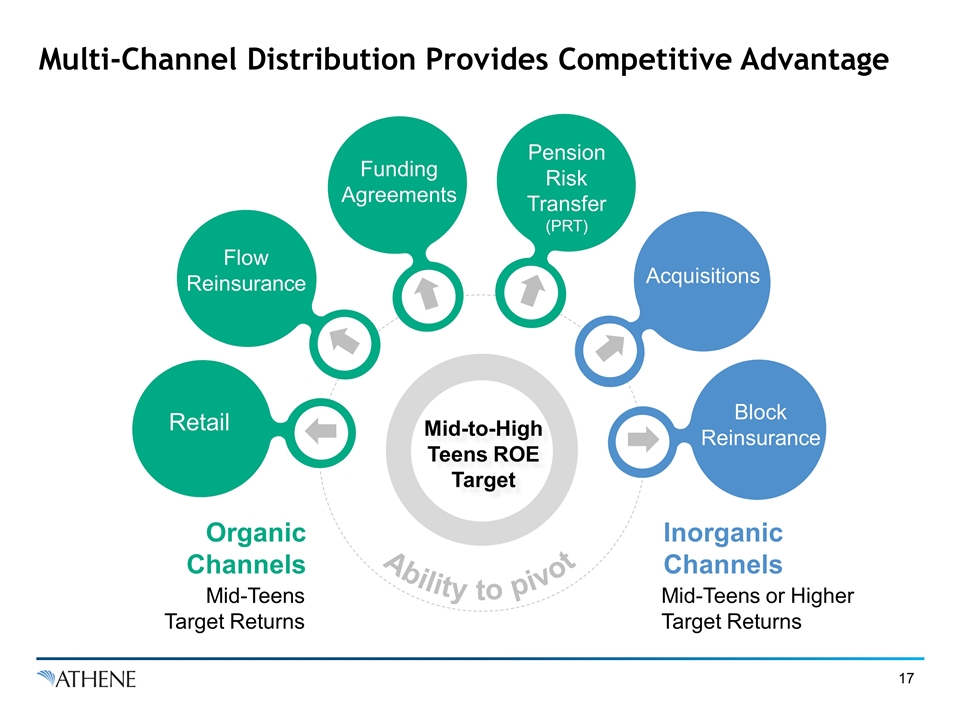
Multi-Channel Distribution Provides Competitive Advantage Flow Reinsurance Retail Pension Risk Transfer (PRT) Acquisitions Block Reinsurance Mid-to-High Teens ROE Target Mid-Teens or Higher Target Returns Inorganic Channels Organic Channels Mid-Teens Target Returns Funding Agreements Ability to pivot
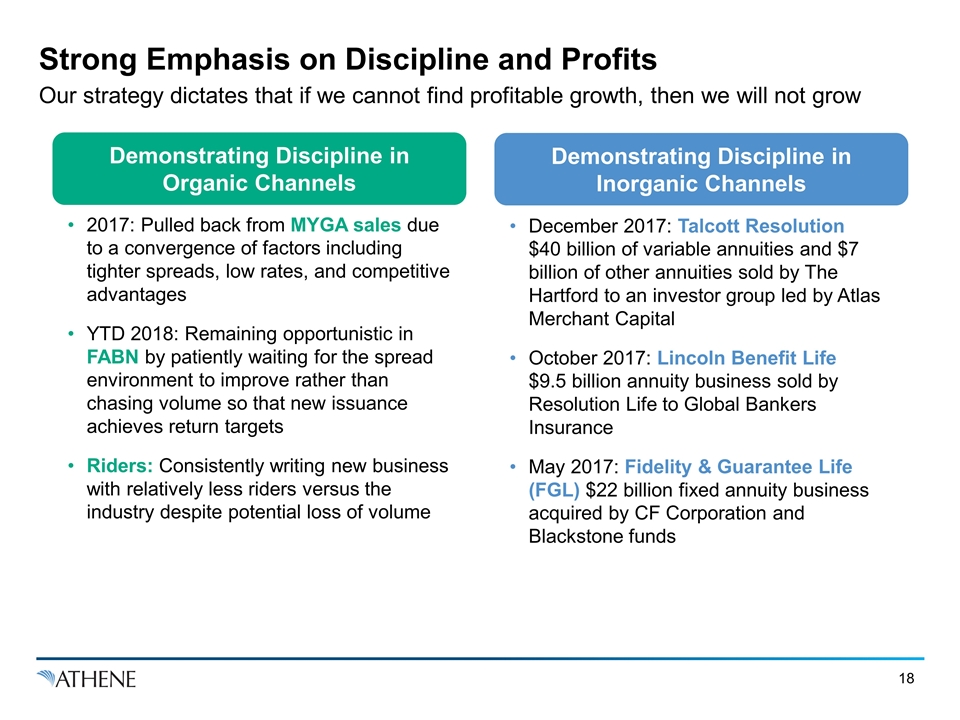
Strong Emphasis on Discipline and Profits Our strategy dictates that if we cannot find profitable growth, then we will not grow Demonstrating Discipline in Organic Channels Demonstrating Discipline in Inorganic Channels 2017: Pulled back from MYGA sales due to a convergence of factors including tighter spreads, low rates, and competitive advantages YTD 2018: Remaining opportunistic in FABN by patiently waiting for the spread environment to improve rather than chasing volume so that new issuance achieves return targets Riders: Consistently writing new business with relatively less riders versus the industry despite potential loss of volume December 2017: Talcott Resolution $40 billion of variable annuities and $7 billion of other annuities sold by The Hartford to an investor group led by Atlas Merchant Capital October 2017: Lincoln Benefit Life $9.5 billion annuity business sold by Resolution Life to Global Bankers Insurance May 2017: Fidelity & Guarantee Life (FGL) $22 billion fixed annuity business acquired by CF Corporation and Blackstone funds
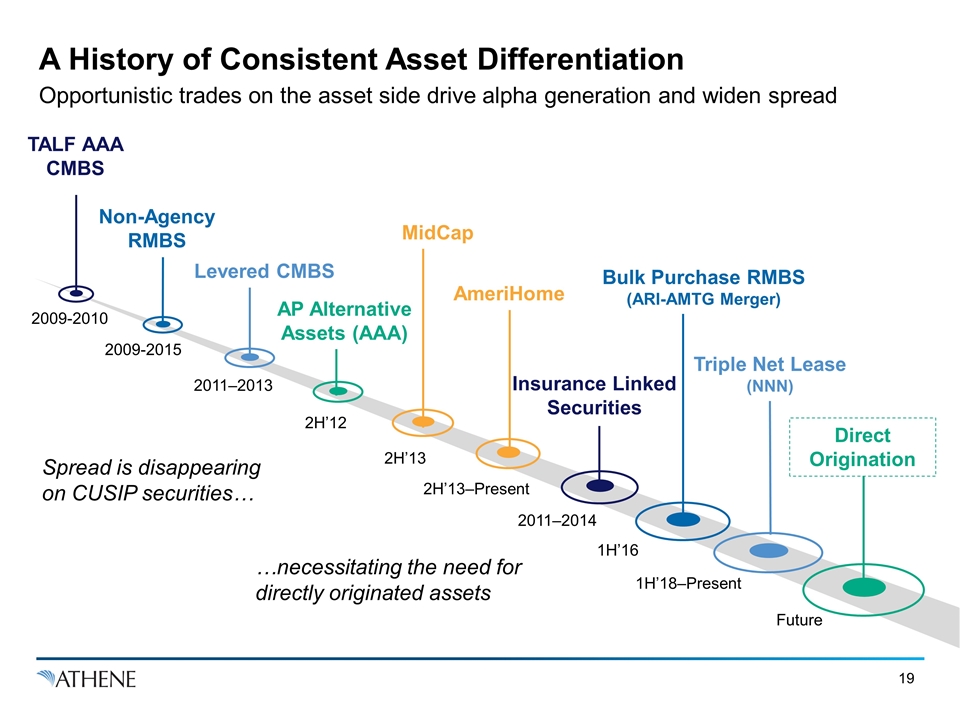
Levered CMBS A History of Consistent Asset Differentiation Opportunistic trades on the asset side drive alpha generation and widen spread 2009-2010 1H’16 1H’18–Present 2011–2014 2H’13 2H’12 2H’13–Present 2011–2013 2009-2015 TALF AAA CMBS Non-Agency RMBS AP Alternative Assets (AAA) MidCap AmeriHome Insurance Linked Securities Bulk Purchase RMBS (ARI-AMTG Merger) Triple Net Lease (NNN) Future Direct Origination Spread is disappearing on CUSIP securities… …necessitating the need for directly originated assets
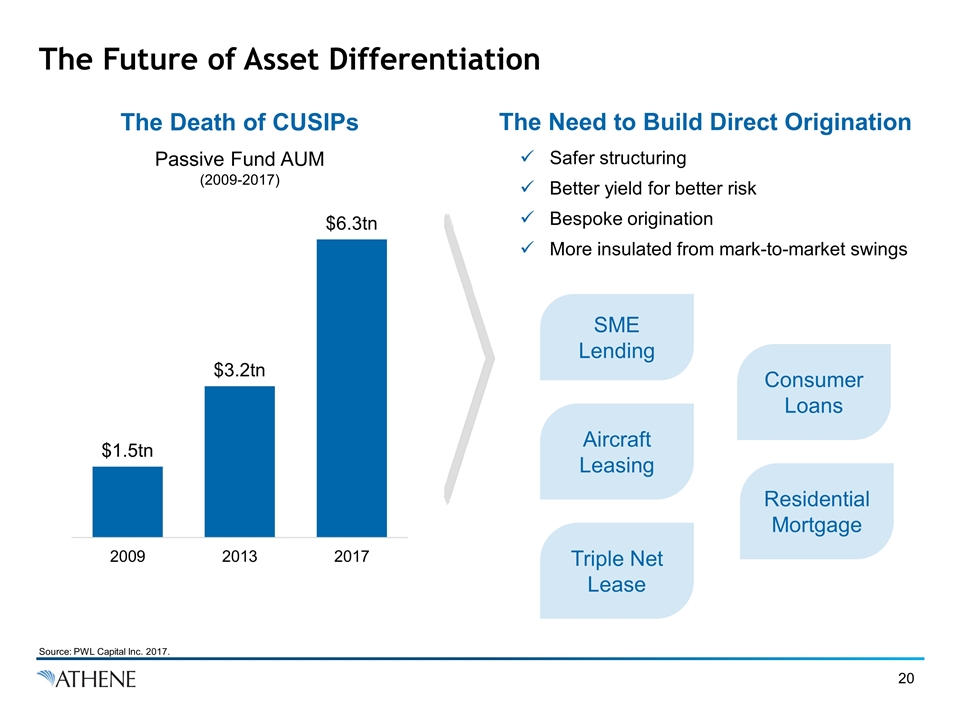
The Future of Asset Differentiation The Death of CUSIPs The Need to Build Direct Origination Safer structuring Better yield for better risk Bespoke origination More insulated from mark-to-market swings Passive Fund AUM (2009-2017) SME Lending Consumer Loans Aircraft Leasing Residential Mortgage Triple Net Lease Source: PWL Capital Inc. 2017.
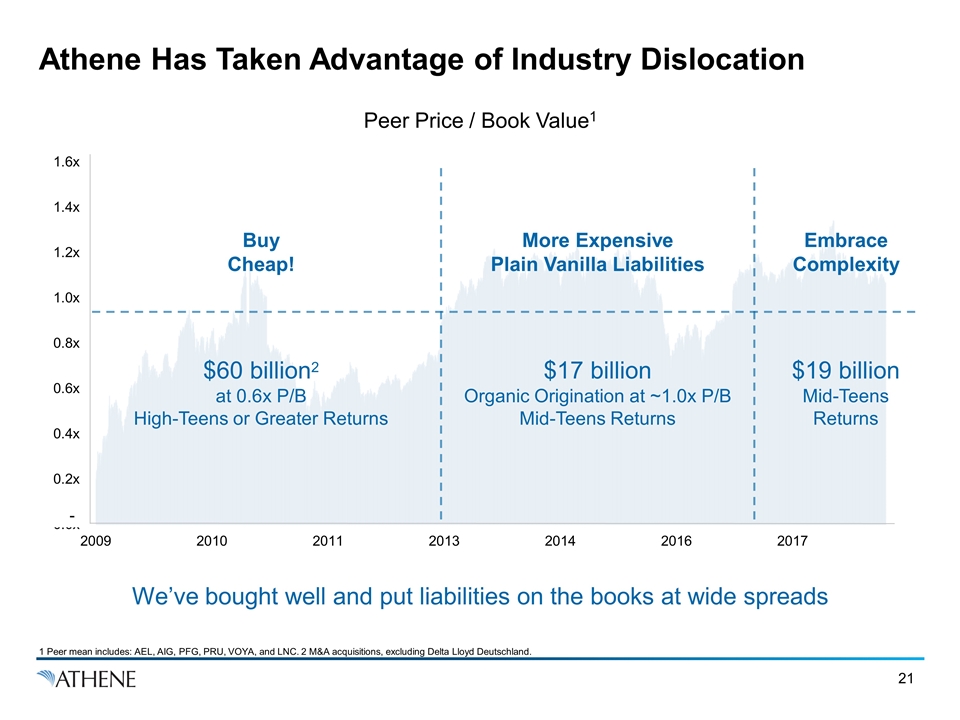
Athene Has Taken Advantage of Industry Dislocation 1 Peer mean includes: AEL, AIG, PFG, PRU, VOYA, and LNC. 2 M&A acquisitions, excluding Delta Lloyd Deutschland. - Peer Price / Book Value1 Buy Cheap! More Expensive Plain Vanilla Liabilities Embrace Complexity We’ve bought well and put liabilities on the books at wide spreads $60 billion2 at 0.6x P/B High-Teens or Greater Returns $19 billion Mid-Teens Returns $17 billion Organic Origination at ~1.0x P/B Mid-Teens Returns
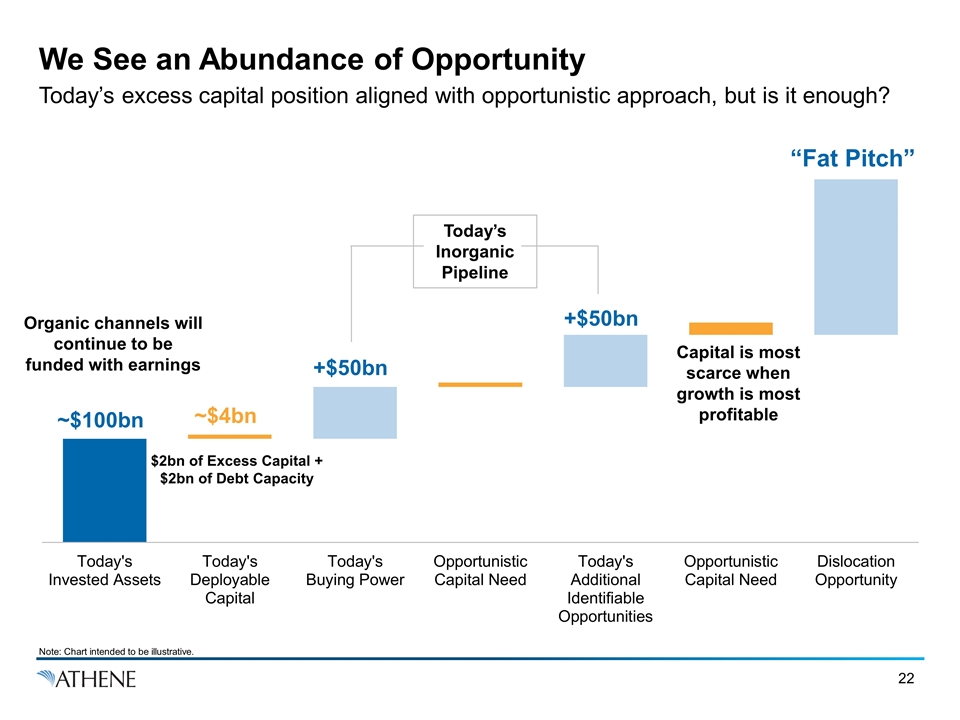
We See an Abundance of Opportunity Today’s excess capital position aligned with opportunistic approach, but is it enough? ~$100bn Organic channels will continue to be funded with earnings $2bn of Excess Capital + $2bn of Debt Capacity ~$4bn +$50bn +$50bn Today’s Inorganic Pipeline Capital is most scarce when growth is most profitable “Fat Pitch” Note: Chart intended to be illustrative.
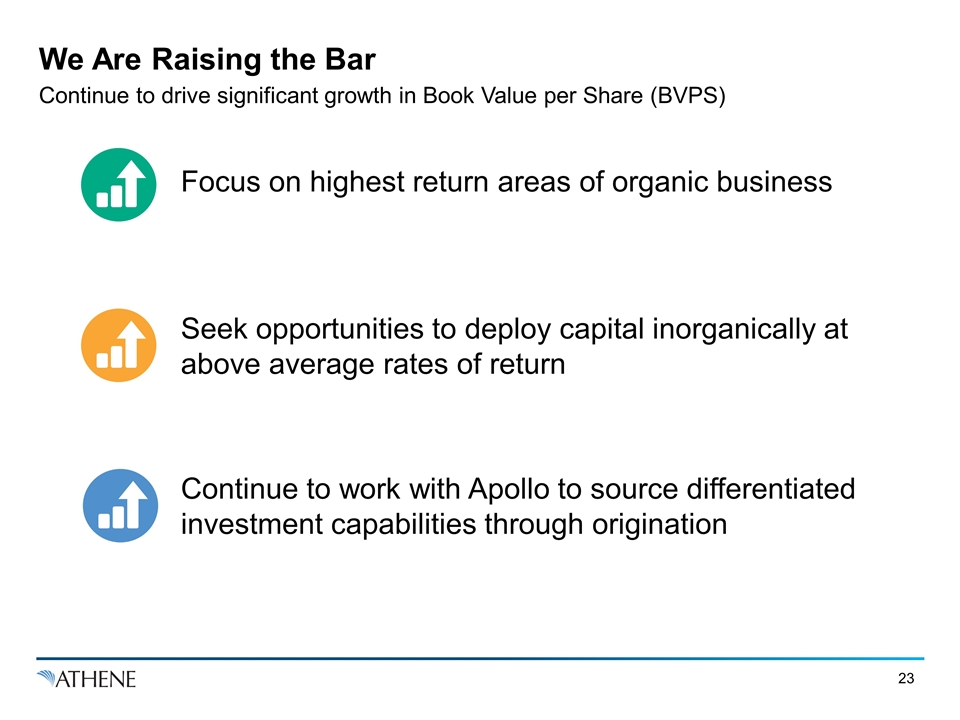
We Are Raising the Bar Continue to drive significant growth in Book Value per Share (BVPS) Focus on highest return areas of organic business Seek opportunities to deploy capital inorganically at above average rates of return Continue to work with Apollo to source differentiated investment capabilities through origination
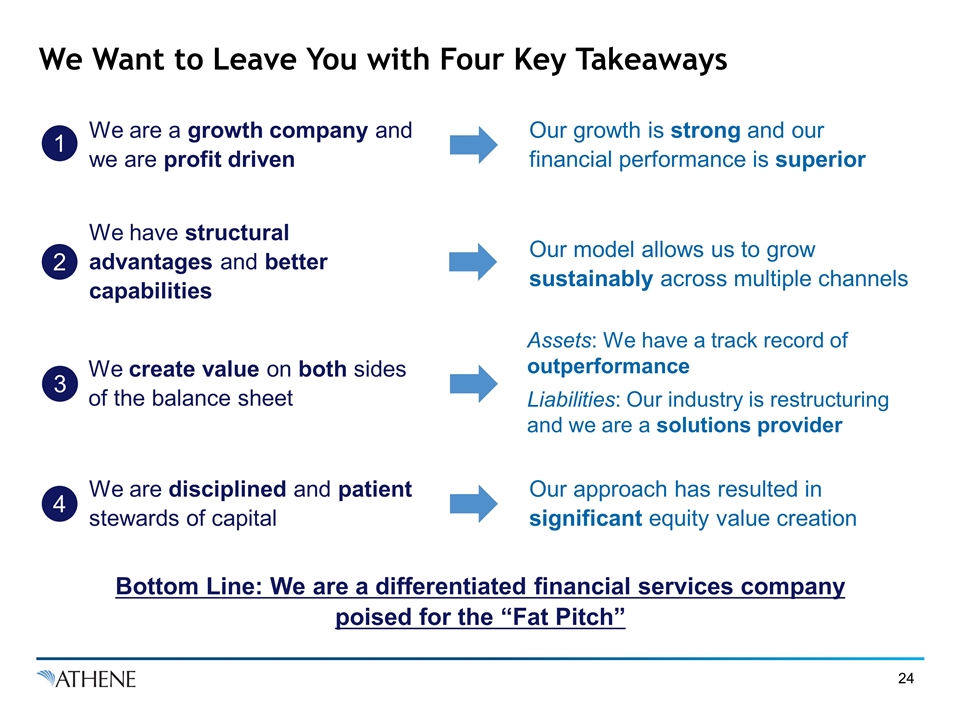
We Want to Leave You with Four Key Takeaways Our growth is strong and our financial performance is superior Bottom Line: We are a differentiated financial services company poised for the “Fat Pitch” We create value on both sides of the balance sheet Our model allows us to grow sustainably across multiple channels We are disciplined and patient stewards of capital Our approach has resulted in significant equity value creation We have structural advantages and better capabilities 3 We are a growth company and we are profit driven 4 2 1 Assets: We have a track record of outperformance Liabilities: Our industry is restructuring and we are a solutions provider

Navigating an Industry in Transition Bill Wheeler
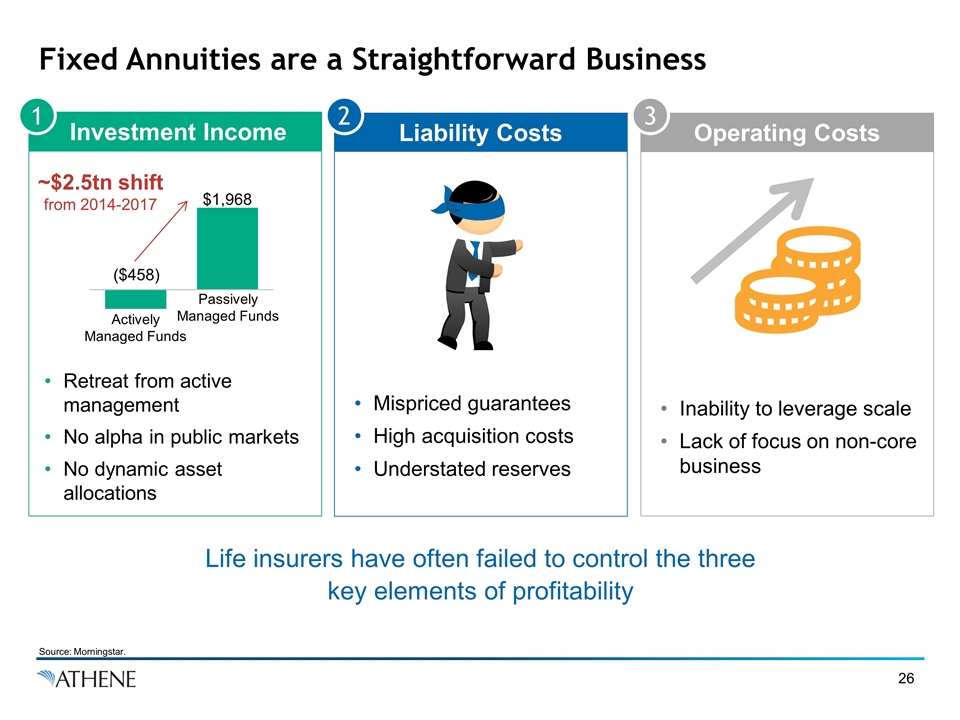
Fixed Annuities are a Straightforward Business Investment Income Liability Costs Operating Costs ~$2.5tn shift from 2014-2017 Actively Managed Funds Passively Managed Funds Retreat from active management No alpha in public markets No dynamic asset allocations Mispriced guarantees High acquisition costs Understated reserves Inability to leverage scale Lack of focus on non-core business 1 2 3 Source: Morningstar. Life insurers have often failed to control the three key elements of profitability
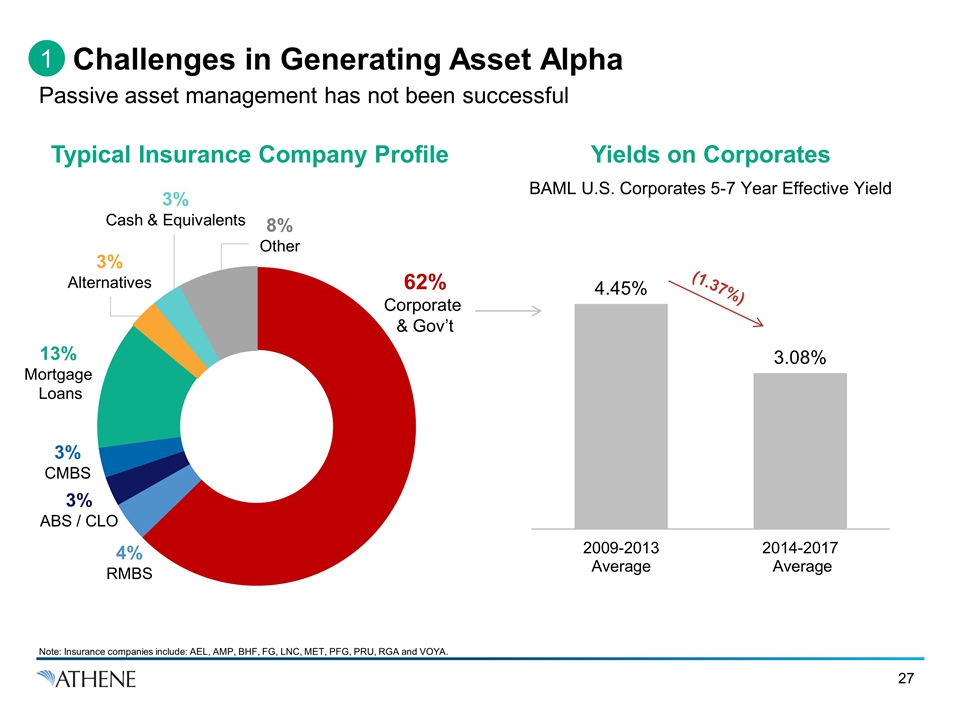
Challenges in Generating Asset Alpha Passive asset management has not been successful Typical Insurance Company Profile Yields on Corporates Note: Insurance companies include: AEL, AMP, BHF, FG, LNC, MET, PFG, PRU, RGA and VOYA. 1 3% ABS / CLO 3% CMBS 13% Mortgage Loans 3% Alternatives 3% Cash & Equivalents 8% Other 62% Corporate & Gov’t (1.37%) BAML U.S. Corporates 5-7 Year Effective Yield 4% RMBS Source From GS / Apollo
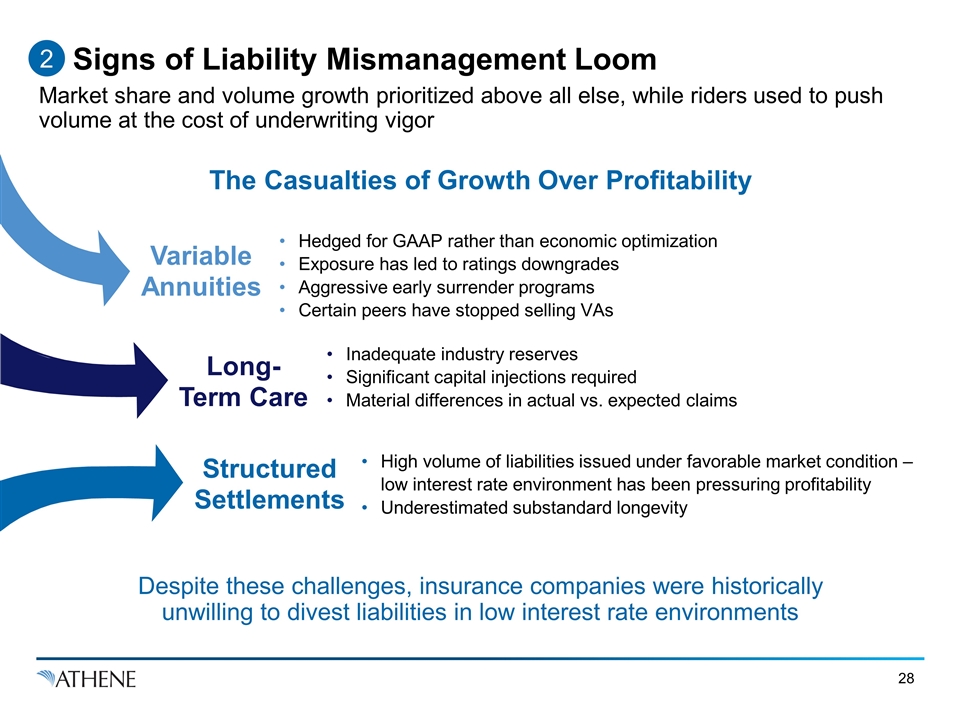
Signs of Liability Mismanagement Loom Market share and volume growth prioritized above all else, while riders used to push volume at the cost of underwriting vigor 2 The Casualties of Growth Over Profitability Variable Annuities Long-Term Care Structured Settlements Hedged for GAAP rather than economic optimization Exposure has led to ratings downgrades Aggressive early surrender programs Certain peers have stopped selling VAs High volume of liabilities issued under favorable market condition – low interest rate environment has been pressuring profitability Underestimated substandard longevity Inadequate industry reserves Significant capital injections required Material differences in actual vs. expected claims Despite these challenges, insurance companies were historically unwilling to divest liabilities in low interest rate environments
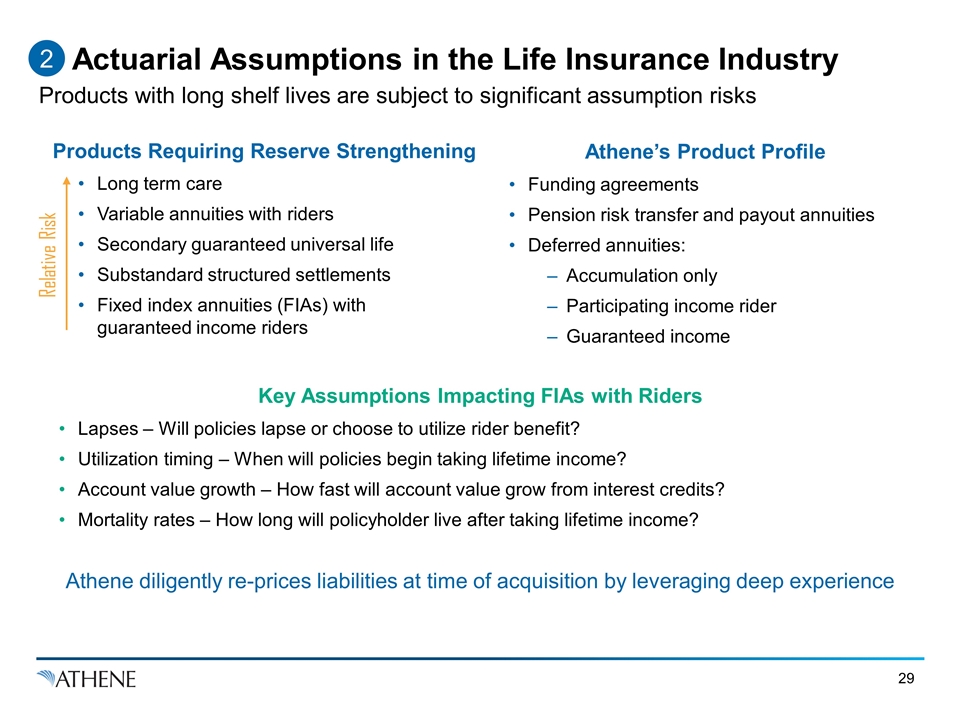
Actuarial Assumptions in the Life Insurance Industry Products with long shelf lives are subject to significant assumption risks Products Requiring Reserve Strengthening Key Assumptions Impacting FIAs with Riders Long term care Variable annuities with riders Secondary guaranteed universal life Substandard structured settlements Fixed index annuities (FIAs) with guaranteed income riders Relative Risk Lapses – Will policies lapse or choose to utilize rider benefit? Utilization timing – When will policies begin taking lifetime income? Account value growth – How fast will account value grow from interest credits? Mortality rates – How long will policyholder live after taking lifetime income? Athene’s Product Profile Funding agreements Pension risk transfer and payout annuities Deferred annuities: Accumulation only Participating income rider Guaranteed income Athene diligently re-prices liabilities at time of acquisition by leveraging deep experience 2
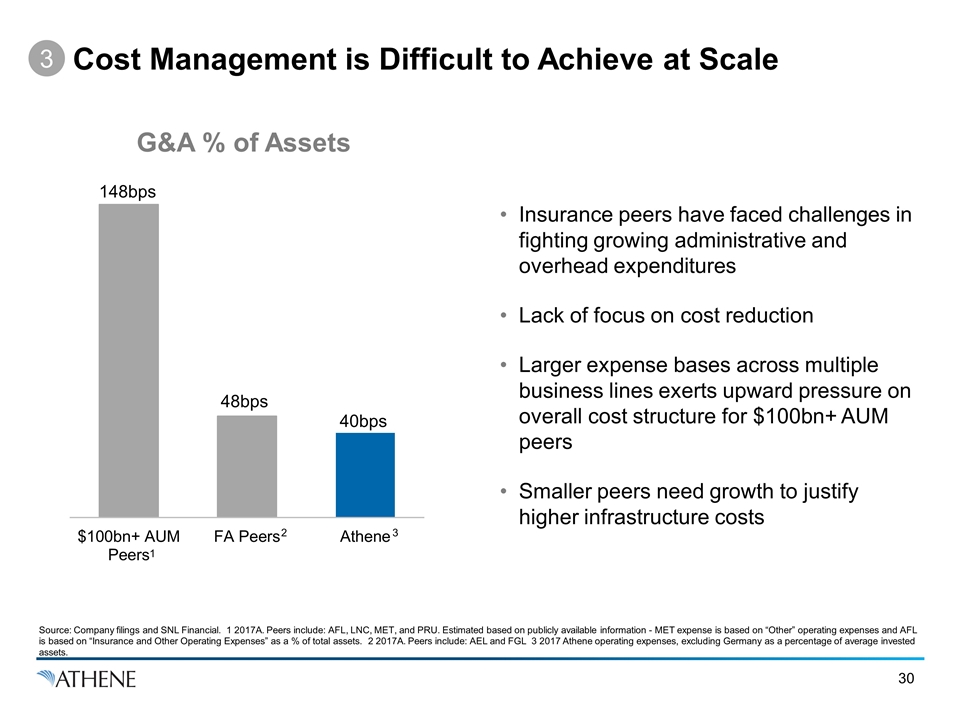
Cost Management is Difficult to Achieve at Scale 3 Source: Company filings and SNL Financial. 1 2017A. Peers include: AFL, LNC, MET, and PRU. Estimated based on publicly available information - MET expense is based on “Other” operating expenses and AFL is based on “Insurance and Other Operating Expenses” as a % of total assets. 2 2017A. Peers include: AEL and FGL 3 2017 Athene operating expenses, excluding Germany as a percentage of average invested assets. G&A % of Assets Insurance peers have faced challenges in fighting growing administrative and overhead expenditures Lack of focus on cost reduction Larger expense bases across multiple business lines exerts upward pressure on overall cost structure for $100bn+ AUM peers Smaller peers need growth to justify higher infrastructure costs 1 2 3
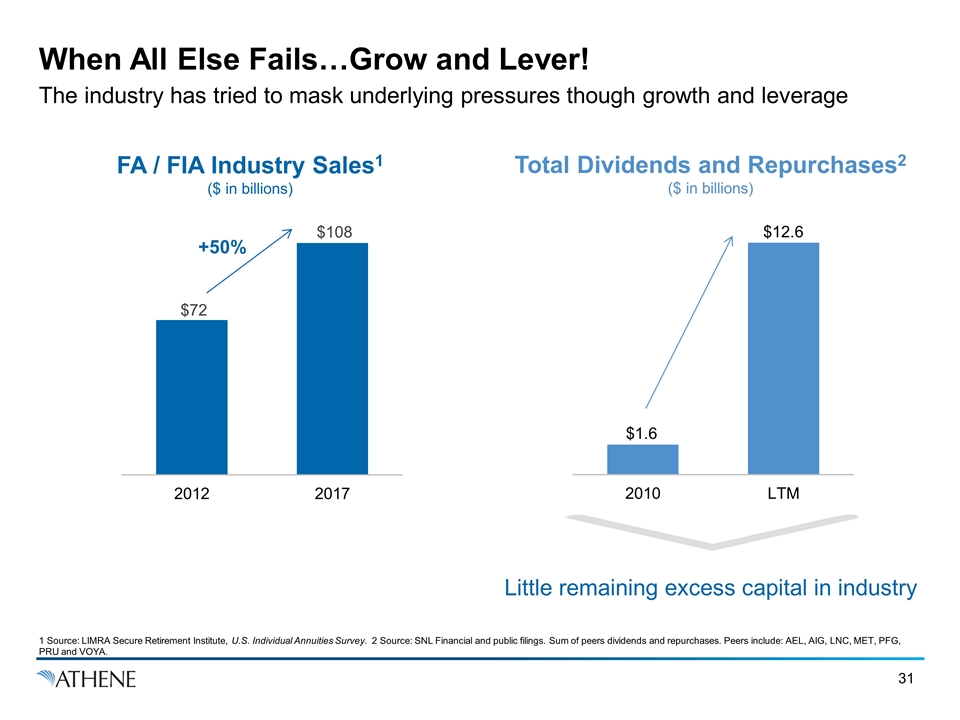
When All Else Fails…Grow and Lever! The industry has tried to mask underlying pressures though growth and leverage FA / FIA Industry Sales1 ($ in billions) Total Dividends and Repurchases2 ($ in billions) 1 Source: LIMRA Secure Retirement Institute, U.S. Individual Annuities Survey. 2 Source: SNL Financial and public filings. Sum of peers dividends and repurchases. Peers include: AEL, AIG, LNC, MET, PFG, PRU and VOYA. +50% Little remaining excess capital in industry
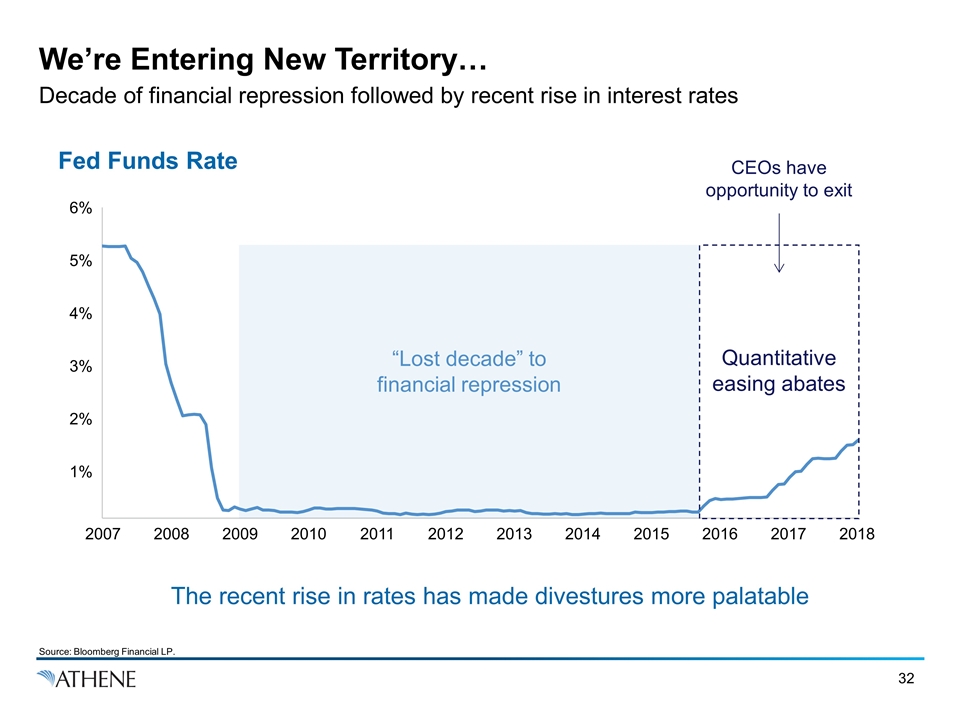
We’re Entering New Territory… Decade of financial repression followed by recent rise in interest rates The recent rise in rates has made divestures more palatable Fed Funds Rate Quantitative easing abates “Lost decade” to financial repression 2007 2008 2009 2010 2011 2012 2013 2014 2015 2016 2017 2018 6% 5% 4% 3% 2% 1% CEOs have opportunity to exit Source: Bloomberg Financial LP.
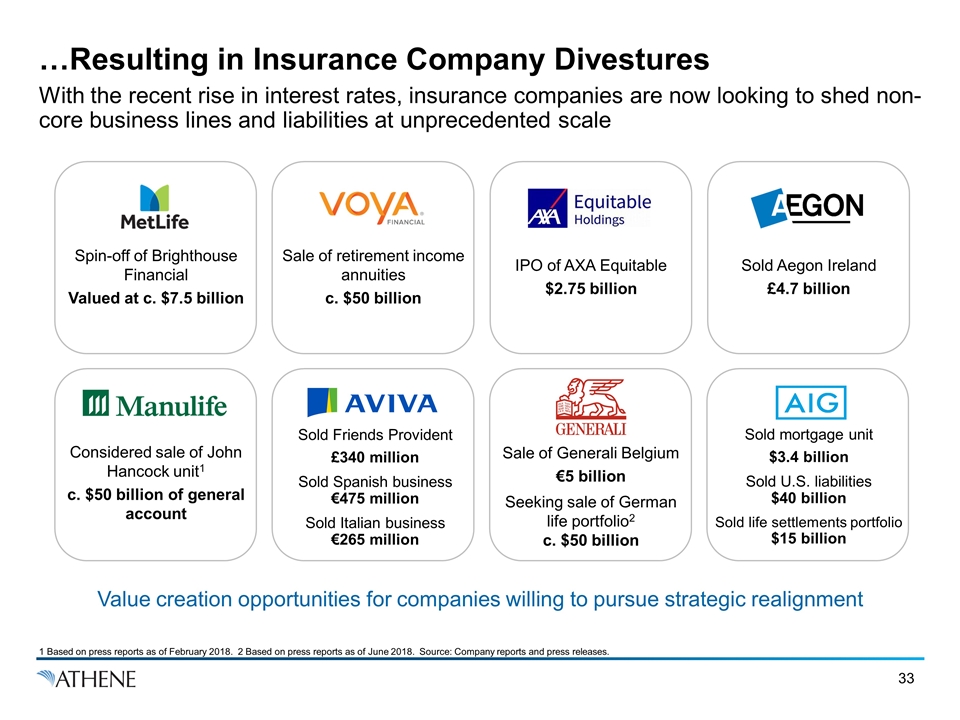
…Resulting in Insurance Company Divestures With the recent rise in interest rates, insurance companies are now looking to shed non-core business lines and liabilities at unprecedented scale Spin-off of Brighthouse Financial Valued at c. $7.5 billion Sale of retirement income annuities c. $50 billion Sold Aegon Ireland £4.7 billion IPO of AXA Equitable $2.75 billion Sold Friends Provident £340 million Sold Spanish business €475 million Sold Italian business €265 million Sale of Generali Belgium €5 billion Seeking sale of German life portfolio2 c. $50 billion Considered sale of John Hancock unit1 c. $50 billion of general account Sold mortgage unit $3.4 billion Sold U.S. liabilities $40 billion Sold life settlements portfolio $15 billion 1 Based on press reports as of February 2018. 2 Based on press reports as of June 2018. Source: Company reports and press releases. Value creation opportunities for companies willing to pursue strategic realignment
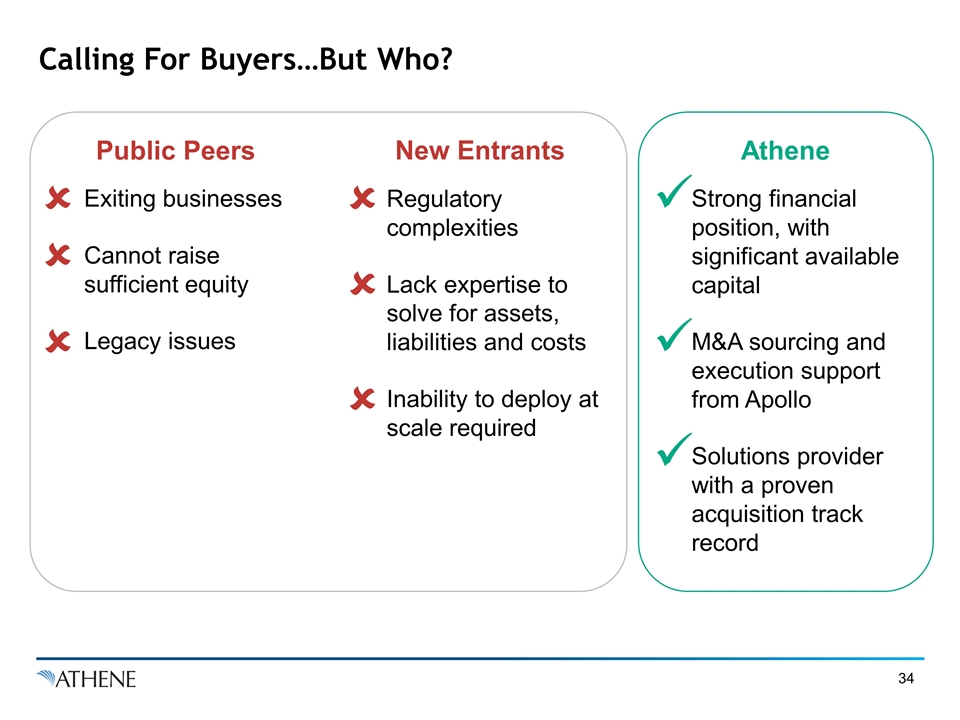
Exiting businesses Cannot raise sufficient equity Legacy issues Regulatory complexities Lack expertise to solve for assets, liabilities and costs Inability to deploy at scale required Strong financial position, with significant available capital M&A sourcing and execution support from Apollo Solutions provider with a proven acquisition track record Calling For Buyers…But Who? Athene Public Peers New Entrants
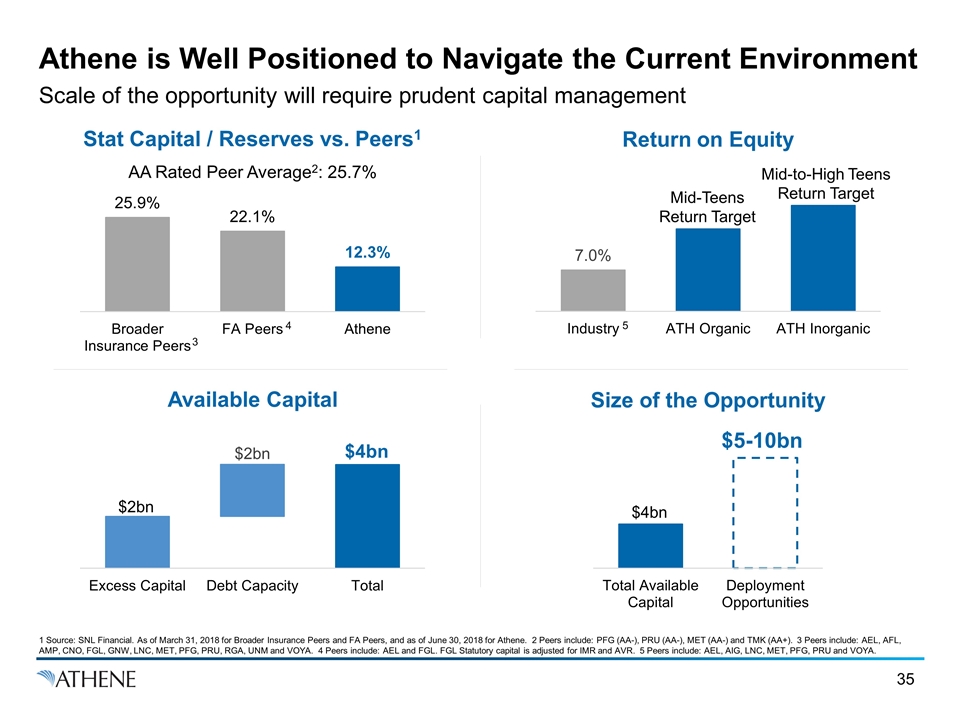
Athene is Well Positioned to Navigate the Current Environment Scale of the opportunity will require prudent capital management Return on Equity Available Capital Size of the Opportunity AA Rated Peer Average2: 25.7% Stat Capital / Reserves vs. Peers1 1 Source: SNL Financial. As of March 31, 2018 for Broader Insurance Peers and FA Peers, and as of June 30, 2018 for Athene. 2 Peers include: PFG (AA-), PRU (AA-), MET (AA-) and TMK (AA+). 3 Peers include: AEL, AFL, AMP, CNO, FGL, GNW, LNC, MET, PFG, PRU, RGA, UNM and VOYA. 4 Peers include: AEL and FGL. FGL Statutory capital is adjusted for IMR and AVR. 5 Peers include: AEL, AIG, LNC, MET, PFG, PRU and VOYA. Mid-to-High Teens Return Target Mid-Teens Return Target $5-10bn 3 4 5
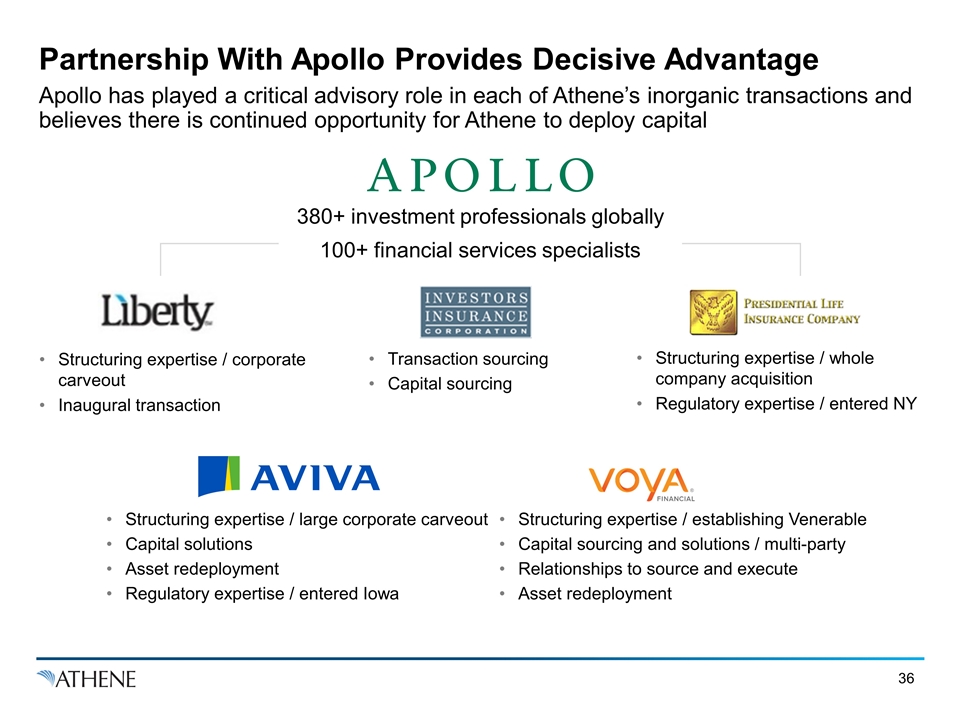
Partnership With Apollo Provides Decisive Advantage Apollo has played a critical advisory role in each of Athene’s inorganic transactions and believes there is continued opportunity for Athene to deploy capital 380+ investment professionals globally 100+ financial services specialists Structuring expertise / corporate carveout Inaugural transaction Transaction sourcing Capital sourcing Structuring expertise / whole company acquisition Regulatory expertise / entered NY Structuring expertise / large corporate carveout Capital solutions Asset redeployment Regulatory expertise / entered Iowa Structuring expertise / establishing Venerable Capital sourcing and solutions / multi-party Relationships to source and execute Asset redeployment
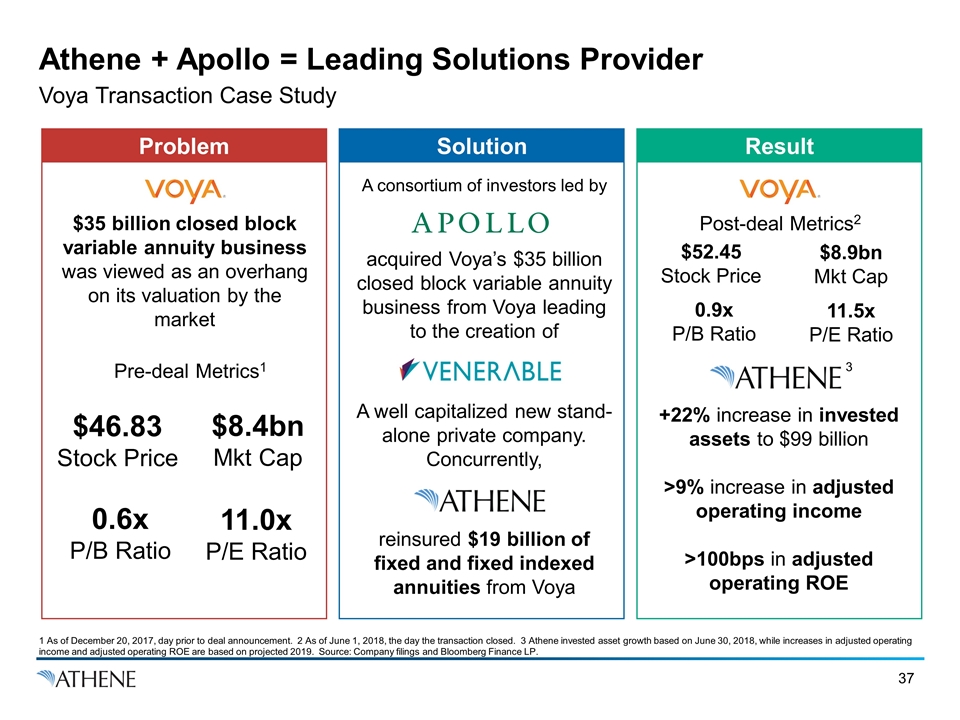
A consortium of investors led by acquired Voya’s $35 billion closed block variable annuity business from Voya leading to the creation of A well capitalized new stand-alone private company. Concurrently, reinsured $19 billion of fixed and fixed indexed annuities from Voya Athene + Apollo = Leading Solutions Provider Voya Transaction Case Study Problem Pre-deal Metrics1 $35 billion closed block variable annuity business was viewed as an overhang on its valuation by the market +22% increase in invested assets to $99 billion >9% increase in adjusted operating income >100bps in adjusted operating ROE Post-deal Metrics2 $46.83 Stock Price 11.0x P/E Ratio 0.6x P/B Ratio Solution Result $8.4bn Mkt Cap $52.45 Stock Price 11.5x P/E Ratio 0.9x P/B Ratio $8.9bn Mkt Cap 1 As of December 20, 2017, day prior to deal announcement. 2 As of June 1, 2018, the day the transaction closed. 3 Athene invested asset growth based on June 30, 2018, while increases in adjusted operating income and adjusted operating ROE are based on projected 2019. Source: Company filings and Bloomberg Finance LP. 3

Investment Philosophy Focused on Returns & Downside Protection Jim Belardi
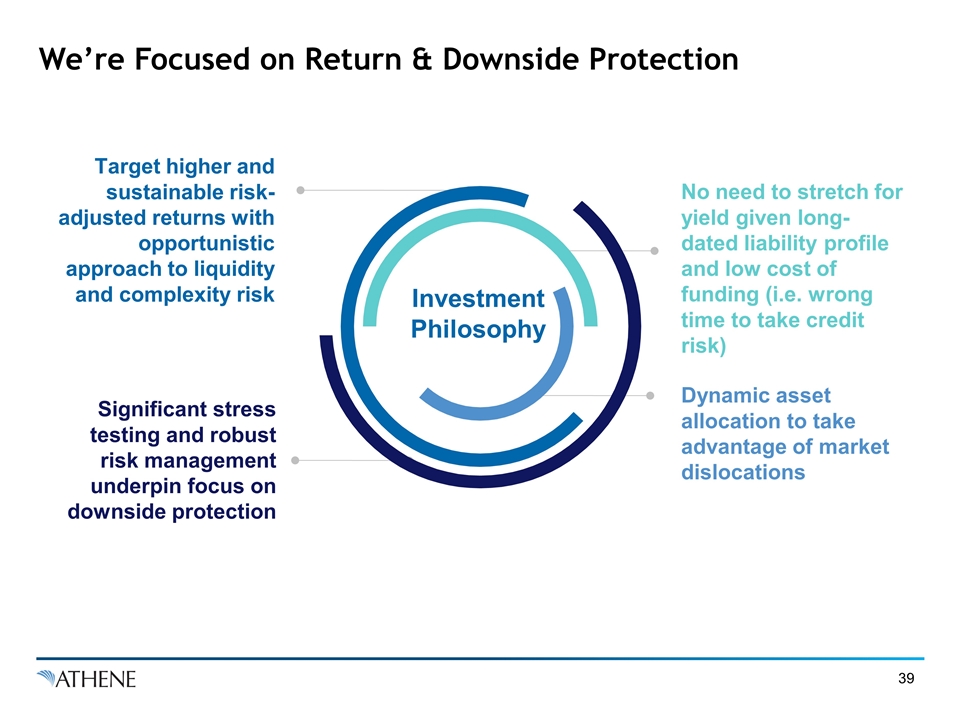
We’re Focused on Return & Downside Protection Investment Philosophy Target higher and sustainable risk-adjusted returns with opportunistic approach to liquidity and complexity risk Significant stress testing and robust risk management underpin focus on downside protection No need to stretch for yield given long-dated liability profile and low cost of funding (i.e. wrong time to take credit risk) Dynamic asset allocation to take advantage of market dislocations
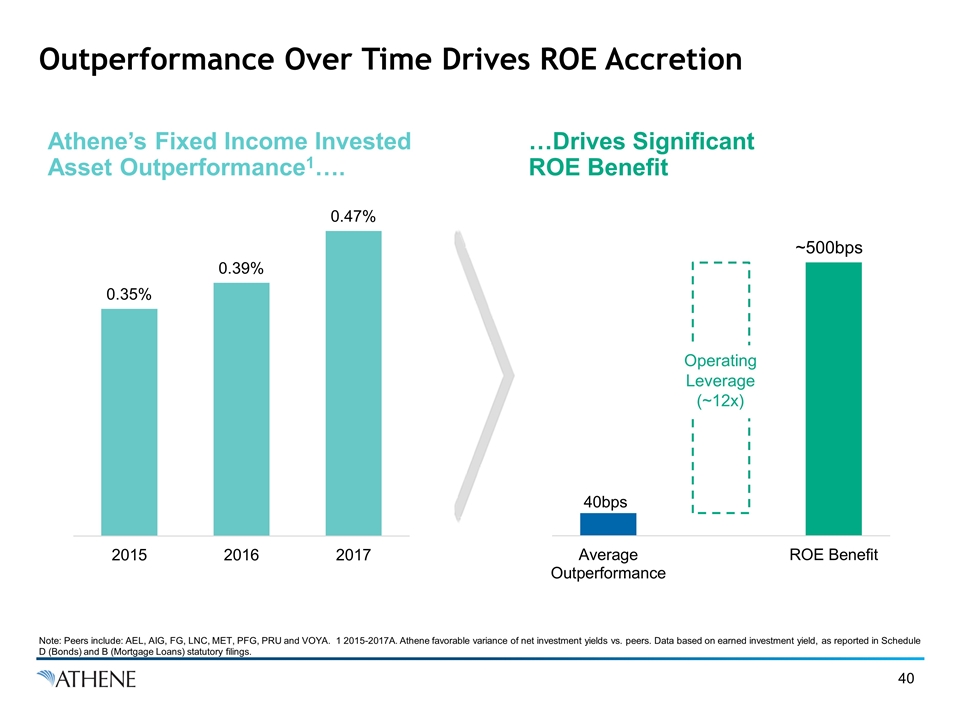
Outperformance Over Time Drives ROE Accretion Athene’s Fixed Income Invested Asset Outperformance1…. …Drives Significant ROE Benefit Note: Peers include: AEL, AIG, FG, LNC, MET, PFG, PRU and VOYA. 1 2015-2017A. Athene favorable variance of net investment yields vs. peers. Data based on earned investment yield, as reported in Schedule D (Bonds) and B (Mortgage Loans) statutory filings.
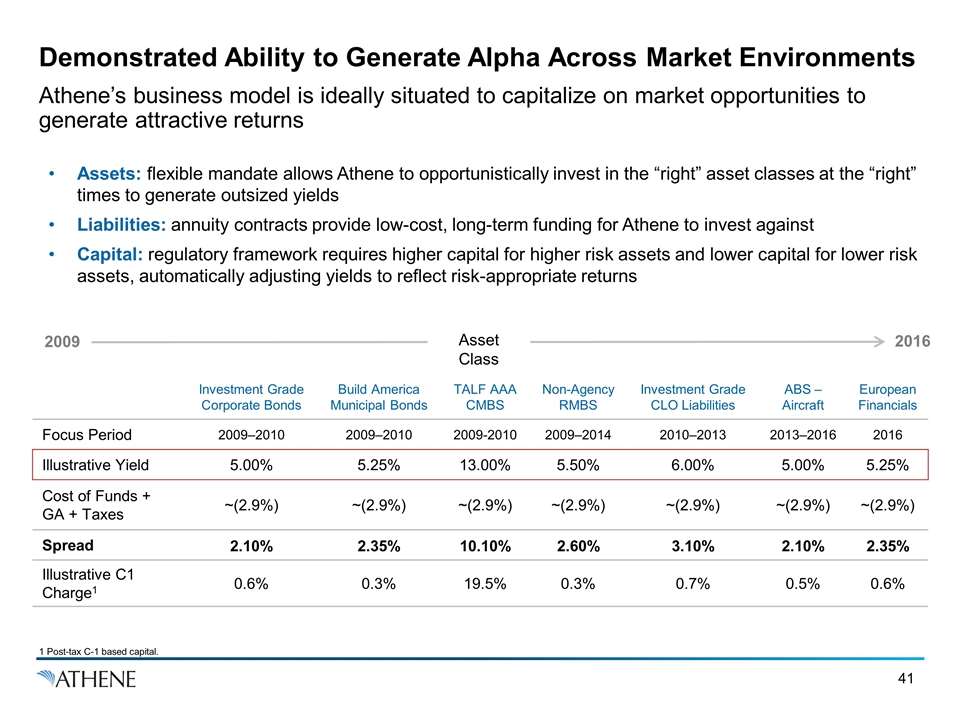
Investment Grade Corporate Bonds Build America Municipal Bonds TALF AAA CMBS Non-Agency RMBS Investment Grade CLO Liabilities ABS – Aircraft European Financials Focus Period 2009–2010 2009–2010 2009-2010 2009–2014 2010–2013 2013–2016 2016 Illustrative Yield 5.00% 5.25% 13.00% 5.50% 6.00% 5.00% 5.25% Cost of Funds + GA + Taxes ~(2.9%) ~(2.9%) ~(2.9%) ~(2.9%) ~(2.9%) ~(2.9%) ~(2.9%) Spread 2.10% 2.35% 10.10% 2.60% 3.10% 2.10% 2.35% Illustrative C1 Charge1 0.6% 0.3% 19.5% 0.3% 0.7% 0.5% 0.6% Demonstrated Ability to Generate Alpha Across Market Environments Athene’s business model is ideally situated to capitalize on market opportunities to generate attractive returns 2016 2009 Asset Class Assets: flexible mandate allows Athene to opportunistically invest in the “right” asset classes at the “right” times to generate outsized yields Liabilities: annuity contracts provide low-cost, long-term funding for Athene to invest against Capital: regulatory framework requires higher capital for higher risk assets and lower capital for lower risk assets, automatically adjusting yields to reflect risk-appropriate returns 1 Post-tax C-1 based capital.
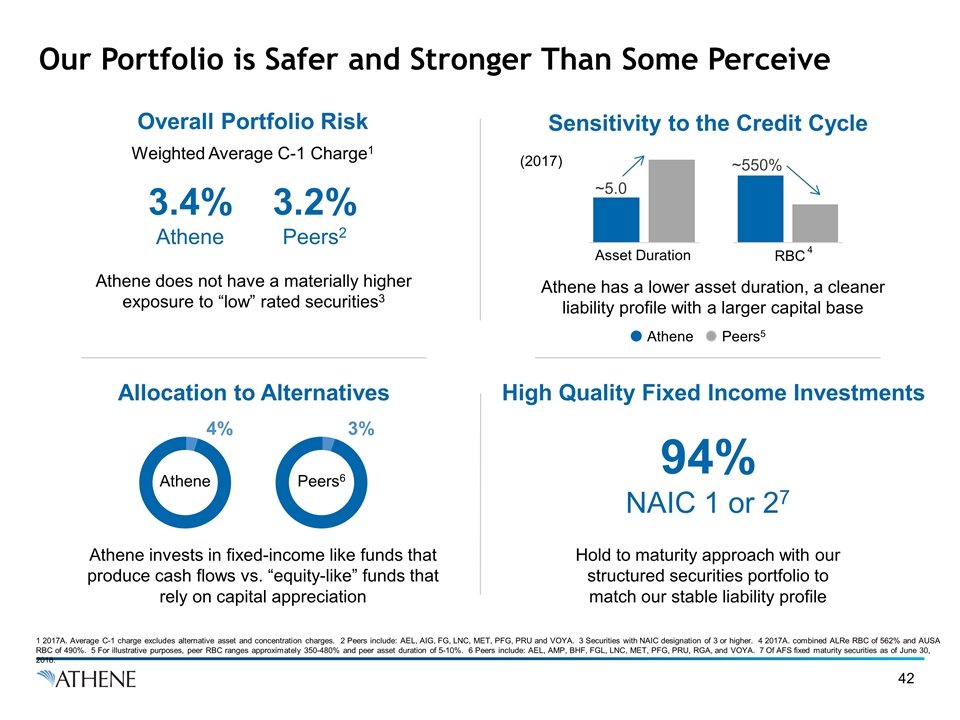
Our Portfolio is Safer and Stronger Than Some Perceive Overall Portfolio Risk Weighted Average C-1 Charge1 Sensitivity to the Credit Cycle Allocation to Alternatives High Quality Fixed Income Investments 3.4% Athene 3.2% Peers2 Athene does not have a materially higher exposure to “low” rated securities3 Athene has a lower asset duration, a cleaner liability profile with a larger capital base Athene invests in fixed-income like funds that produce cash flows vs. “equity-like” funds that rely on capital appreciation Hold to maturity approach with our structured securities portfolio to match our stable liability profile Athene 4% Peers6 3% 94% NAIC 1 or 27 1 2017A. Average C-1 charge excludes alternative asset and concentration charges. 2 Peers include: AEL, AIG, FG, LNC, MET, PFG, PRU and VOYA. 3 Securities with NAIC designation of 3 or higher. 4 2017A. combined ALRe RBC of 562% and AUSA RBC of 490%. 5 For illustrative purposes, peer RBC ranges approximately 350-480% and peer asset duration of 5-10%. 6 Peers include: AEL, AMP, BHF, FGL, LNC, MET, PFG, PRU, RGA, and VOYA. 7 Of AFS fixed maturity securities as of June 30, 2018. RBC Asset Duration Athene Peers5 4 (2017)
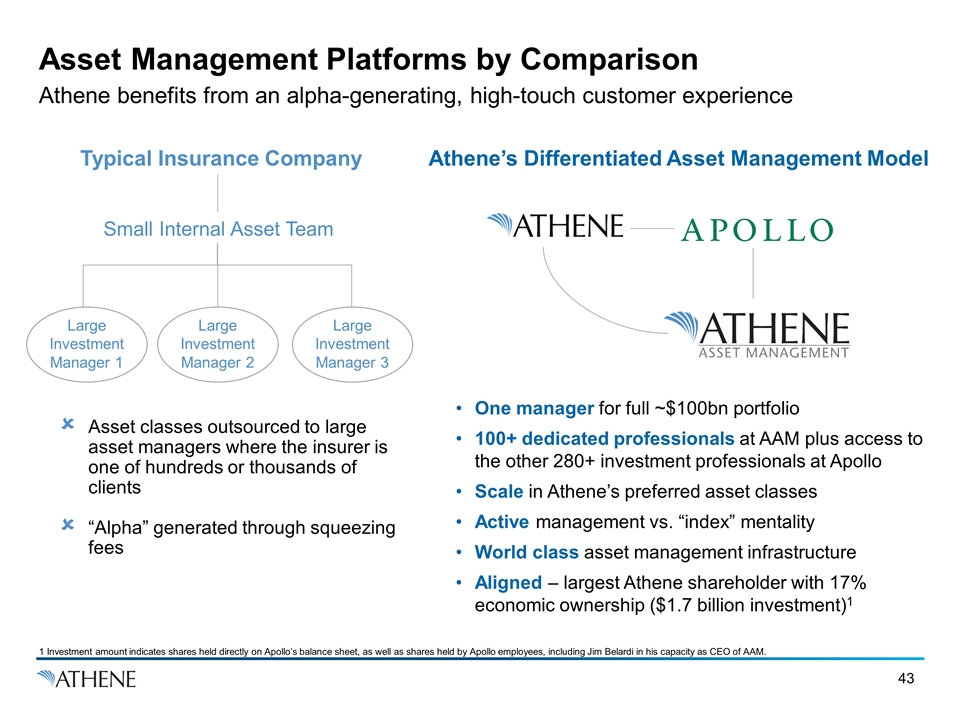
Asset Management Platforms by Comparison Athene benefits from an alpha-generating, high-touch customer experience Typical Insurance Company Athene’s Differentiated Asset Management Model Large Investment Manager 1 Large Investment Manager 3 Small Internal Asset Team Asset classes outsourced to large asset managers where the insurer is one of hundreds or thousands of clients “Alpha” generated through squeezing fees One manager for full ~$100bn portfolio 100+ dedicated professionals at AAM plus access to the other 280+ investment professionals at Apollo Scale in Athene’s preferred asset classes Active management vs. “index” mentality World class asset management infrastructure Aligned – largest Athene shareholder with 17% economic ownership ($1.7 billion investment)1 1 Investment amount indicates shares held directly on Apollo’s balance sheet, as well as shares held by Apollo employees, including Jim Belardi in his capacity as CEO of AAM. Large Investment Manager 2
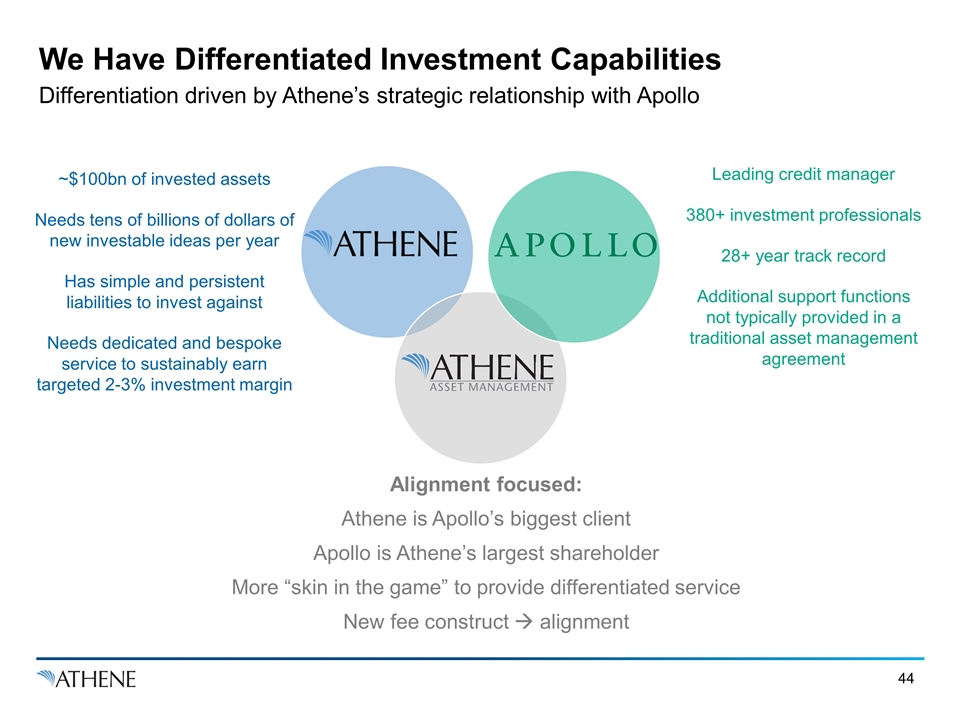
We Have Differentiated Investment Capabilities Differentiation driven by Athene’s strategic relationship with Apollo ~$100bn of invested assets Needs tens of billions of dollars of new investable ideas per year Has simple and persistent liabilities to invest against Needs dedicated and bespoke service to sustainably earn targeted 2-3% investment margin Leading credit manager 380+ investment professionals 28+ year track record Additional support functions not typically provided in a traditional asset management agreement Alignment focused: Athene is Apollo’s biggest client Apollo is Athene’s largest shareholder More “skin in the game” to provide differentiated service New fee construct à alignment
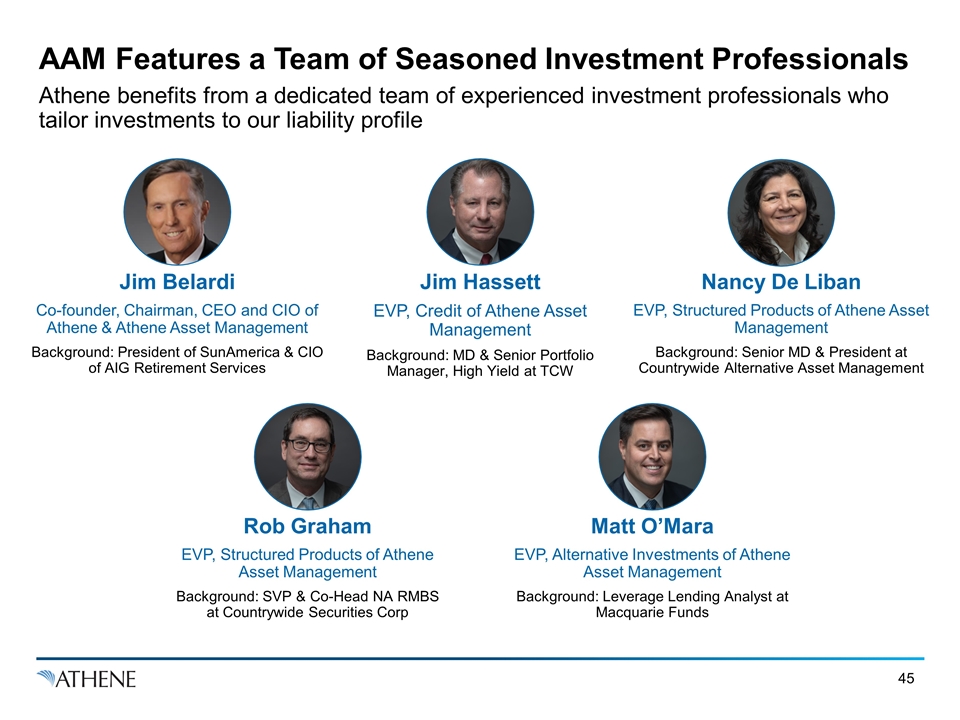
AAM Features a Team of Seasoned Investment Professionals Athene benefits from a dedicated team of experienced investment professionals who tailor investments to our liability profile Jim Belardi Co-founder, Chairman, CEO and CIO of Athene & Athene Asset Management Background: President of SunAmerica & CIO of AIG Retirement Services Rob Graham EVP, Structured Products of Athene Asset Management Background: SVP & Co-Head NA RMBS at Countrywide Securities Corp Jim Hassett EVP, Credit of Athene Asset Management Background: MD & Senior Portfolio Manager, High Yield at TCW Matt O’Mara EVP, Alternative Investments of Athene Asset Management Background: Leverage Lending Analyst at Macquarie Funds Nancy De Liban EVP, Structured Products of Athene Asset Management Background: Senior MD & President at Countrywide Alternative Asset Management
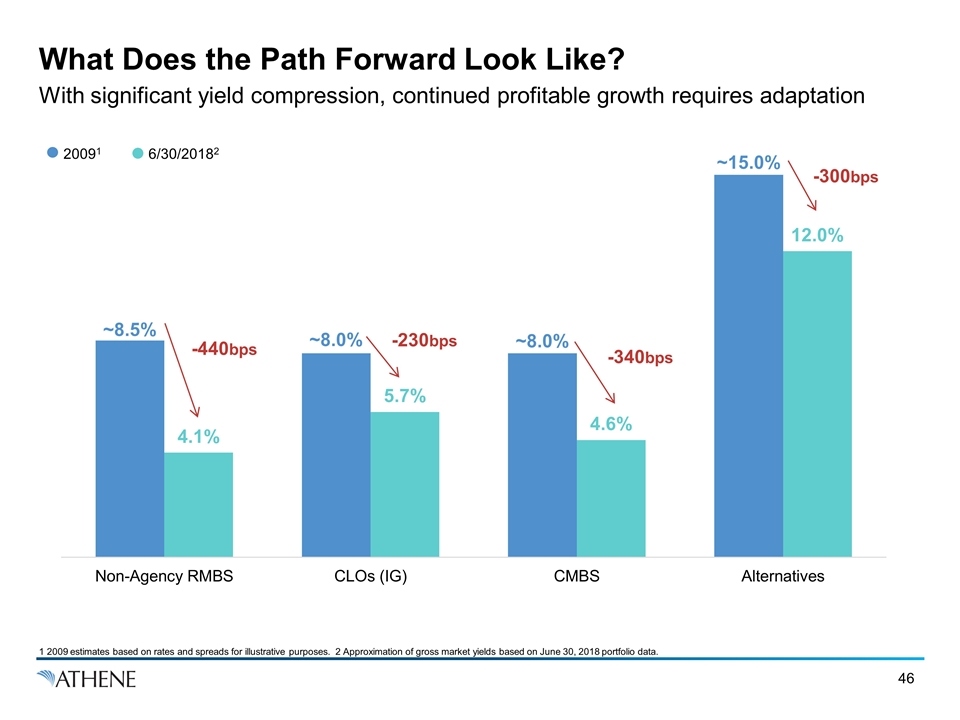
What Does the Path Forward Look Like? With significant yield compression, continued profitable growth requires adaptation 6/30/20182 20091 -440bps -230bps -340bps -300bps 1 2009 estimates based on rates and spreads for illustrative purposes. 2 Approximation of gross market yields based on June 30, 2018 portfolio data.
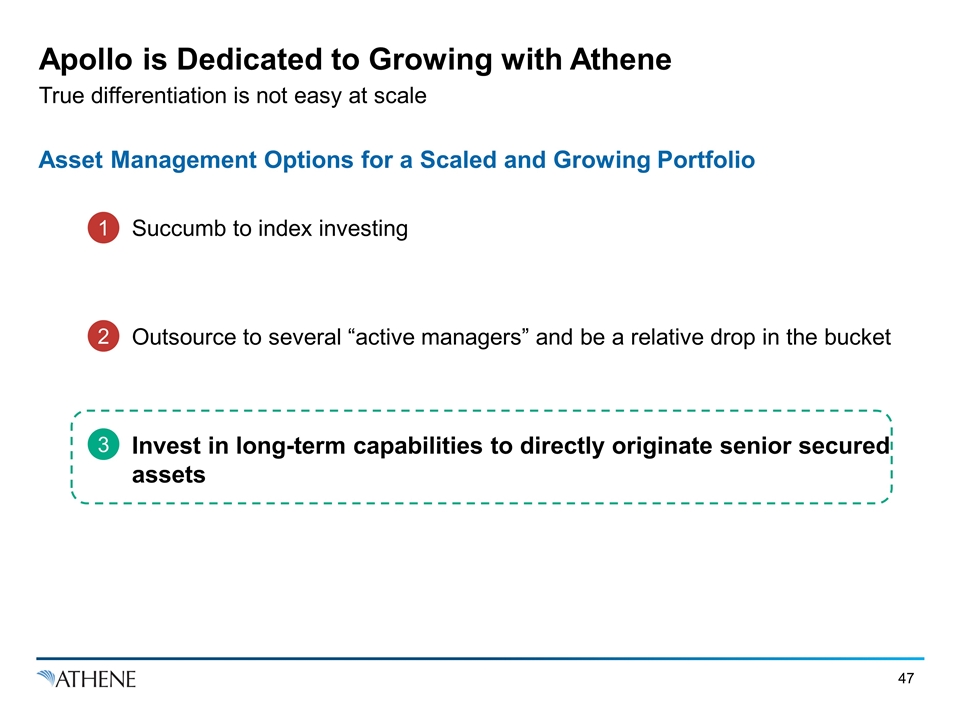
Apollo is Dedicated to Growing with Athene True differentiation is not easy at scale Asset Management Options for a Scaled and Growing Portfolio 1 Succumb to index investing 2 Outsource to several “active managers” and be a relative drop in the bucket 3 Invest in long-term capabilities to directly originate senior secured assets
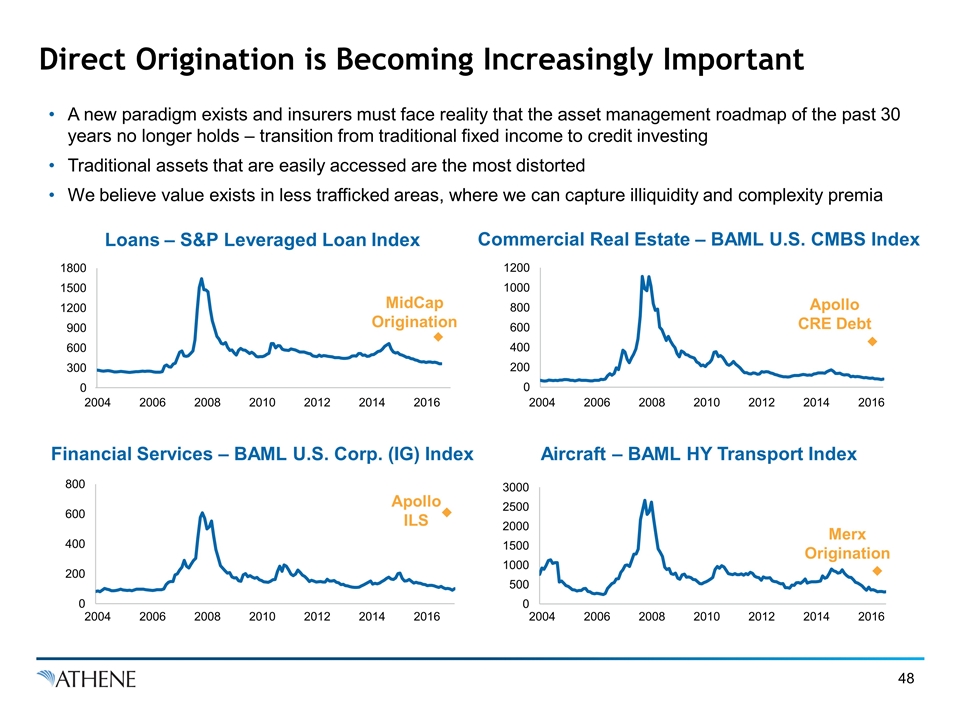
Direct Origination is Becoming Increasingly Important A new paradigm exists and insurers must face reality that the asset management roadmap of the past 30 years no longer holds – transition from traditional fixed income to credit investing Traditional assets that are easily accessed are the most distorted We believe value exists in less trafficked areas, where we can capture illiquidity and complexity premia Loans – S&P Leveraged Loan Index Commercial Real Estate – BAML U.S. CMBS Index Financial Services – BAML U.S. Corp. (IG) Index Aircraft – BAML HY Transport Index MidCap Origination Apollo CRE Debt 2004 2006 2008 2010 2012 2014 2016 Apollo ILS Merx Origination 2004 2006 2008 2010 2012 2014 2016 2004 2006 2008 2010 2012 2014 2016 2004 2006 2008 2010 2012 2014 2016
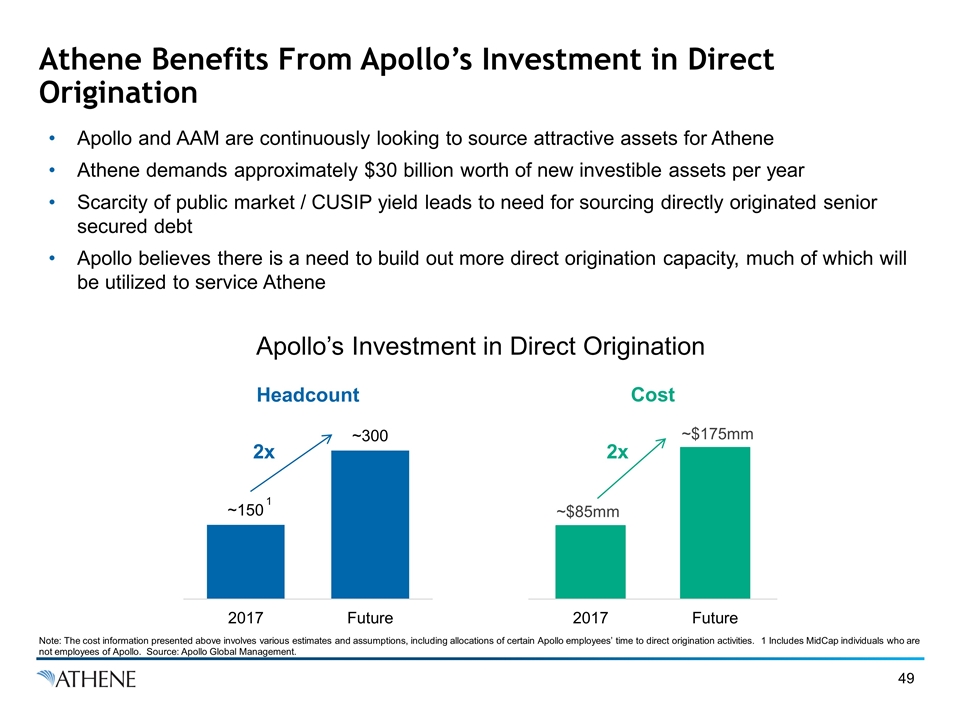
Athene Benefits From Apollo’s Investment in Direct Origination Apollo and AAM are continuously looking to source attractive assets for Athene Athene demands approximately $30 billion worth of new investible assets per year Scarcity of public market / CUSIP yield leads to need for sourcing directly originated senior secured debt Apollo believes there is a need to build out more direct origination capacity, much of which will be utilized to service Athene Apollo’s Investment in Direct Origination Headcount Cost 2x 2x Note: The cost information presented above involves various estimates and assumptions, including allocations of certain Apollo employees’ time to direct origination activities. 1 Includes MidCap individuals who are not employees of Apollo. Source: Apollo Global Management. 1
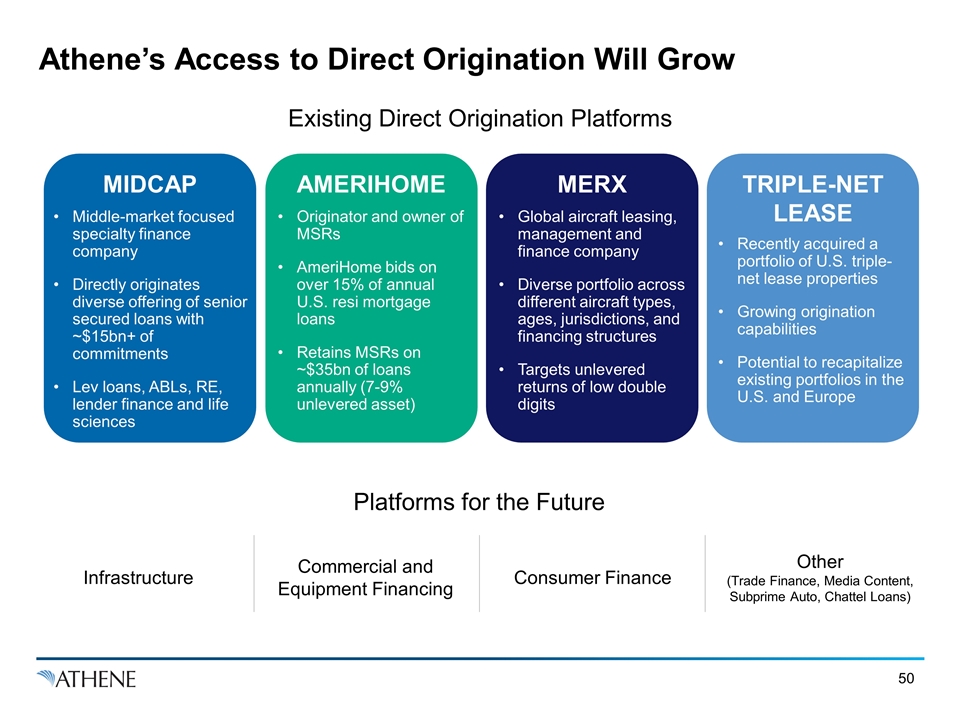
Athene’s Access to Direct Origination Will Grow MIDCAP AMERIHOME MERX TRIPLE-NET LEASE Existing Direct Origination Platforms Middle-market focused specialty finance company Directly originates diverse offering of senior secured loans with ~$15bn+ of commitments Lev loans, ABLs, RE, lender finance and life sciences Originator and owner of MSRs AmeriHome bids on over 15% of annual U.S. resi mortgage loans Retains MSRs on ~$35bn of loans annually (7-9% unlevered asset) Global aircraft leasing, management and finance company Diverse portfolio across different aircraft types, ages, jurisdictions, and financing structures Targets unlevered returns of low double digits Recently acquired a portfolio of U.S. triple-net lease properties Growing origination capabilities Potential to recapitalize existing portfolios in the U.S. and Europe Platforms for the Future Infrastructure Commercial and Equipment Financing Consumer Finance Other (Trade Finance, Media Content, Subprime Auto, Chattel Loans)
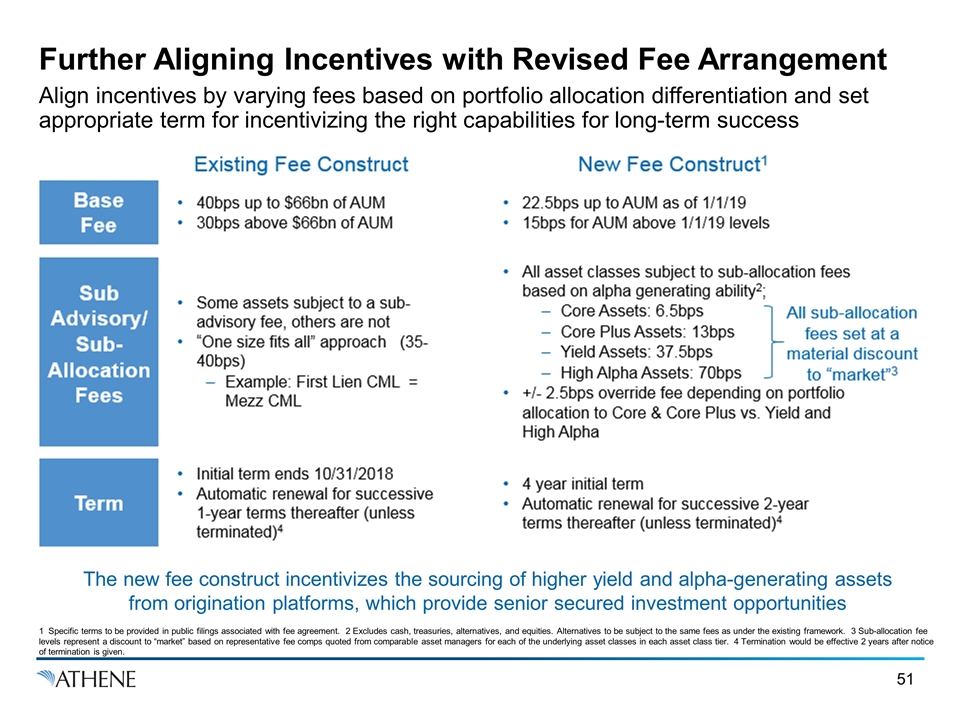
1 Specific terms to be provided in public filings associated with fee agreement. 2 Excludes cash, treasuries, alternatives, and equities. Alternatives to be subject to the same fees as under the existing framework. 3 Sub-allocation fee levels represent a discount to “market” based on representative fee comps quoted from comparable asset managers for each of the underlying asset classes in each asset class tier. 4 Termination would be effective 2 years after notice of termination is given. Further Aligning Incentives with Revised Fee Arrangement Align incentives by varying fees based on portfolio allocation differentiation and set appropriate term for incentivizing the right capabilities for long-term success The new fee construct incentivizes the sourcing of higher yield and alpha-generating assets from origination platforms, which provide senior secured investment opportunities
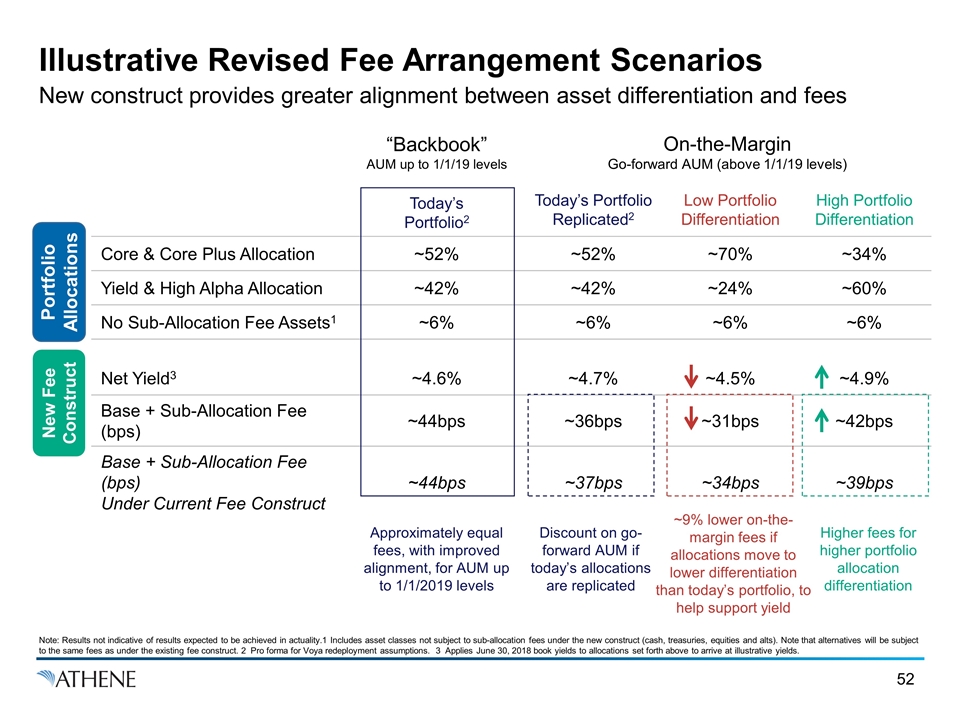
Illustrative Revised Fee Arrangement Scenarios New construct provides greater alignment between asset differentiation and fees “Backbook” AUM up to 1/1/19 levels On-the-Margin Go-forward AUM (above 1/1/19 levels) Today’s Portfolio2 Today’s Portfolio Replicated2 Low Portfolio Differentiation High Portfolio Differentiation Core & Core Plus Allocation ~52% ~52% ~70% ~34% Yield & High Alpha Allocation ~42% ~42% ~24% ~60% No Sub-Allocation Fee Assets1 ~6% ~6% ~6% ~6% Net Yield3 ~4.6% ~4.7% ~4.5% ~4.9% Base + Sub-Allocation Fee (bps) ~44bps ~36bps ~31bps ~42bps Base + Sub-Allocation Fee (bps) Under Current Fee Construct ~44bps ~37bps ~34bps ~39bps Note: Results not indicative of results expected to be achieved in actuality.1 Includes asset classes not subject to sub-allocation fees under the new construct (cash, treasuries, equities and alts). Note that alternatives will be subject to the same fees as under the existing fee construct. 2 Pro forma for Voya redeployment assumptions. 3 Applies June 30, 2018 book yields to allocations set forth above to arrive at illustrative yields. New Fee Construct Portfolio Allocations ~9% lower on-the-margin fees if allocations move to lower differentiation than today’s portfolio, to help support yield Approximately equal fees, with improved alignment, for AUM up to 1/1/2019 levels Discount on go-forward AUM if today’s allocations are replicated Higher fees for higher portfolio allocation differentiation

Credit Cycle Positioning & the Search for Alpha Jim Hassett
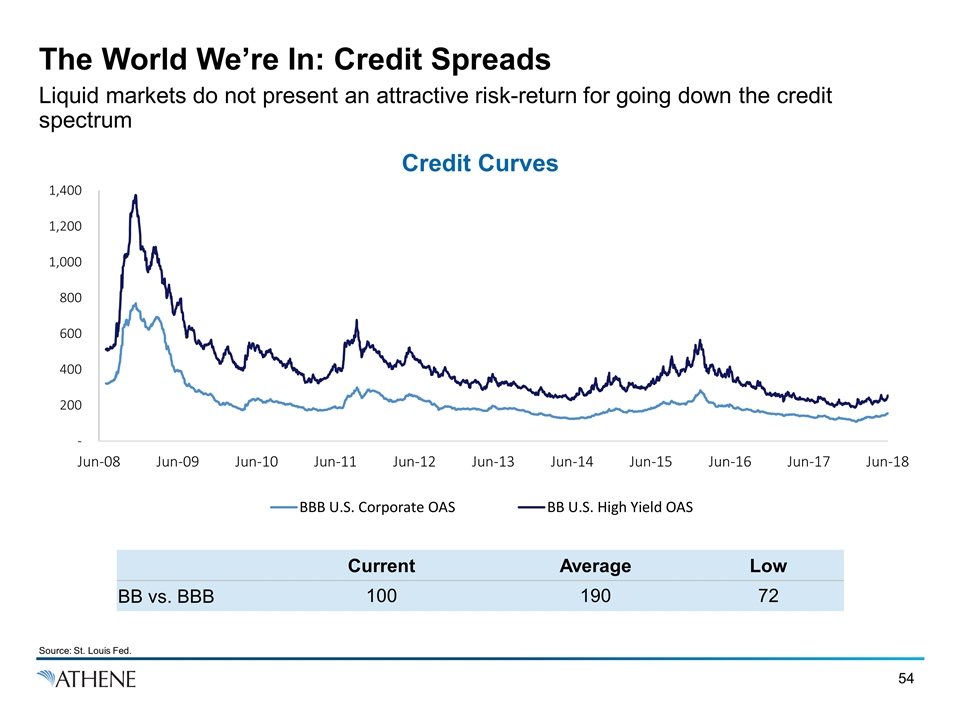
The World We’re In: Credit Spreads Liquid markets do not present an attractive risk-return for going down the credit spectrum Source: St. Louis Fed. Current Average Low BB vs. BBB 100 190 72 Credit Curves
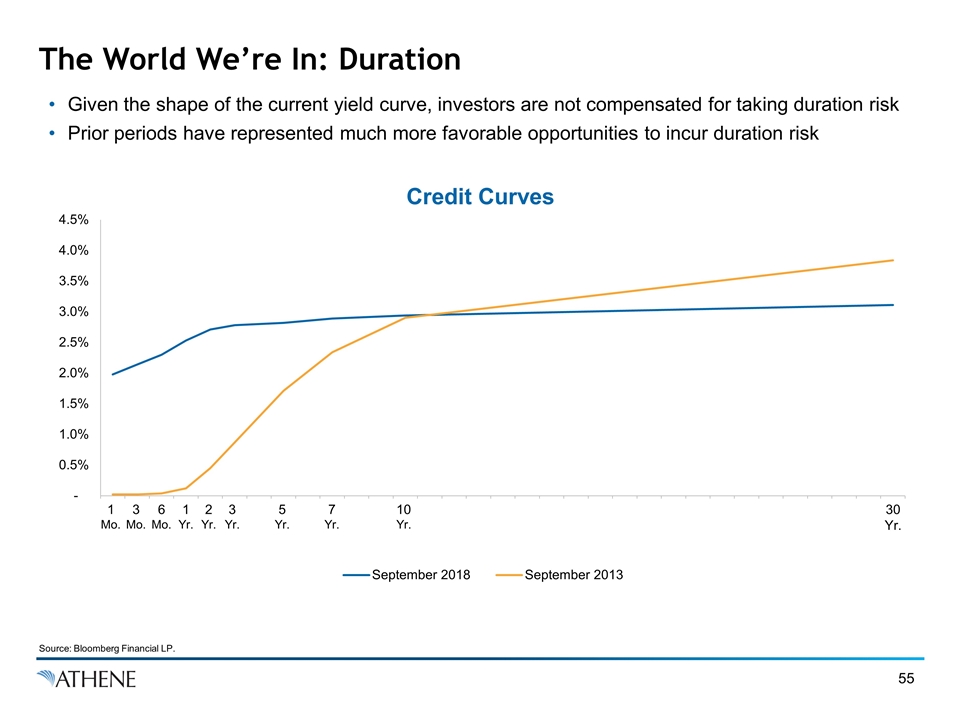
The World We’re In: Duration Given the shape of the current yield curve, investors are not compensated for taking duration risk Prior periods have represented much more favorable opportunities to incur duration risk Credit Curves 1 Mo. 3 Mo. 6 Mo. 1 Yr. 2 Yr. 3 Yr. 5 Yr. 7 Yr. 10 Yr. 30 Yr. Source: Bloomberg Financial LP.
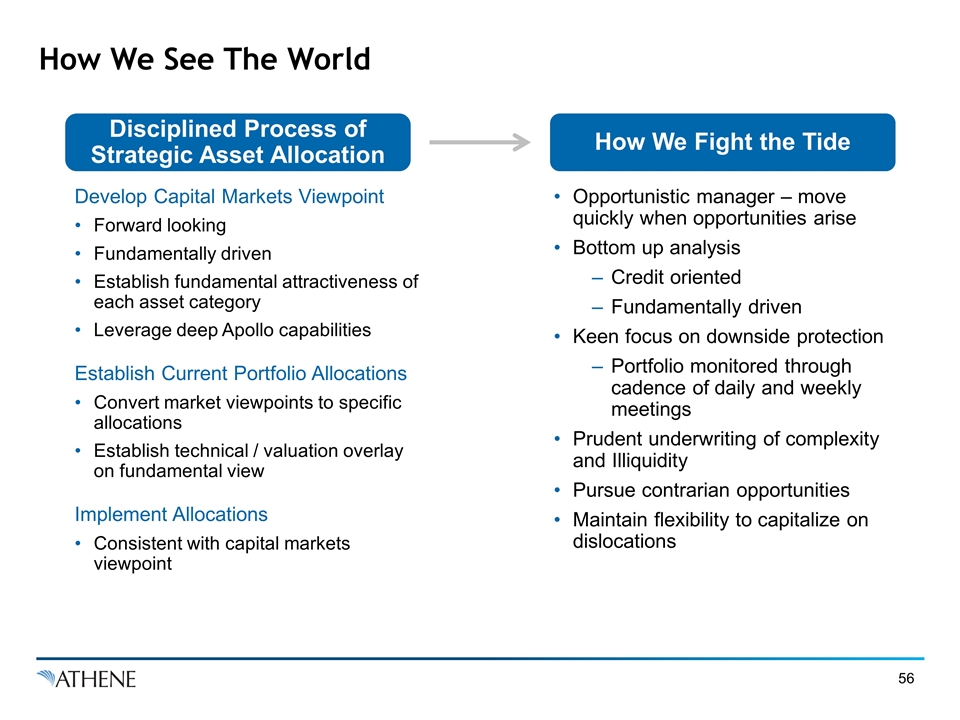
How We See The World Disciplined Process of Strategic Asset Allocation Develop Capital Markets Viewpoint Forward looking Fundamentally driven Establish fundamental attractiveness of each asset category Leverage deep Apollo capabilities Establish Current Portfolio Allocations Convert market viewpoints to specific allocations Establish technical / valuation overlay on fundamental view Implement Allocations Consistent with capital markets viewpoint How We Fight the Tide Opportunistic manager – move quickly when opportunities arise Bottom up analysis Credit oriented Fundamentally driven Keen focus on downside protection Portfolio monitored through cadence of daily and weekly meetings Prudent underwriting of complexity and Illiquidity Pursue contrarian opportunities Maintain flexibility to capitalize on dislocations
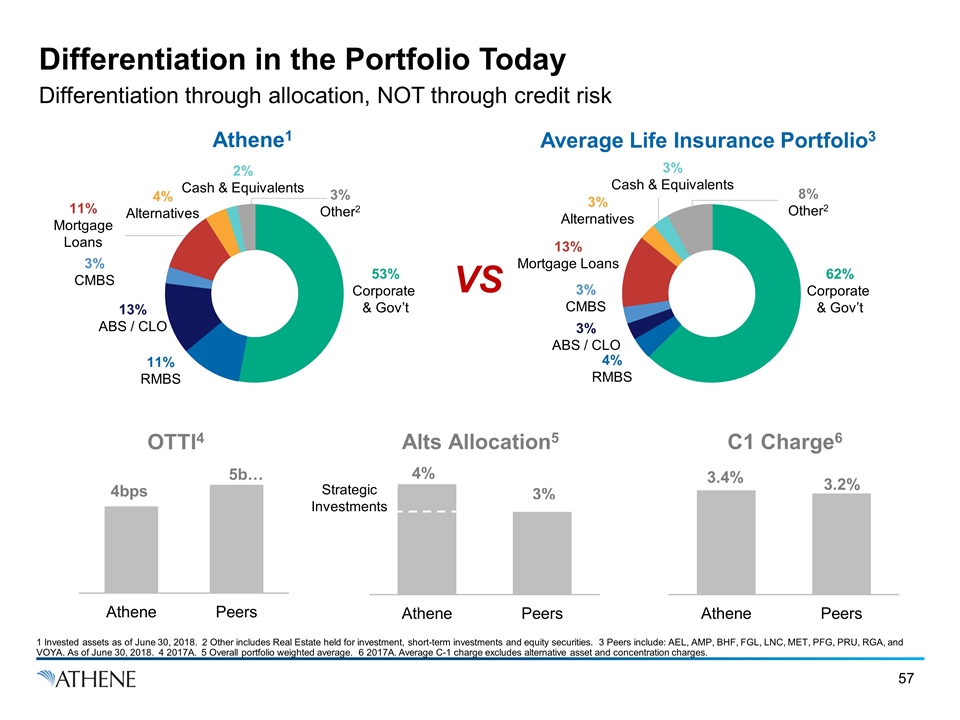
Differentiation in the Portfolio Today Differentiation through allocation, NOT through credit risk Average Life Insurance Portfolio3 Athene1 53% Corporate & Gov’t 62% Corporate & Gov’t 4% RMBS 11% RMBS 13% ABS / CLO 3% CMBS 3% CMBS 13% Mortgage Loans 3% Alternatives 3% Cash & Equivalents 2% Cash & Equivalents 4% Alternatives OTTI4 Alts Allocation5 C1 Charge6 1 Invested assets as of June 30, 2018. 2 Other includes Real Estate held for investment, short-term investments and equity securities. 3 Peers include: AEL, AMP, BHF, FGL, LNC, MET, PFG, PRU, RGA, and VOYA. As of June 30, 2018. 4 2017A. 5 Overall portfolio weighted average. 6 2017A. Average C-1 charge excludes alternative asset and concentration charges. 3% Other2 8% Other2 3% ABS / CLO 11% Mortgage Loans Strategic Investments VS
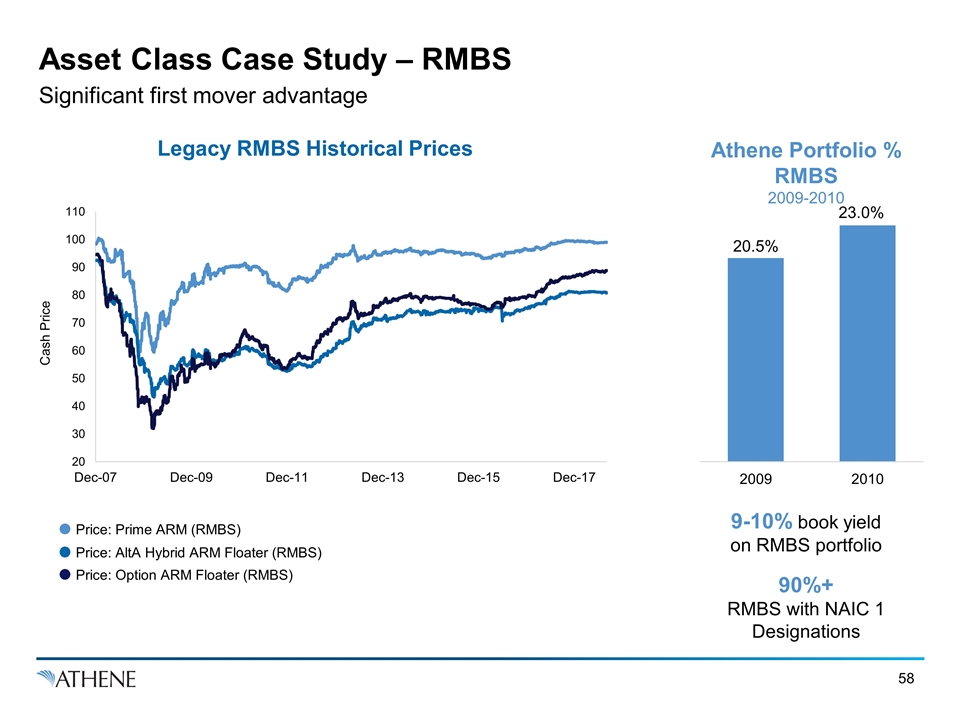
Asset Class Case Study – RMBS Significant first mover advantage Athene Portfolio % RMBS 2009-2010 9-10% book yield on RMBS portfolio 90%+ RMBS with NAIC 1 Designations Legacy RMBS Historical Prices Price: Prime ARM (RMBS) Price: AltA Hybrid ARM Floater (RMBS) Price: Option ARM Floater (RMBS)
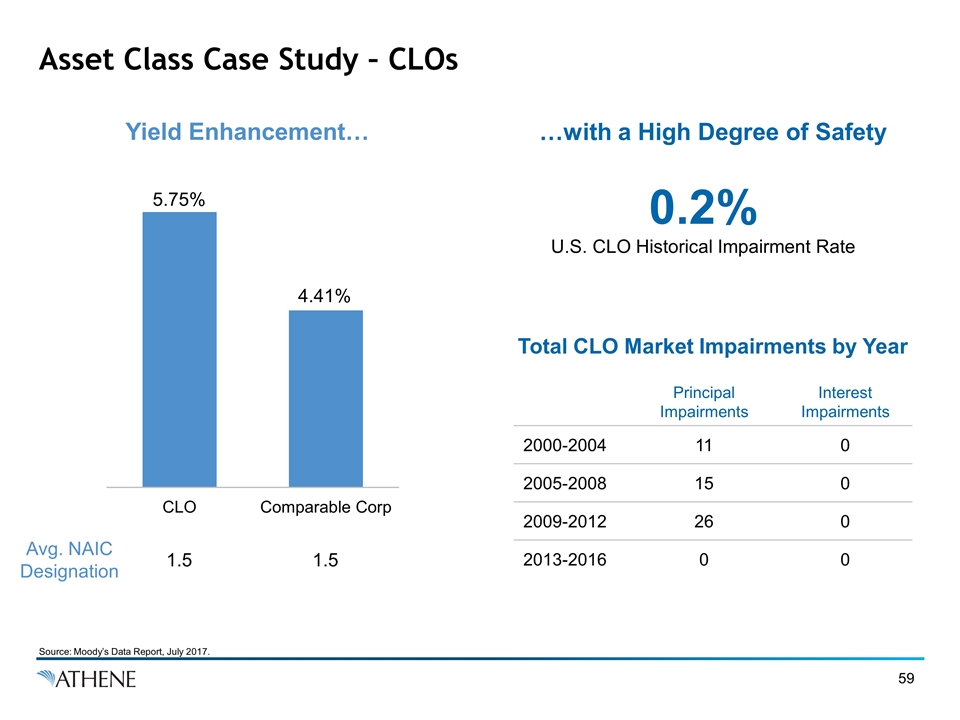
Asset Class Case Study – CLOs Source: Moody’s Data Report, July 2017. Yield Enhancement… …with a High Degree of Safety Avg. NAIC Designation 1.5 1.5 Principal Impairments Interest Impairments 2000-2004 11 0 2005-2008 15 0 2009-2012 26 0 2013-2016 0 0 Total CLO Market Impairments by Year 0.2% U.S. CLO Historical Impairment Rate
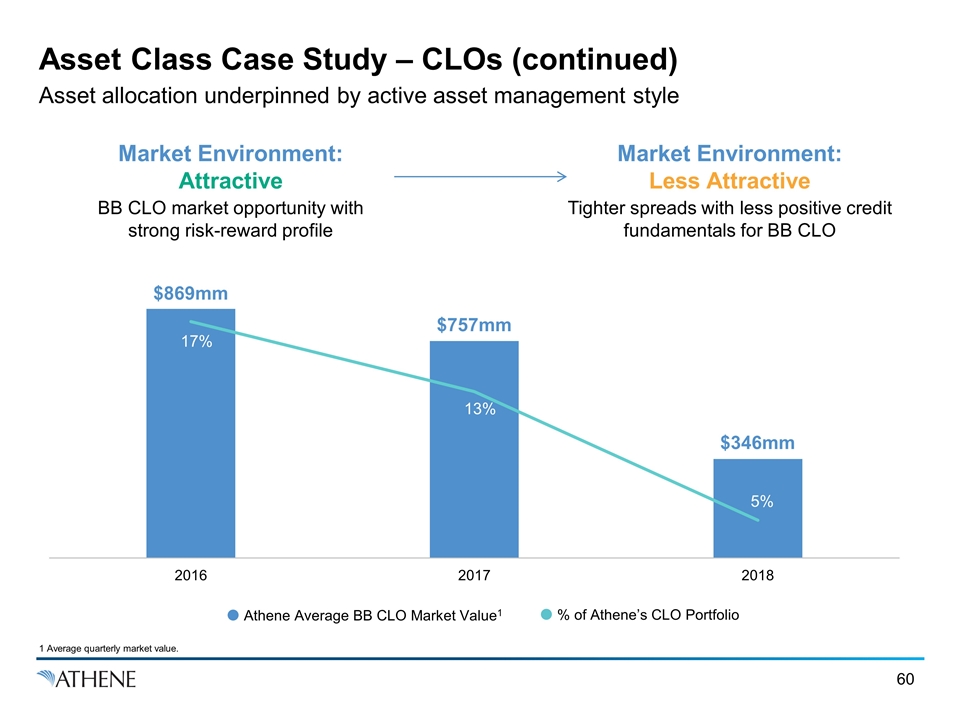
Asset Class Case Study – CLOs (continued) Asset allocation underpinned by active asset management style 1 Average quarterly market value. Tighter spreads with less positive credit fundamentals for BB CLO Market Environment: Less Attractive BB CLO market opportunity with strong risk-reward profile Market Environment: Attractive Athene Average BB CLO Market Value1 % of Athene’s CLO Portfolio
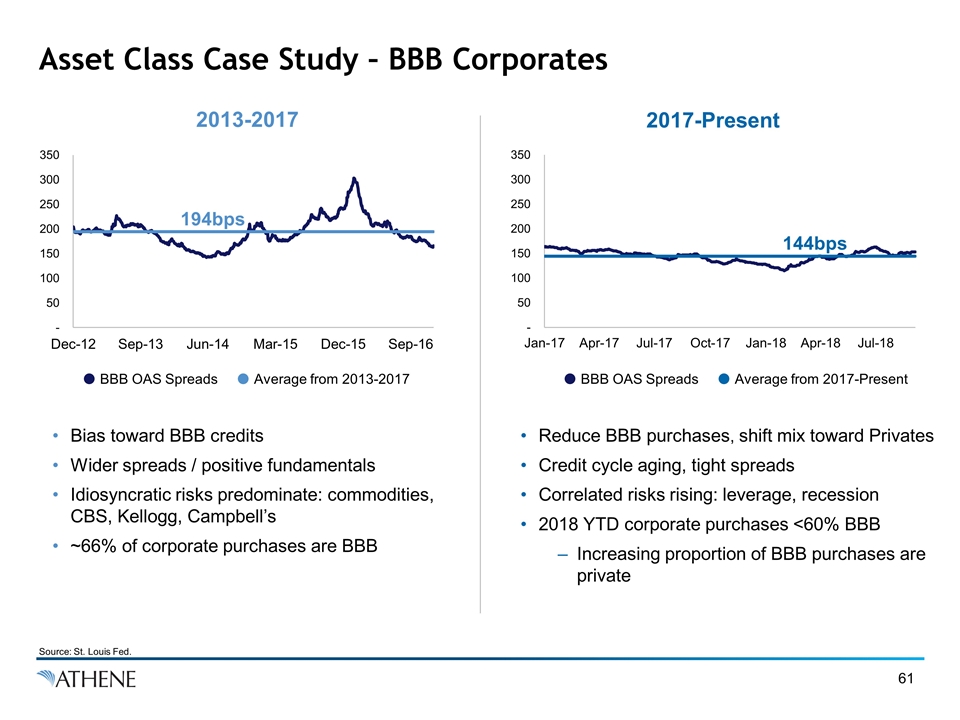
Asset Class Case Study – BBB Corporates 2013-2017 2017-Present Source: St. Louis Fed. BBB OAS Spreads Average from 2013-2017 BBB OAS Spreads Average from 2017-Present Bias toward BBB credits Wider spreads / positive fundamentals Idiosyncratic risks predominate: commodities, CBS, Kellogg, Campbell’s ~66% of corporate purchases are BBB Reduce BBB purchases, shift mix toward Privates Credit cycle aging, tight spreads Correlated risks rising: leverage, recession 2018 YTD corporate purchases <60% BBB Increasing proportion of BBB purchases are private
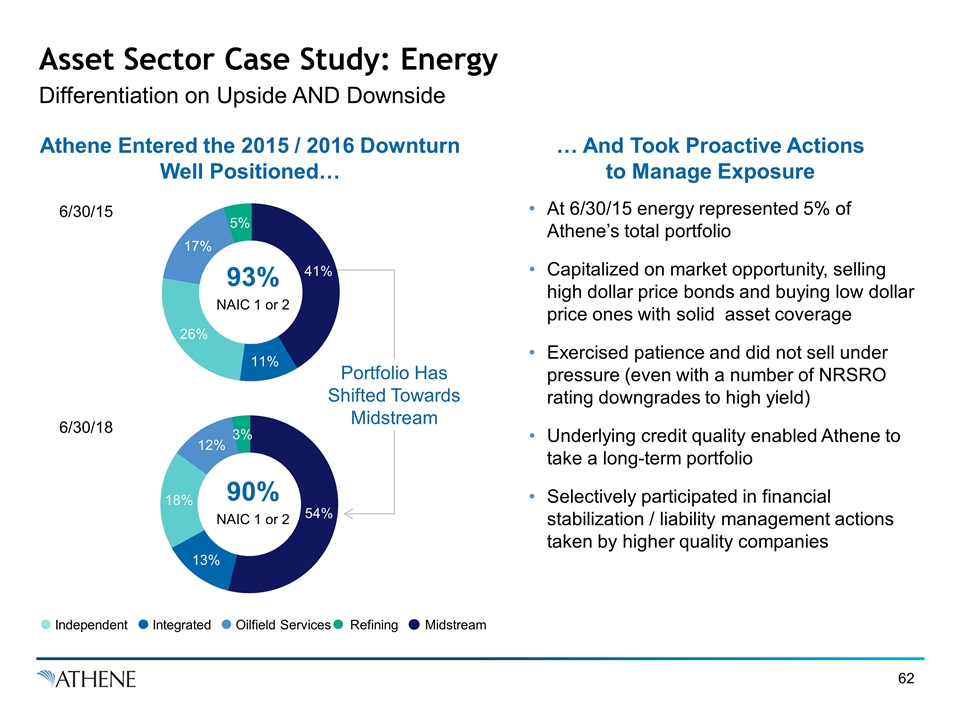
Asset Sector Case Study: Energy Athene Entered the 2015 / 2016 Downturn Well Positioned… … And Took Proactive Actions to Manage Exposure Differentiation on Upside AND Downside Integrated Independent Midstream Oilfield Services Refining Portfolio Has Shifted Towards Midstream 93% NAIC 1 or 2 At 6/30/15 energy represented 5% of Athene’s total portfolio Capitalized on market opportunity, selling high dollar price bonds and buying low dollar price ones with solid asset coverage Exercised patience and did not sell under pressure (even with a number of NRSRO rating downgrades to high yield) Underlying credit quality enabled Athene to take a long-term portfolio Selectively participated in financial stabilization / liability management actions taken by higher quality companies 90% NAIC 1 or 2 6/30/15 6/30/18
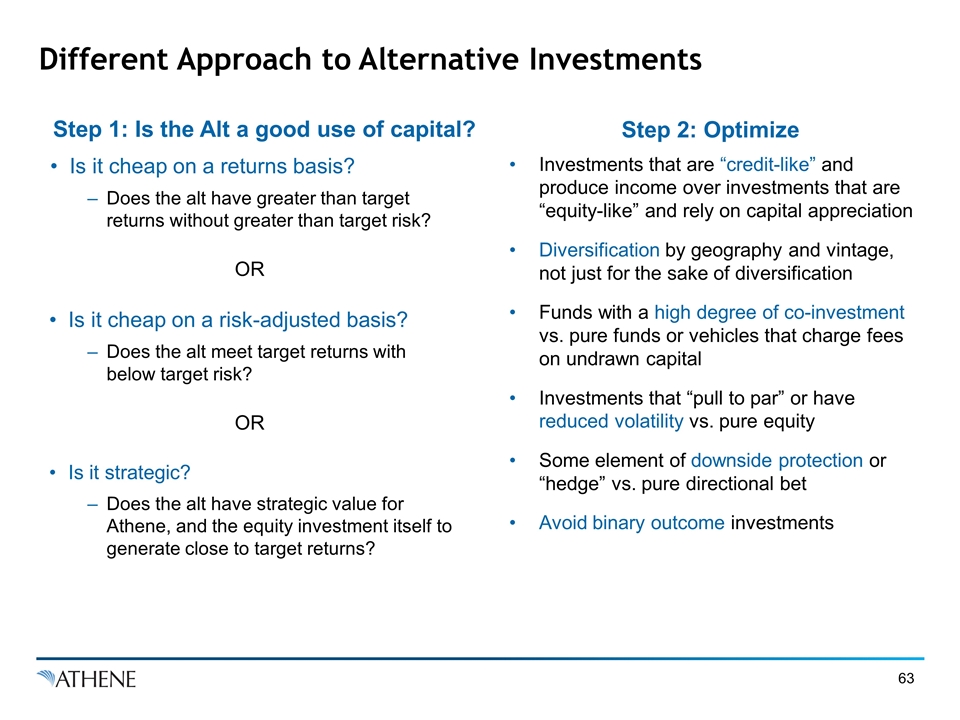
Different Approach to Alternative Investments Step 1: Is the Alt a good use of capital? Step 2: Optimize Is it cheap on a returns basis? Does the alt have greater than target returns without greater than target risk? OR Is it cheap on a risk-adjusted basis? Does the alt meet target returns with below target risk? OR Is it strategic? Does the alt have strategic value for Athene, and the equity investment itself to generate close to target returns? Investments that are “credit-like” and produce income over investments that are “equity-like” and rely on capital appreciation Diversification by geography and vintage, not just for the sake of diversification Funds with a high degree of co-investment vs. pure funds or vehicles that charge fees on undrawn capital Investments that “pull to par” or have reduced volatility vs. pure equity Some element of downside protection or “hedge” vs. pure directional bet Avoid binary outcome investments
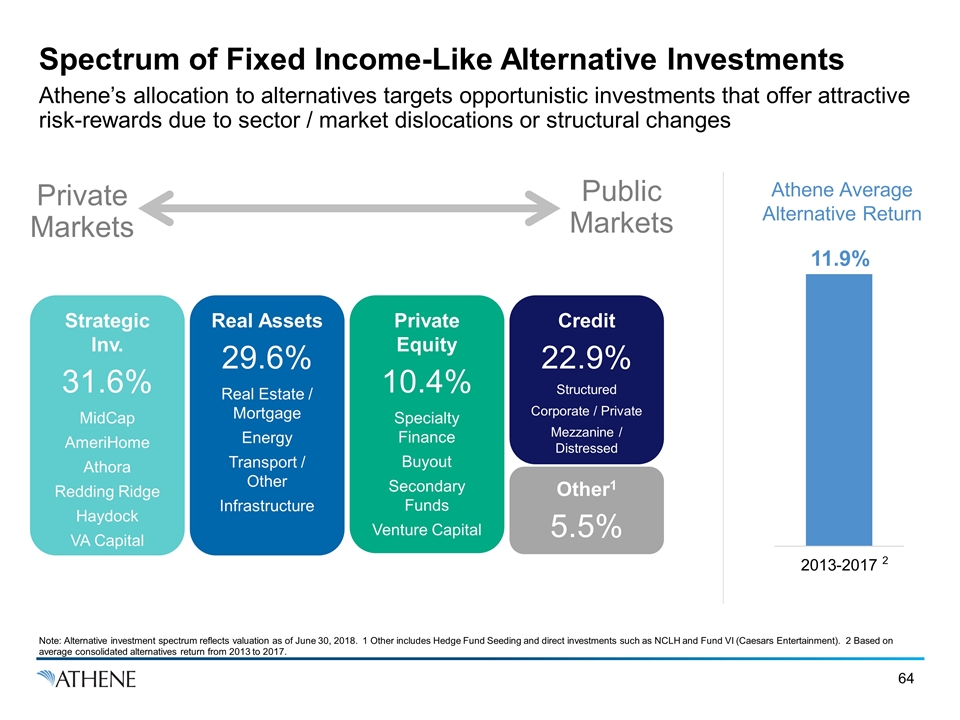
Spectrum of Fixed Income-Like Alternative Investments Athene’s allocation to alternatives targets opportunistic investments that offer attractive risk-rewards due to sector / market dislocations or structural changes Athene Average Alternative Return Strategic Inv. 31.6% MidCap AmeriHome Athora Redding Ridge Haydock VA Capital Real Assets 29.6% Real Estate / Mortgage Energy Transport / Other Infrastructure Private Equity 10.4% Specialty Finance Buyout Secondary Funds Venture Capital Credit 22.9% Structured Corporate / Private Mezzanine / Distressed Other1 5.5% Private Markets Public Markets Note: Alternative investment spectrum reflects valuation as of June 30, 2018. 1 Other includes Hedge Fund Seeding and direct investments such as NCLH and Fund VI (Caesars Entertainment). 2 Based on average consolidated alternatives return from 2013 to 2017. 2
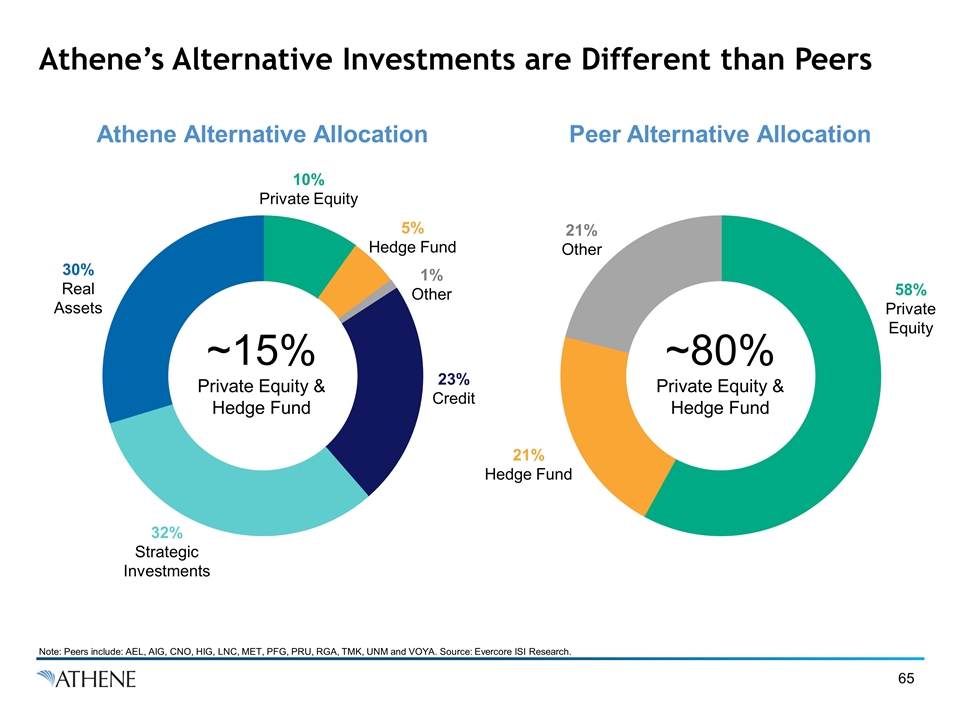
Athene’s Alternative Investments are Different than Peers Note: Peers include: AEL, AIG, CNO, HIG, LNC, MET, PFG, PRU, RGA, TMK, UNM and VOYA. Source: Evercore ISI Research. Athene Alternative Allocation Peer Alternative Allocation 32% Strategic Investments 58% Private Equity 5% Hedge Fund 30% Real Assets 23% Credit 21% Hedge Fund 10% Private Equity 1% Other 21% Other ~15% Private Equity & Hedge Fund ~80% Private Equity & Hedge Fund
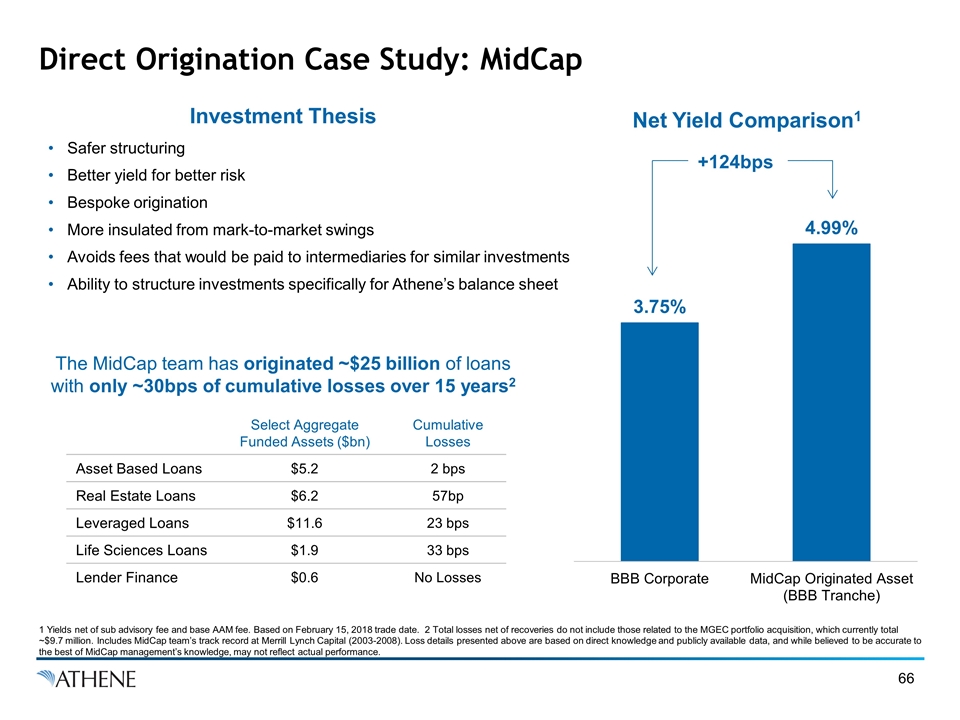
Direct Origination Case Study: MidCap 1 Yields net of sub advisory fee and base AAM fee. Based on February 15, 2018 trade date. 2 Total losses net of recoveries do not include those related to the MGEC portfolio acquisition, which currently total ~$9.7 million. Includes MidCap team’s track record at Merrill Lynch Capital (2003-2008). Loss details presented above are based on direct knowledge and publicly available data, and while believed to be accurate to the best of MidCap management’s knowledge, may not reflect actual performance. +124bps Net Yield Comparison1 Investment Thesis Safer structuring Better yield for better risk Bespoke origination More insulated from mark-to-market swings Avoids fees that would be paid to intermediaries for similar investments Ability to structure investments specifically for Athene’s balance sheet The MidCap team has originated ~$25 billion of loans with only ~30bps of cumulative losses over 15 years2 Select Aggregate Funded Assets ($bn) Cumulative Losses Asset Based Loans $5.2 2 bps Real Estate Loans $6.2 57bp Leveraged Loans $11.6 23 bps Life Sciences Loans $1.9 33 bps Lender Finance $0.6 No Losses
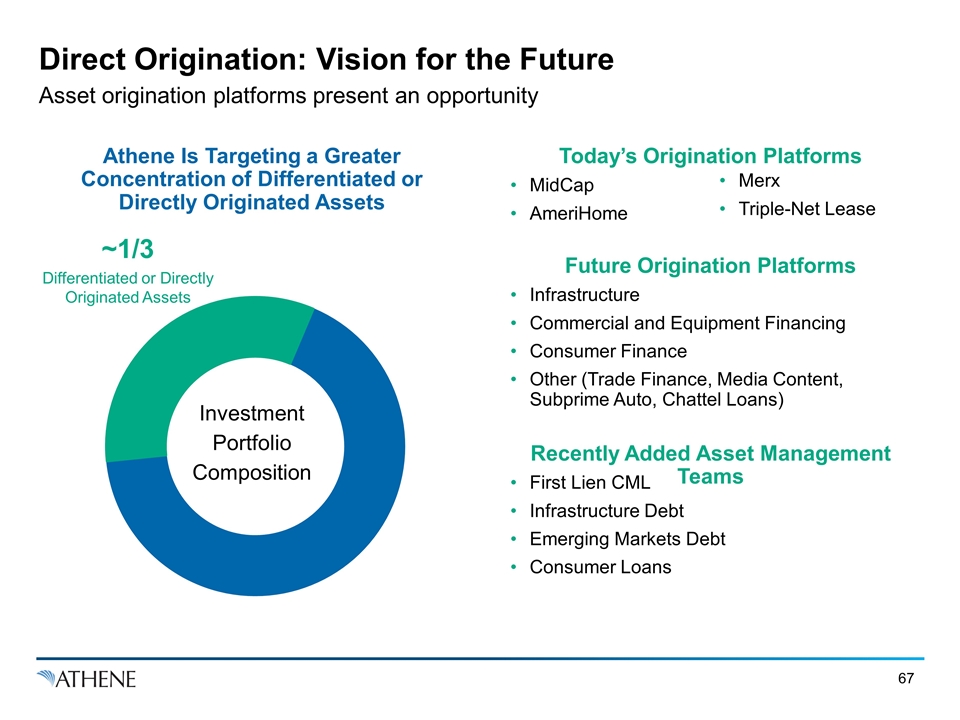
Direct Origination: Vision for the Future Asset origination platforms present an opportunity Athene Is Targeting a Greater Concentration of Differentiated or Directly Originated Assets Today’s Origination Platforms MidCap AmeriHome Future Origination Platforms Infrastructure Commercial and Equipment Financing Consumer Finance Other (Trade Finance, Media Content, Subprime Auto, Chattel Loans) Investment Portfolio Composition ~1/3 Differentiated or Directly Originated Assets Merx Triple-Net Lease Recently Added Asset Management Teams First Lien CML Infrastructure Debt Emerging Markets Debt Consumer Loans
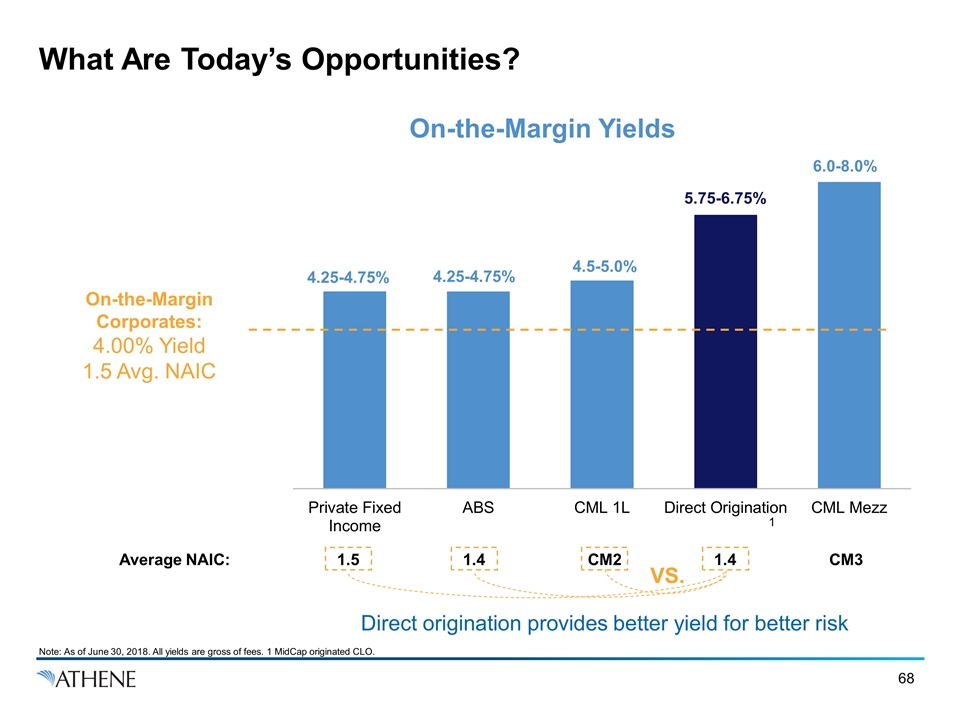
What Are Today’s Opportunities? On-the-Margin Yields 4.25-4.75% 4.25-4.75% 4.5-5.0% 6.0-8.0% 5.75-6.75% On-the-Margin Corporates: 4.00% Yield 1.5 Avg. NAIC Average NAIC: 1.5 1.4 CM2 1.4 CM3 1 Note: As of June 30, 2018. All yields are gross of fees. 1 MidCap originated CLO. Direct origination provides better yield for better risk VS.
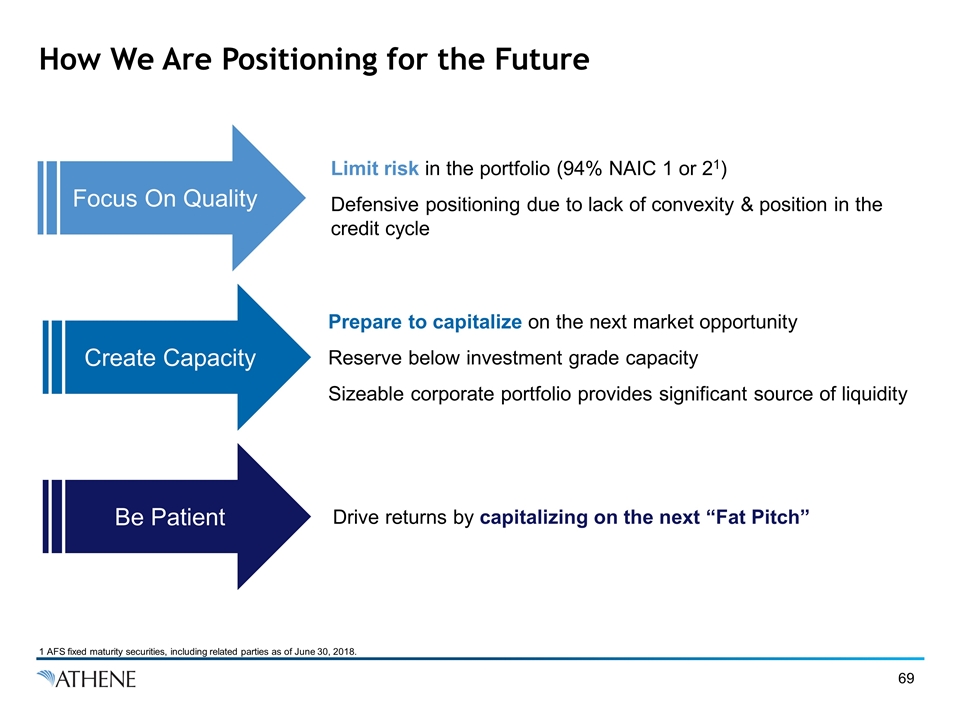
How We Are Positioning for the Future Focus On Quality Create Capacity Be Patient Limit risk in the portfolio (94% NAIC 1 or 21) Defensive positioning due to lack of convexity & position in the credit cycle Prepare to capitalize on the next market opportunity Reserve below investment grade capacity Sizeable corporate portfolio provides significant source of liquidity Drive returns by capitalizing on the next “Fat Pitch” 1 AFS fixed maturity securities, including related parties as of June 30, 2018.

Liquidity & Risk Considerations Core to Underwriting Nancy De Liban
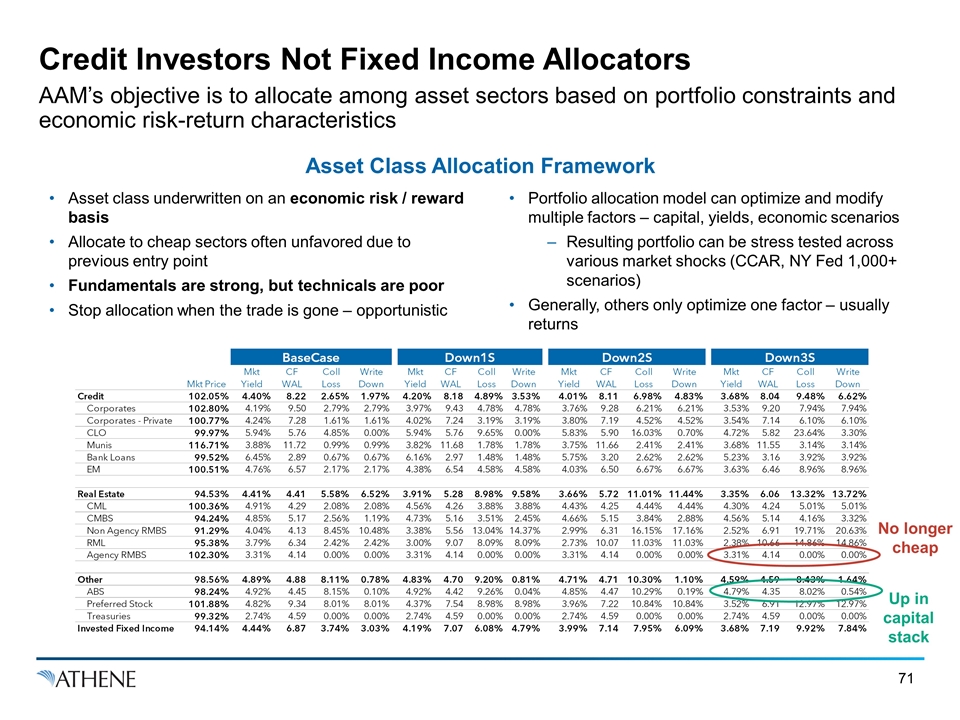
Credit Investors Not Fixed Income Allocators AAM’s objective is to allocate among asset sectors based on portfolio constraints and economic risk-return characteristics Asset Class Allocation Framework Asset class underwritten on an economic risk / reward basis Allocate to cheap sectors often unfavored due to previous entry point Fundamentals are strong, but technicals are poor Stop allocation when the trade is gone – opportunistic Portfolio allocation model can optimize and modify multiple factors – capital, yields, economic scenarios Resulting portfolio can be stress tested across various market shocks (CCAR, NY Fed 1,000+ scenarios) Generally, others only optimize one factor – usually returns No longer cheap Up in capital stack BaseCase Down1S Down2S Down3S Mkt Price Mkt Yield CFWAL Coll Loss Write Down Mkt Yield CF WAL Coll Loss Write Down Mkt Yield CF WAL Coll Loss Write Down Mkt Yield CF WAL Coll Loss Write Down Credit 1.0205059539772279 4.4036138394577158E-2 8.224050083525885 2.6502905166399953E-2 1.9697980994134549E-2 4.2049218490176961E-2 8.1772327471812964 4.8873571056120453E-2 3.53246525867933E-2 4.0095800695532778E-2 8.1050734115629783 6.9799286713054104E-2 4.827982554431582E-2 3.6759546330262419E-2 8.0388884294905001 9.4810313171260457E-2 6.6248722603522478E-2 Corporates 1.0280177100977412 4.1883239368564376E-2 9.4979050885024066 2.7884554202111937E-2 2.7884554202111937E-2 3.9664699869793062E-2 9.4293727525881721 4.7820835529466886E-2 4.7820835529466886E-2 3.7647528318246387E-2 9.2752294921793244 6.2123093785225597E-2 6.2123093785225597E-2 3.5274451200022094E-2 9.2023392832306143 7.940125175776902E-2 7.940125175776902E-2 Corporates - Private 1.0077457361645628 4.2443551033325366E-2 7.2815966309763169 1.6103270724464616E-2 1.6103270724464616E-2 4.0188387471486918E-2 7.243003685544843 3.1943474862077229E-2 3.1943474862077229E-2 3.8037468623323634E-2 7.18695442308724 4.5179679471187624E-2 4.5179679471187624E-2 3.5409789593591194E-2 7.1393205632457049 6.1007449642599826E-2 6.1007449642599826E-2 CLO 0.99965299908146621 5.9428051904169971E-2 5.7637394794270858 4.8463710847050596E-2 0 5.9401461465038691E-2 5.7577559437110377 9.649348771055076E-2 0 5.8318505476852849E-2 5.8987136471402026 0.16027342909950248 7.0148596775819584E-3 4.7237479869828861E-2 5.8206392920733663 0.23643048994068322 3.3018867479369864E-2 Munis 1.1671023656000286 3.8848068586910423E-2 11.717663071751154 9.9275213815418987E-3 9.9275213815418987E-3 3.8174729224581545E-2 11.683848166234501 1.7766751794380378E-2 1.7766751794380378E-2 3.7543741854955778E-2 11.656452504332346 2.4073841733505255E-2 2.4073841733505255E-2 3.6810848777795557E-2 11.554034995735863 3.1449798267054026E-2 3.1449798267054026E-2 Bank Loans 0.9951893661882325 6.4515571644605488E-2 2.8942440454157721 6.6801898133944902E-3 6.6801898133944902E-3 6.1573117232439467E-2 2.9705220318424042 1.4785705603608434E-2 1.4785705603608434E-2 5.7494369208612055E-2 3.2011157426349786 2.6172082632955625E-2 2.6172082632955625E-2 5.2334110350702942E-2 3.1588102764725972 3.9245492089760158E-2 3.9245492089760158E-2 EM 1.0050781459273033 4.7562384942601142E-2 6.5736395256614086 2.168828520467125E-2 2.168828520467125E-2 4.3819574957875557E-2 6.5413699611356533 4.5803983541865122E-2 4.5803983541865122E-2 4.0337914045302146E-2 6.5033533315652639 6.6710968338137097E-2 6.6710968338137097E-2 3.6346535226758465E-2 6.4573744450496182 8.9599329673501593E-2 8.9599329673501593E-2 Real Estate 0.94525518690101074 4.4062932482882032E-2 4.4073370344068321 5.5817360626544958E-2 6.5235454823094188E-2 3.9088461143155812E-2 5.2805226193897266 8.9814784315529778E-2 9.5794816613623809E-2 3.65718400486231E-2 5.7193580140190647 0.11007028050460327 0.11443328868091339 3.3527391973629944E-2 6.0593030370971404 0.13321001992054707 0.13724496197104133 CML 1.0035506230456583 4.9071951701398768E-2 4.2876467548434603 2.084878507927411E-2 2.084878507927411E-2 4.5594669956732767E-2 4.2580452227857197 3.8833286345557008E-2 3.8833286345557008E-2 4.432993666479914E-2 4.2497359870506228 4.4449526128978692E-2 4.4449526128978692E-2 4.3024146463154833E-2 4.239719986715131 5.010802131681414E-2 5.010802131681414E-2 CMBS 0.94238709080257721 4.8529544541914611E-2 5.1728485080154512 2.5560061372158837E-2 1.1916527363301233E-2 4.7334816142268844E-2 5.1615676430316819 3.5093224340227352E-2 2.4542843876298775E-2 4.663412362466704E-2 5.1533506659555517 3.8353270304638615E-2 2.8767909756147354E-2 4.5642291489142631E-2 5.1435607464276751 4.1635968049719307E-2 3.3214421507897773E-2 Non Agency RMBS 0.91285960702241109 4.0446321171639765E-2 4.1279335714103835 8.4485816254380758E-2 0.1048054313728313 3.3771620307146734E-2 5.558608938999364 0.13044268985310989 0.14374127359726993 2.9917325261610665E-2 6.3106285975417187 0.16151096500769305 0.1716102684629873 2.5186473192272293E-2 6.9137313660855479 0.19707437706511319 0.20632118207887173 RML 0.95382755460823898 3.7890917727725834E-2 6.336577215102067 2.4167662218829954E-2 2.4167662218829954E-2 2.9981038048530771E-2 9.0727028235656419 8.091927548188721E-2 8.091927548188721E-2 2.7277757289508639E-2 10.072133598194306 0.11034967817790614 0.11034967817790614 2.3751520662507079E-2 10.663932325766854 0.14864747693383493 0.14864747693383493 Agency RMBS 1.0230120874207431 3.3103231804260017E-2 4.1382564229013843 0 0 3.3103231804260017E-2 4.1382564229013843 0 0 3.310323180426003E-2 4.1382564229013843 0 0 3.3103231804260023E-2 4.1382564229013834 0 0 Other 0.98556557560790548 4.8948216873690373E-2 4.8810448333591214 8.1062026195244913E-2 7.8092196295935432E-3 4.8316427241150366E-2 4.7022125631412921 9.2020481812086746E-2 8.0711019733309061E-3 4.7145919673016803E-2 4.710154408065061 0.10301568455149716 1.1015529772152454E-2 4.5851163283933856E-2 4.5885169641112196 8.4331507589549937E-2 1.6433914621117339E-2 ABS 0.98239475842707746 4.9180761149531661E-2 4.4454197618604496 8.1480450477618108E-2 1.0075966854662234E-3 4.9220019141434132E-2 4.4245820474979691 9.259587610958081E-2 3.7215818757305505E-4 4.8547880141858728E-2 4.4650126964325381 0.10292389926959913 1.8558944856691387E-3 4.7850857275875638E-2 4.3530034095992196 8.0240930552983036E-2 5.4093408810214271E-3 Preferred Stock 1.0187798618820705 4.8165122263151484E-2 9.3363666037368187 8.0084945789013678E-2 8.0084945789013678E-2 4.3671935488469621E-2 7.5386303091439864 8.9849291131603129E-2 8.9849291131603129E-2 3.9615791568601309E-2 7.2155276303263864 0.10836930674801859 0.10836930674801859 3.5174388039470962E-2 6.9056727683145143 0.12967835984607975 0.12967835984607975 Treasuries 0.99319789291907257 2.740142091456485E-2 4.5891846770977196 0 0 2.740142091456485E-2 4.5891846770977196 0 0 2.7401420914564857E-2 4.5891846770977205 0 0 2.740142091456485E-2 4.5891846770977214 0 0 Invested Fixed Income 0.94135124088551247 4.4365249327363188E-2 6.8657624566346422 3.7378956168166437E-2 3.0283439202619559E-2 4.1920972636095975E-2 7.0654255392224714 6.0782891391328961E-2 4.7947868327491976E-2 3.992118848957564E-2 7.1429584234571761 7.9521565902304484E-2 6.0943077952408921E-2 3.6759330190258281E-2 7.192894999355893 9.9166499808630279E-2 7.83802050688472E-2
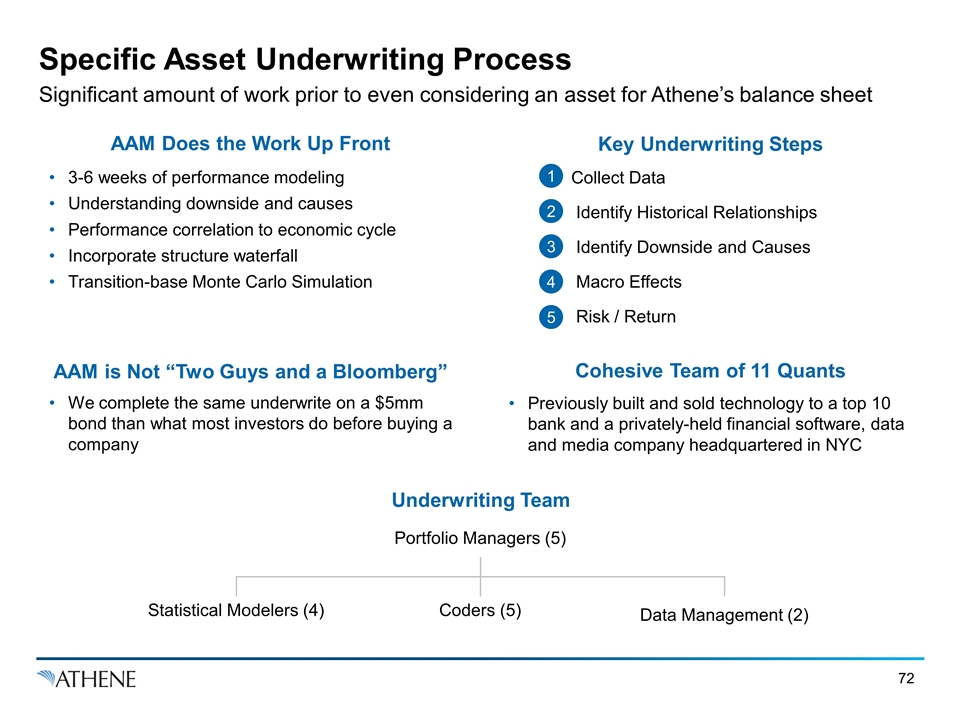
Specific Asset Underwriting Process Significant amount of work prior to even considering an asset for Athene’s balance sheet AAM Does the Work Up Front Key Underwriting Steps 3-6 weeks of performance modeling Understanding downside and causes Performance correlation to economic cycle Incorporate structure waterfall Transition-base Monte Carlo Simulation AAM is Not “Two Guys and a Bloomberg” We complete the same underwrite on a $5mm bond than what most investors do before buying a company Cohesive Team of 11 Quants Previously built and sold technology to a top 10 bank and a privately-held financial software, data and media company headquartered in NYC 1 2 4 3 5 Underwriting Team Collect Data Identify Historical Relationships Identify Downside and Causes Macro Effects Risk / Return Portfolio Managers (5) Statistical Modelers (4) Coders (5) Data Management (2)
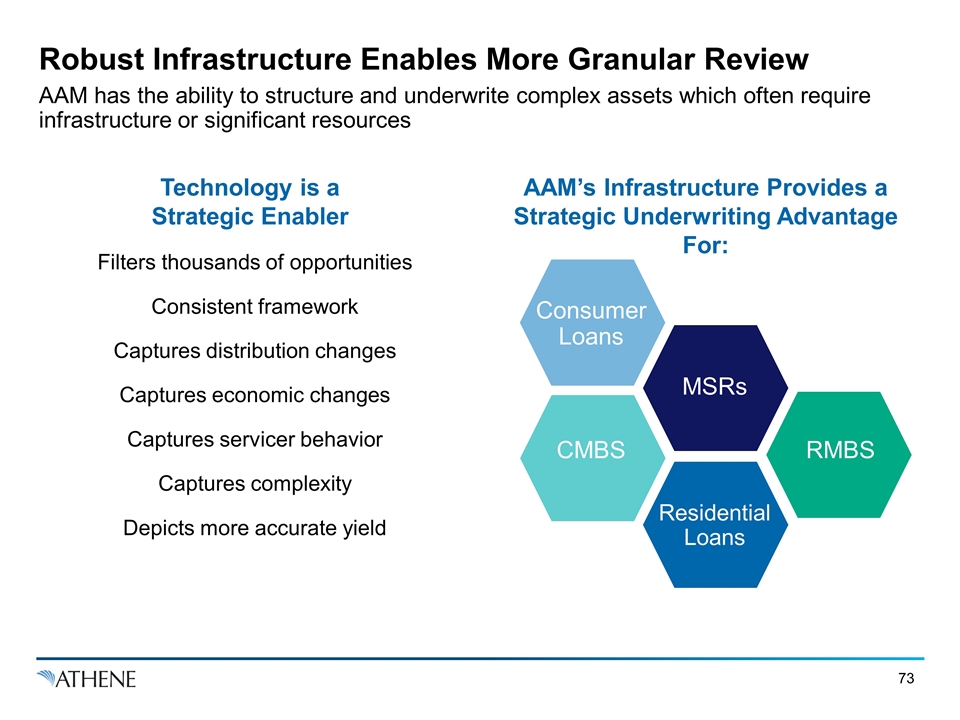
Robust Infrastructure Enables More Granular Review AAM has the ability to structure and underwrite complex assets which often require infrastructure or significant resources Technology is a Strategic Enabler AAM’s Infrastructure Provides a Strategic Underwriting Advantage For: Filters thousands of opportunities Consistent framework Captures distribution changes Captures economic changes Captures servicer behavior Captures complexity Depicts more accurate yield Consumer Loans Residential Loans RMBS CMBS MSRs
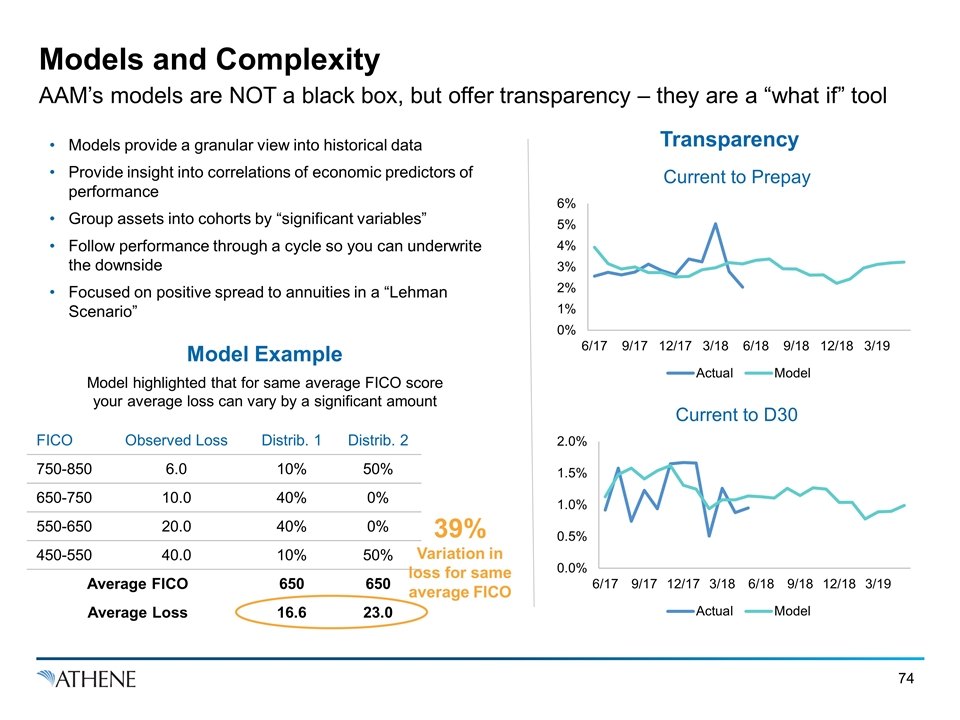
Models and Complexity AAM’s models are NOT a black box, but offer transparency – they are a “what if” tool Transparency Model Example FICO Observed Loss Distrib. 1 Distrib. 2 750-850 6.0 10% 50% 650-750 10.0 40% 0% 550-650 20.0 40% 0% 450-550 40.0 10% 50% Average FICO 650 650 Average Loss 16.6 23.0 39% Variation in loss for same average FICO Models provide a granular view into historical data Provide insight into correlations of economic predictors of performance Group assets into cohorts by “significant variables” Follow performance through a cycle so you can underwrite the downside Focused on positive spread to annuities in a “Lehman Scenario” Model highlighted that for same average FICO score your average loss can vary by a significant amount
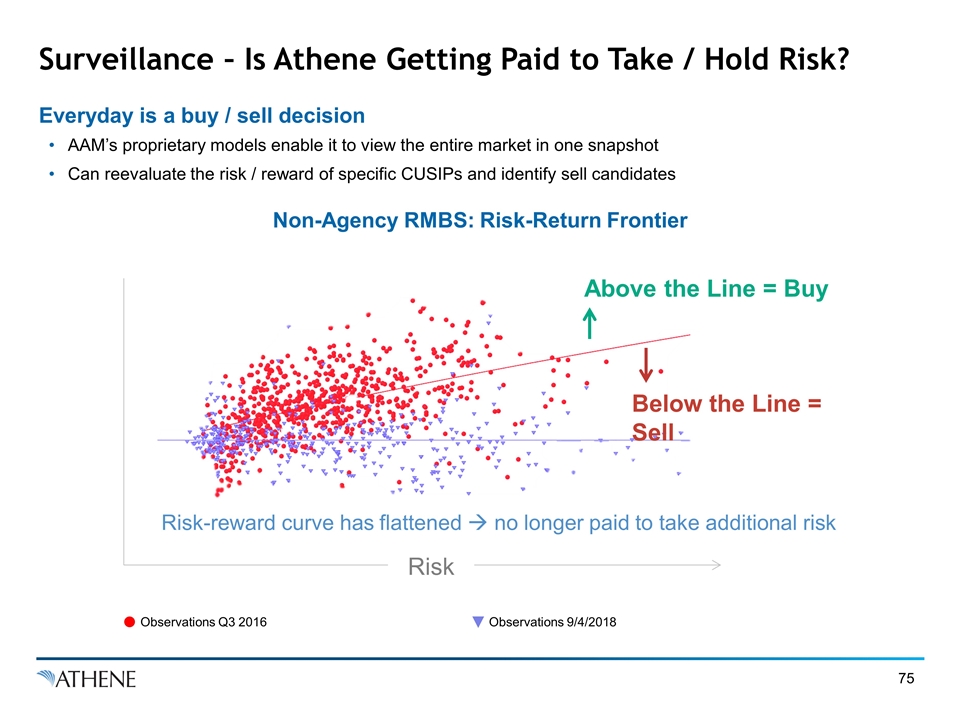
Surveillance – Is Athene Getting Paid to Take / Hold Risk? AAM’s proprietary models enable it to view the entire market in one snapshot Can reevaluate the risk / reward of specific CUSIPs and identify sell candidates Everyday is a buy / sell decision Non-Agency RMBS: Risk-Return Frontier Risk Above the Line = Buy Risk-reward curve has flattened à no longer paid to take additional risk Below the Line = Sell Observations Q3 2016 Observations 9/4/2018
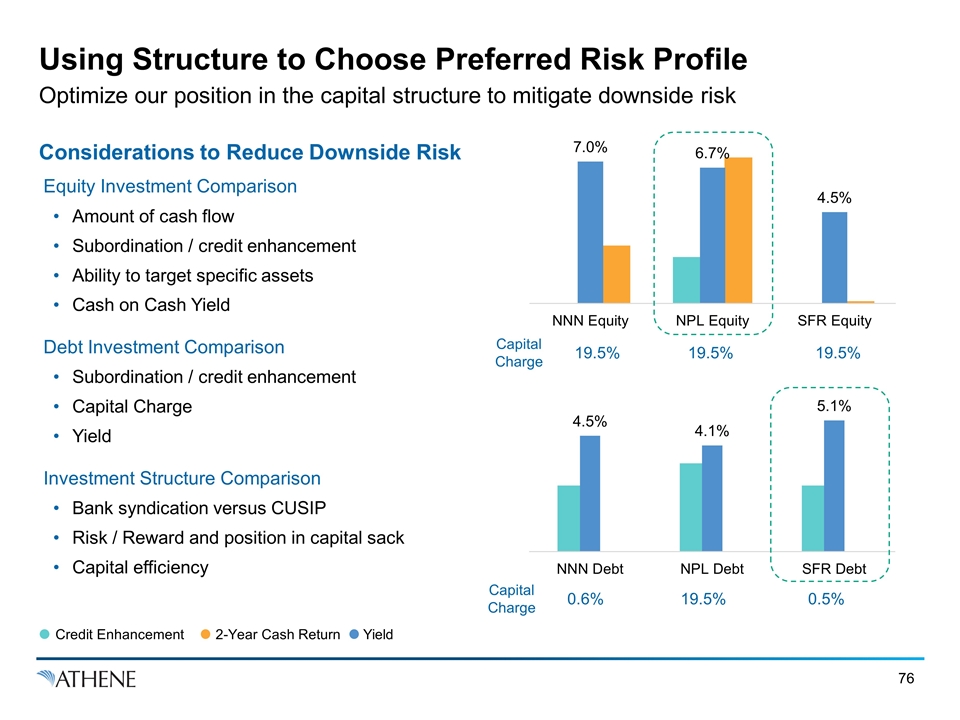
Using Structure to Choose Preferred Risk Profile Optimize our position in the capital structure to mitigate downside risk Considerations to Reduce Downside Risk Equity Investment Comparison Amount of cash flow Subordination / credit enhancement Ability to target specific assets Cash on Cash Yield Debt Investment Comparison Subordination / credit enhancement Capital Charge Yield Investment Structure Comparison Bank syndication versus CUSIP Risk / Reward and position in capital sack Capital efficiency 19.5% 19.5% 19.5% Capital Charge 0.6% 19.5% 0.5% Capital Charge Credit Enhancement 2-Year Cash Return Yield
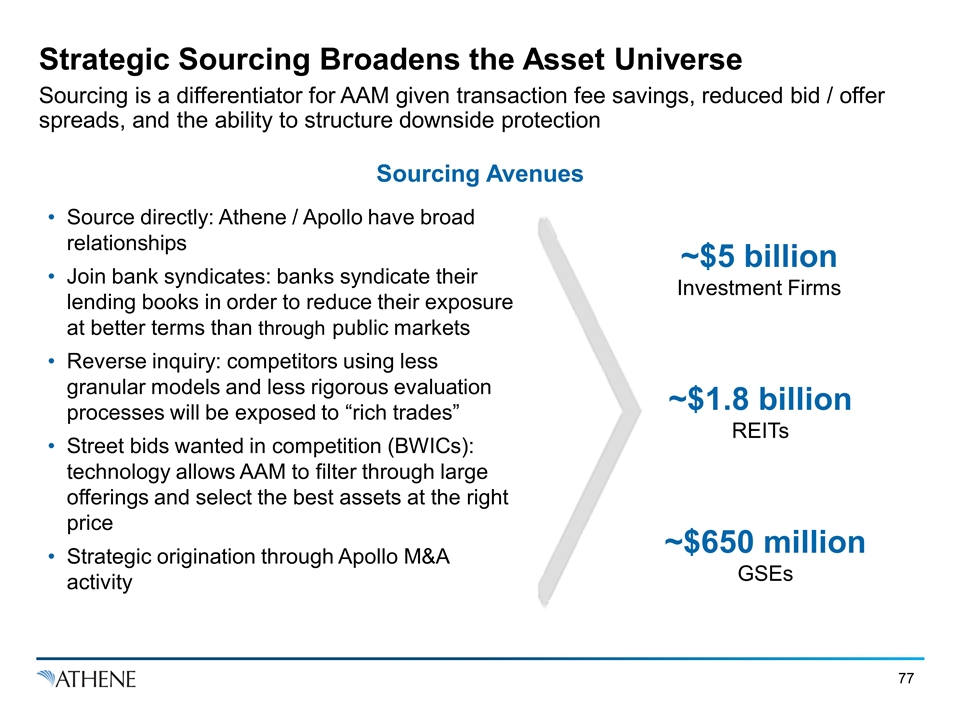
Strategic Sourcing Broadens the Asset Universe Sourcing is a differentiator for AAM given transaction fee savings, reduced bid / offer spreads, and the ability to structure downside protection Sourcing Avenues Source directly: Athene / Apollo have broad relationships Join bank syndicates: banks syndicate their lending books in order to reduce their exposure at better terms than through public markets Reverse inquiry: competitors using less granular models and less rigorous evaluation processes will be exposed to “rich trades” Street bids wanted in competition (BWICs): technology allows AAM to filter through large offerings and select the best assets at the right price Strategic origination through Apollo M&A activity ~$5 billion Investment Firms ~$1.8 billion REITs ~$650 million GSEs
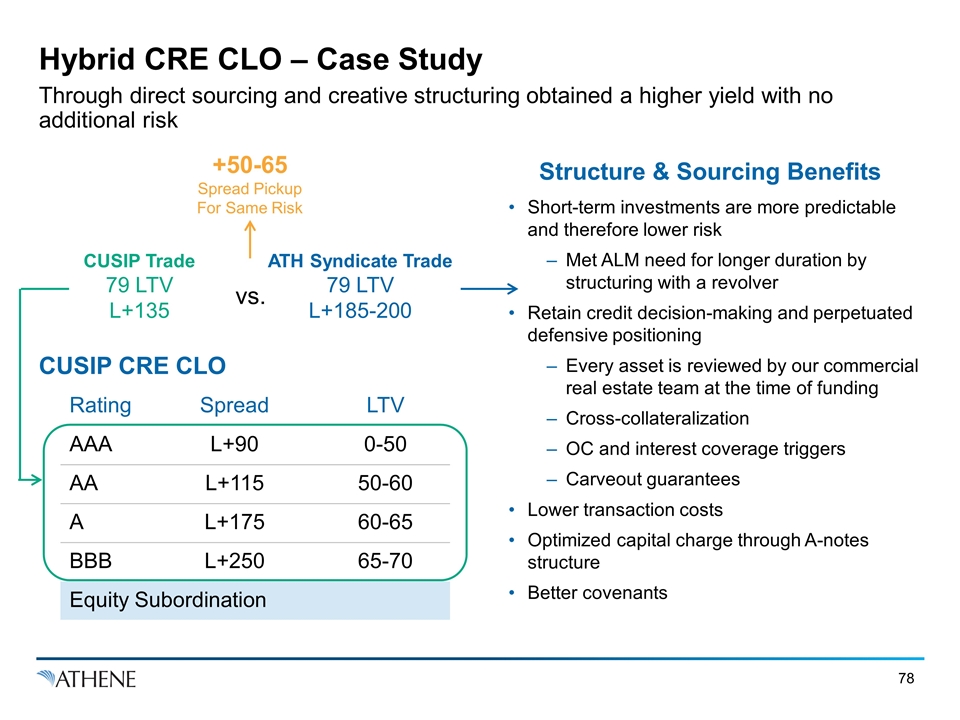
Hybrid CRE CLO – Case Study Through direct sourcing and creative structuring obtained a higher yield with no additional risk Rating Spread LTV AAA L+90 0-50 AA L+115 50-60 A L+175 60-65 BBB L+250 65-70 Equity Subordination Structure & Sourcing Benefits Short-term investments are more predictable and therefore lower risk Met ALM need for longer duration by structuring with a revolver Retain credit decision-making and perpetuated defensive positioning Every asset is reviewed by our commercial real estate team at the time of funding Cross-collateralization OC and interest coverage triggers Carveout guarantees Lower transaction costs Optimized capital charge through A-notes structure Better covenants CUSIP CRE CLO CUSIP Trade 79 LTV L+135 ATH Syndicate Trade 79 LTV L+185-200 vs. +50-65 Spread Pickup For Same Risk
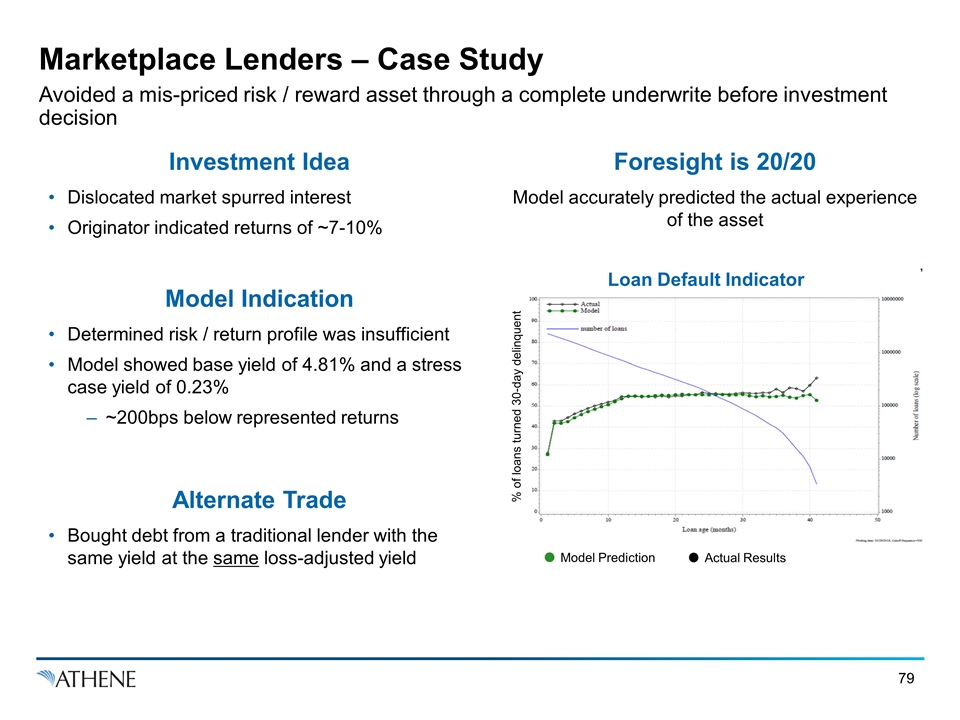
Marketplace Lenders – Case Study Avoided a mis-priced risk / reward asset through a complete underwrite before investment decision Investment Idea Foresight is 20/20 Dislocated market spurred interest Originator indicated returns of ~7-10% Model Indication Determined risk / return profile was insufficient Model showed base yield of 4.81% and a stress case yield of 0.23% ~200bps below represented returns Alternate Trade Bought debt from a traditional lender with the same yield at the same loss-adjusted yield Model accurately predicted the actual experience of the asset Model Prediction Actual Results % of loans turned 30-day delinquent Loan Default Indicator
Investment Management Strategy Q&A

Multi-Channel Distribution Model Built for Continued Organic Growth Grant Kvalheim & Bill Wheeler
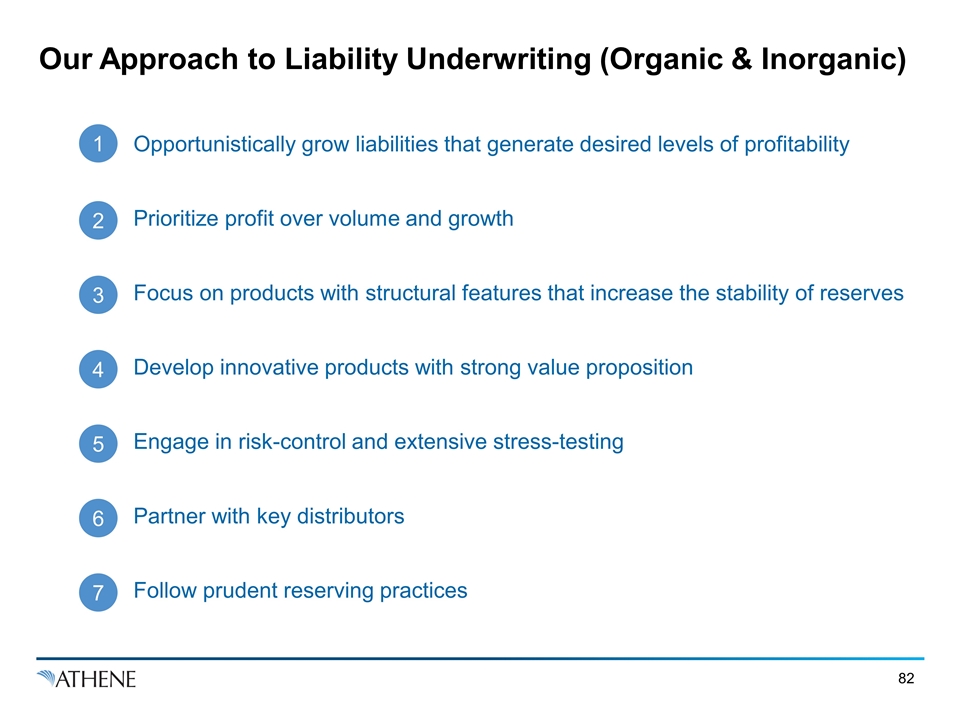
Our Approach to Liability Underwriting (Organic & Inorganic) Opportunistically grow liabilities that generate desired levels of profitability Prioritize profit over volume and growth Focus on products with structural features that increase the stability of reserves Develop innovative products with strong value proposition Engage in risk-control and extensive stress-testing Partner with key distributors Follow prudent reserving practices 1 2 3 4 5 6 7
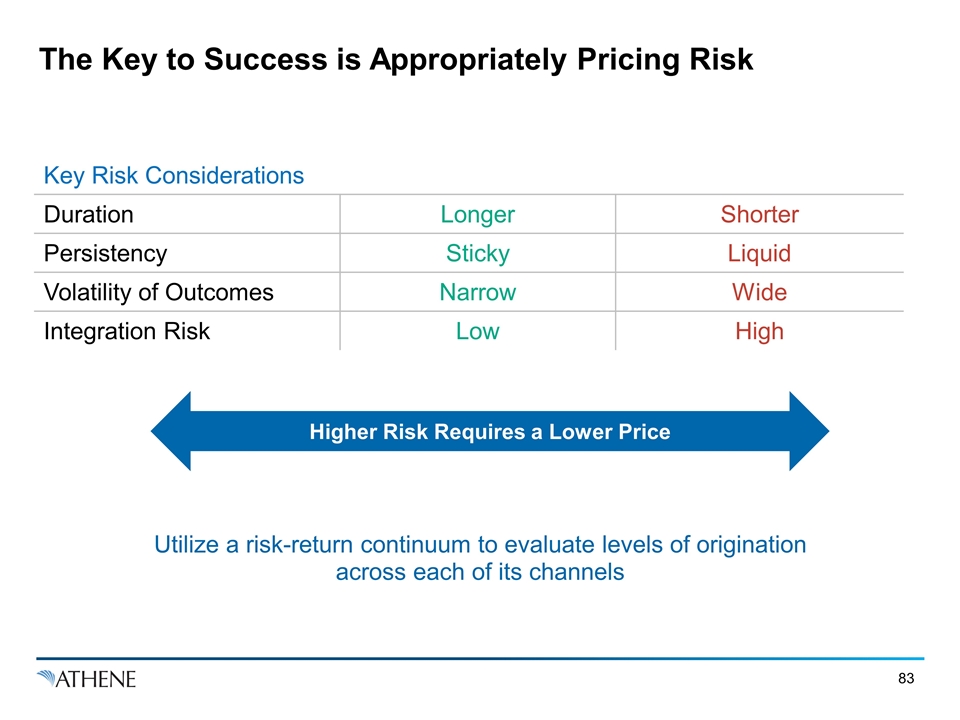
The Key to Success is Appropriately Pricing Risk Higher Risk Requires a Lower Price Key Risk Considerations Duration Longer Shorter Persistency Sticky Liquid Volatility of Outcomes Narrow Wide Integration Risk Low High Utilize a risk-return continuum to evaluate levels of origination across each of its channels
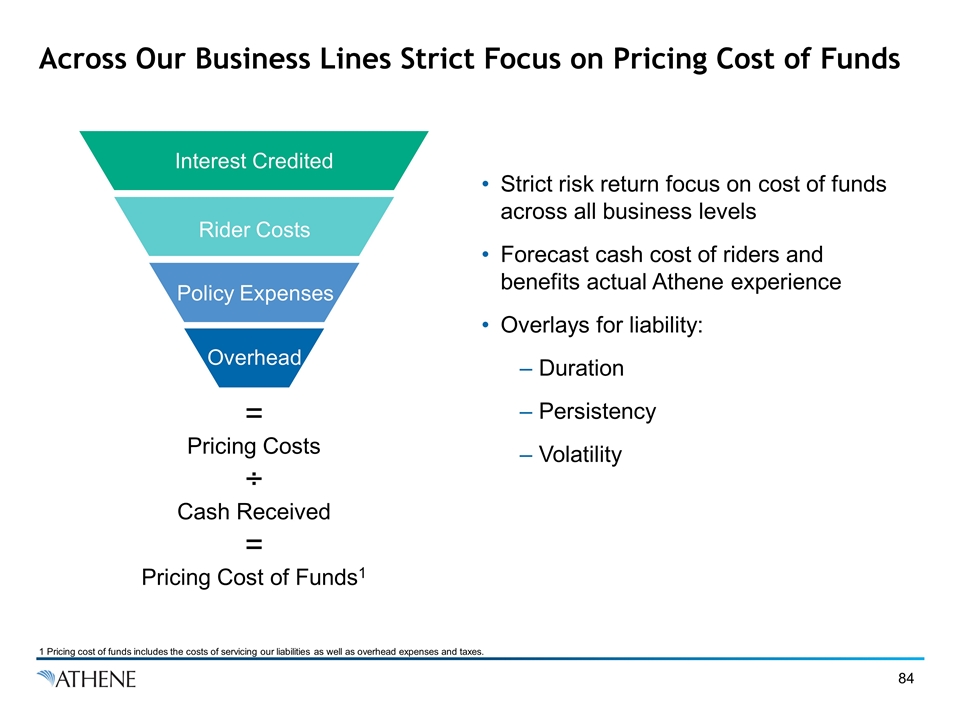
Across Our Business Lines Strict Focus on Pricing Cost of Funds = Pricing Costs ÷ Cash Received = Pricing Cost of Funds1 Interest Credited Rider Costs Policy Expenses Overhead Strict risk return focus on cost of funds across all business levels Forecast cash cost of riders and benefits actual Athene experience Overlays for liability: Duration Persistency Volatility 1 Pricing cost of funds includes the costs of servicing our liabilities as well as overhead expenses and taxes.
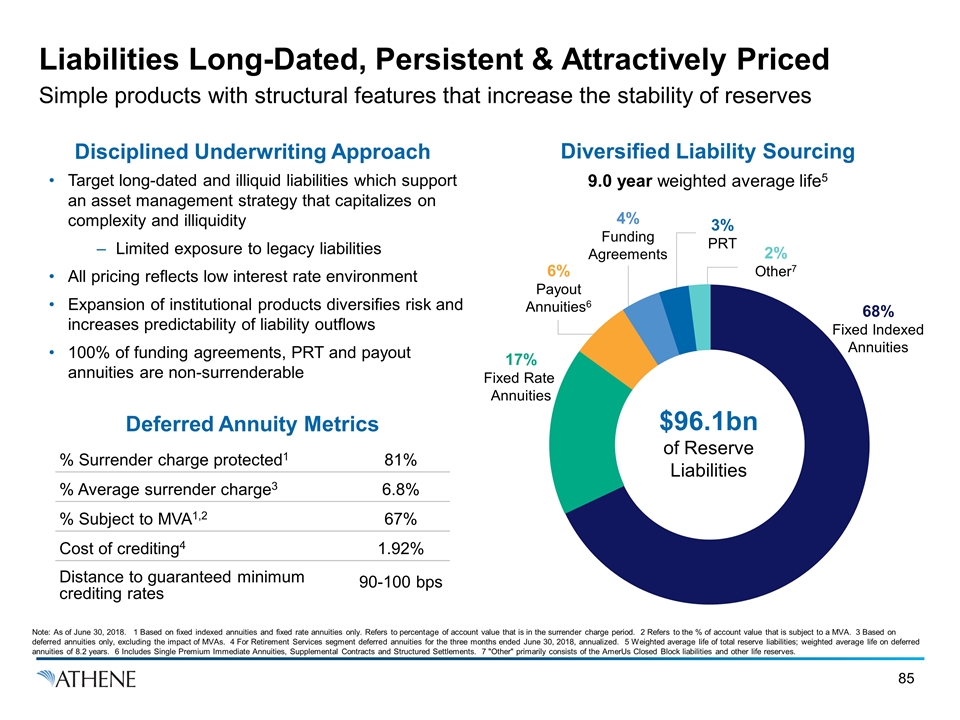
Liabilities Long-Dated, Persistent & Attractively Priced Simple products with structural features that increase the stability of reserves Disciplined Underwriting Approach Diversified Liability Sourcing Target long-dated and illiquid liabilities which support an asset management strategy that capitalizes on complexity and illiquidity Limited exposure to legacy liabilities All pricing reflects low interest rate environment Expansion of institutional products diversifies risk and increases predictability of liability outflows 100% of funding agreements, PRT and payout annuities are non-surrenderable Deferred Annuity Metrics % Surrender charge protected1 81% % Average surrender charge3 6.8% % Subject to MVA1,2 67% Cost of crediting4 1.92% Distance to guaranteed minimum crediting rates 90-100 bps Note: As of June 30, 2018. 1 Based on fixed indexed annuities and fixed rate annuities only. Refers to percentage of account value that is in the surrender charge period. 2 Refers to the % of account value that is subject to a MVA. 3 Based on deferred annuities only, excluding the impact of MVAs. 4 For Retirement Services segment deferred annuities for the three months ended June 30, 2018, annualized. 5 Weighted average life of total reserve liabilities; weighted average life on deferred annuities of 8.2 years. 6 Includes Single Premium Immediate Annuities, Supplemental Contracts and Structured Settlements. 7 "Other" primarily consists of the AmerUs Closed Block liabilities and other life reserves. 17% Fixed Rate Annuities 68% Fixed Indexed Annuities $96.1bn of Reserve Liabilities 2% Other7 3% PRT 6% Payout Annuities6 4% Funding Agreements 9.0 year weighted average life5
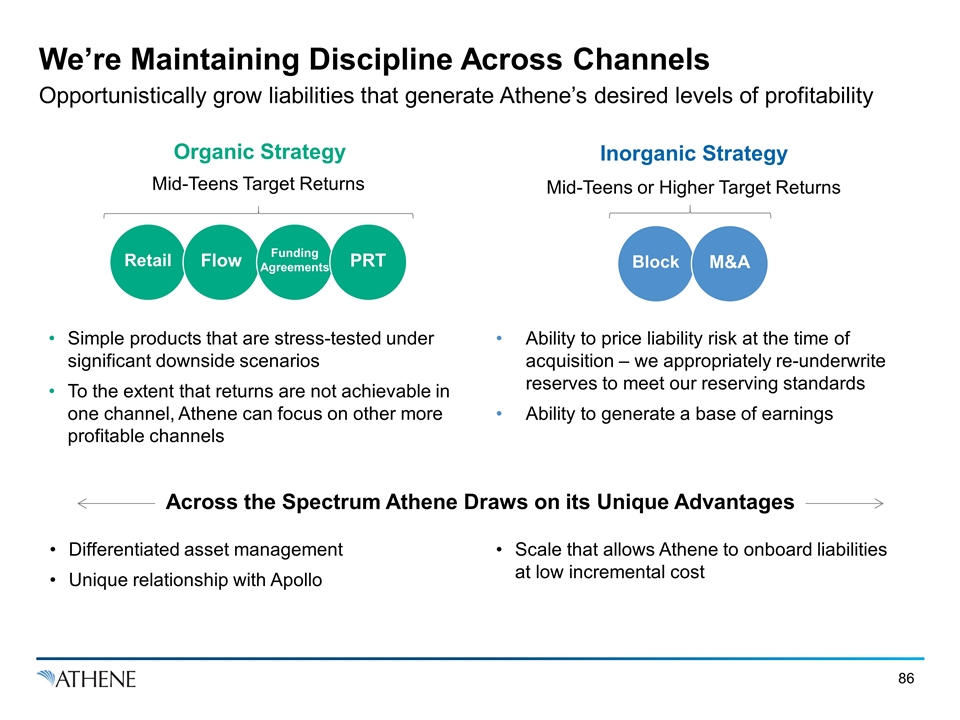
We’re Maintaining Discipline Across Channels Opportunistically grow liabilities that generate Athene’s desired levels of profitability Organic Strategy Inorganic Strategy Mid-Teens or Higher Target Returns Mid-Teens Target Returns Retail Flow PRT Simple products that are stress-tested under significant downside scenarios To the extent that returns are not achievable in one channel, Athene can focus on other more profitable channels Ability to price liability risk at the time of acquisition – we appropriately re-underwrite reserves to meet our reserving standards Ability to generate a base of earnings Across the Spectrum Athene Draws on its Unique Advantages Block M&A Differentiated asset management Unique relationship with Apollo Scale that allows Athene to onboard liabilities at low incremental cost Funding Agreements
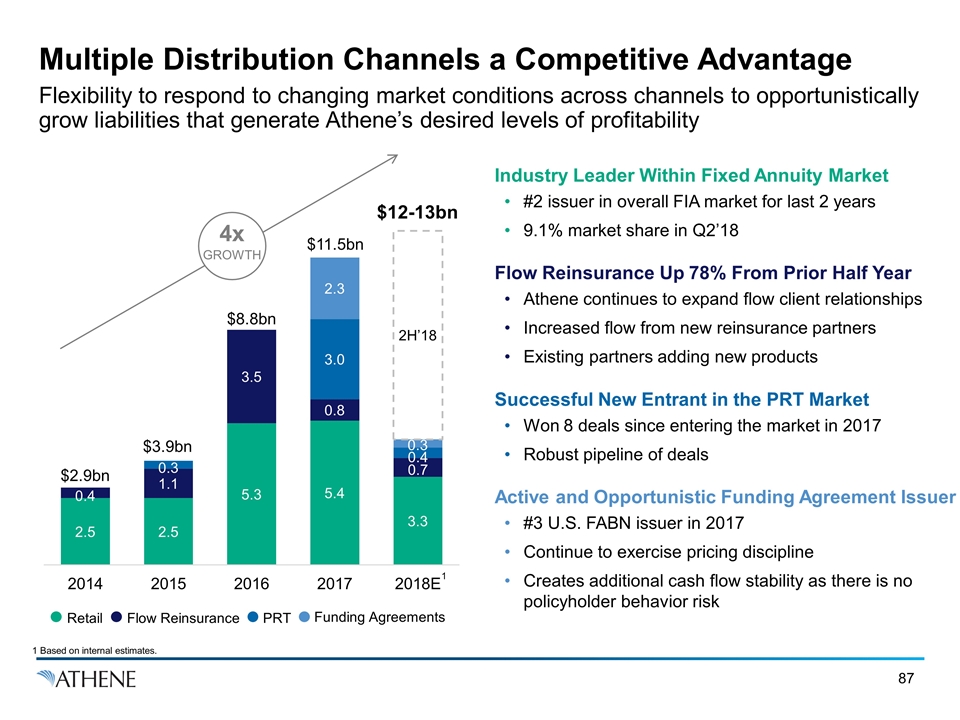
Multiple Distribution Channels a Competitive Advantage Flexibility to respond to changing market conditions across channels to opportunistically grow liabilities that generate Athene’s desired levels of profitability $2.9bn $3.9bn $8.8bn $11.5bn $12-13bn Industry Leader Within Fixed Annuity Market #2 issuer in overall FIA market for last 2 years 9.1% market share in Q2’18 Flow Reinsurance Up 78% From Prior Half Year Athene continues to expand flow client relationships Increased flow from new reinsurance partners Existing partners adding new products Successful New Entrant in the PRT Market Won 8 deals since entering the market in 2017 Robust pipeline of deals Active and Opportunistic Funding Agreement Issuer #3 U.S. FABN issuer in 2017 Continue to exercise pricing discipline Creates additional cash flow stability as there is no policyholder behavior risk Flow Reinsurance Funding Agreements PRT Retail 4x GROWTH 1 Based on internal estimates. 1
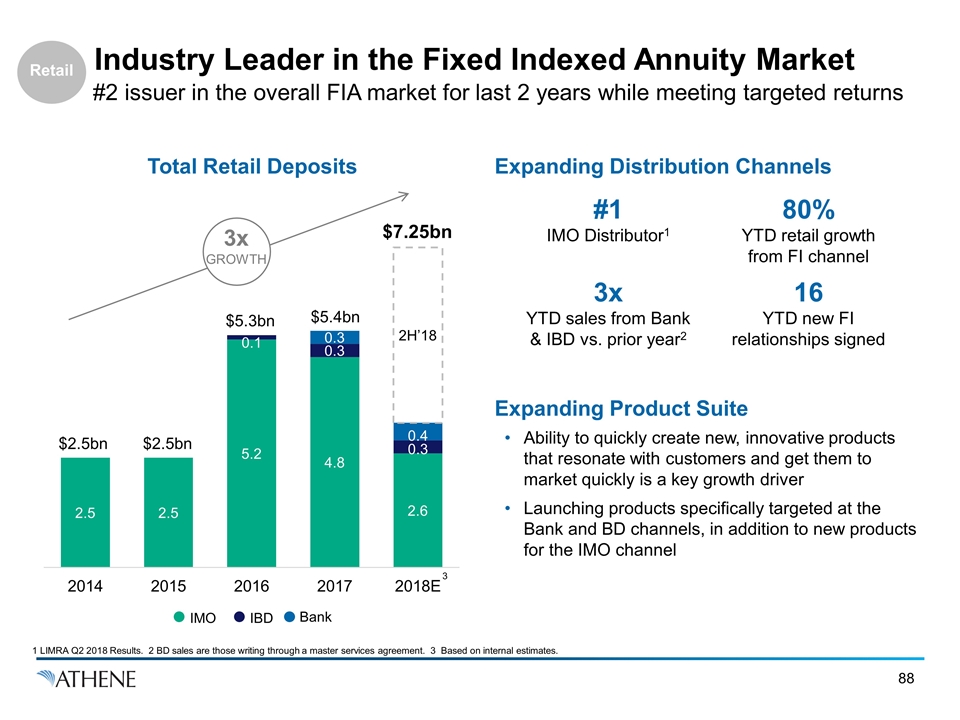
Industry Leader in the Fixed Indexed Annuity Market #2 issuer in the overall FIA market for last 2 years while meeting targeted returns Expanding Distribution Channels Expanding Product Suite Ability to quickly create new, innovative products that resonate with customers and get them to market quickly is a key growth driver Launching products specifically targeted at the Bank and BD channels, in addition to new products for the IMO channel Total Retail Deposits $2.5bn $2.5bn $5.3bn $5.4bn $7.25bn IBD Bank IMO #1 IMO Distributor1 3x YTD sales from Bank & IBD vs. prior year2 80% YTD retail growth from FI channel 16 YTD new FI relationships signed 3 3x GROWTH Retail 1 LIMRA Q2 2018 Results. 2 BD sales are those writing through a master services agreement. 3 Based on internal estimates.
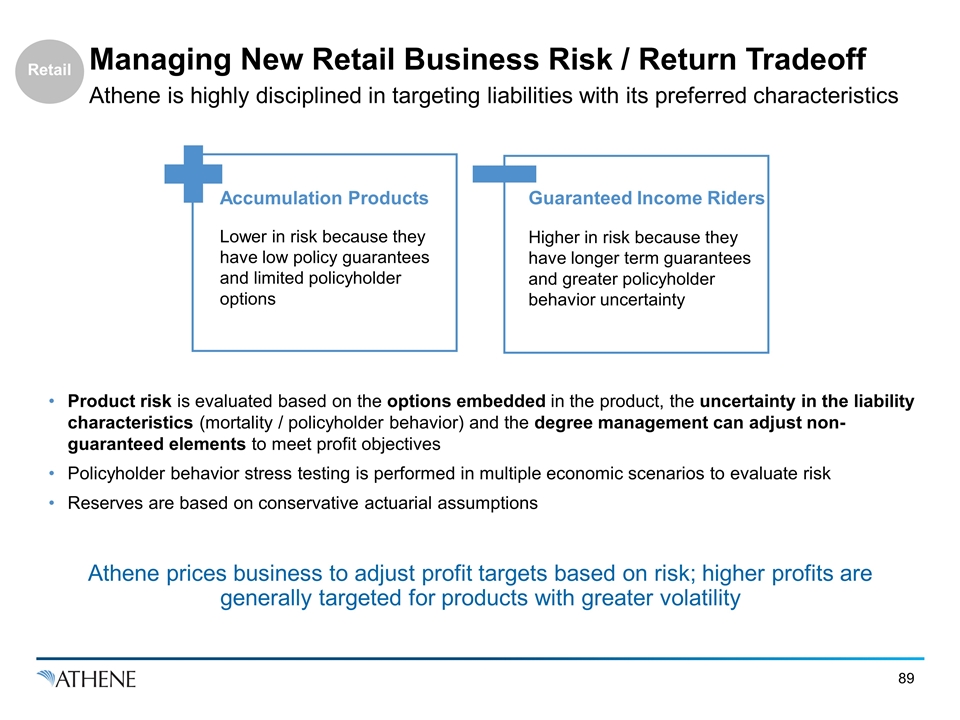
Managing New Retail Business Risk / Return Tradeoff Athene is highly disciplined in targeting liabilities with its preferred characteristics Accumulation Products Lower in risk because they have low policy guarantees and limited policyholder options Guaranteed Income Riders Higher in risk because they have longer term guarantees and greater policyholder behavior uncertainty Product risk is evaluated based on the options embedded in the product, the uncertainty in the liability characteristics (mortality / policyholder behavior) and the degree management can adjust non-guaranteed elements to meet profit objectives Policyholder behavior stress testing is performed in multiple economic scenarios to evaluate risk Reserves are based on conservative actuarial assumptions Athene prices business to adjust profit targets based on risk; higher profits are generally targeted for products with greater volatility Retail
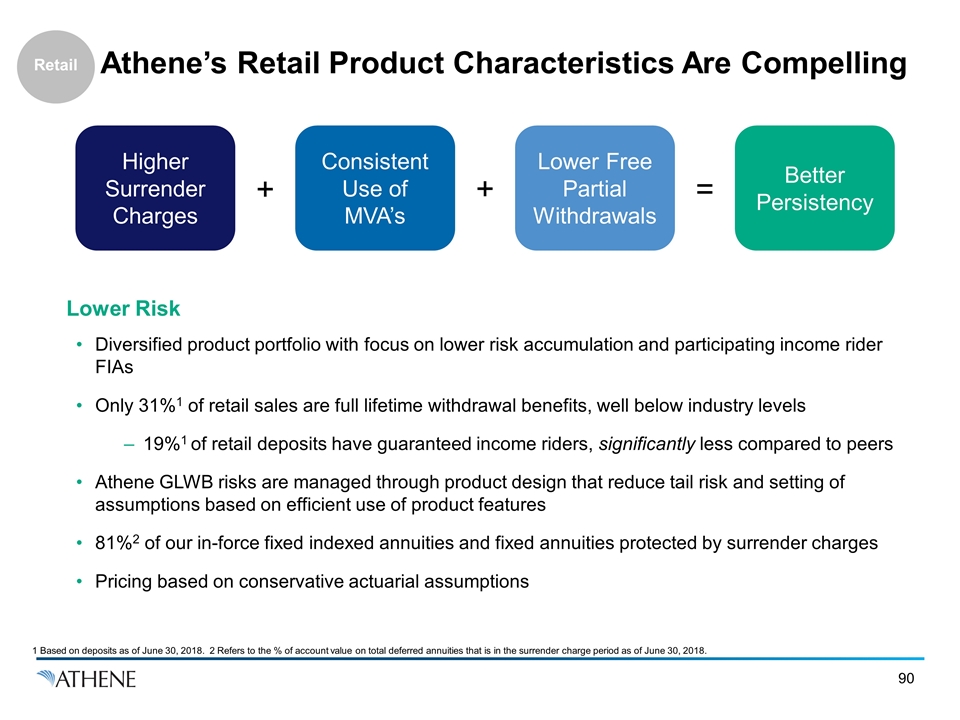
Athene’s Retail Product Characteristics Are Compelling Lower Risk Diversified product portfolio with focus on lower risk accumulation and participating income rider FIAs Only 31%1 of retail sales are full lifetime withdrawal benefits, well below industry levels 19%1 of retail deposits have guaranteed income riders, significantly less compared to peers Athene GLWB risks are managed through product design that reduce tail risk and setting of assumptions based on efficient use of product features 81%2 of our in-force fixed indexed annuities and fixed annuities protected by surrender charges Pricing based on conservative actuarial assumptions Higher Surrender Charges + + = Consistent Use of MVA’s Lower Free Partial Withdrawals Better Persistency Retail 1 Based on deposits as of June 30, 2018. 2 Refers to the % of account value on total deferred annuities that is in the surrender charge period as of June 30, 2018.
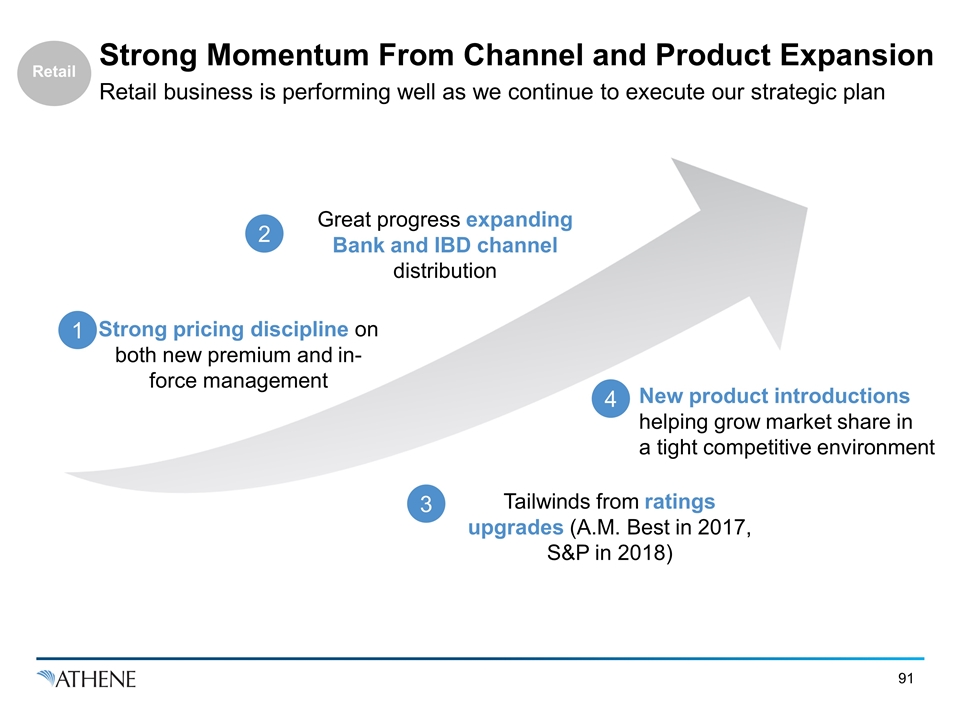
Strong Momentum From Channel and Product Expansion Retail business is performing well as we continue to execute our strategic plan Strong pricing discipline on both new premium and in-force management 1 Great progress expanding Bank and IBD channel distribution 2 3 Tailwinds from ratings upgrades (A.M. Best in 2017, S&P in 2018) New product introductions helping grow market share in a tight competitive environment 4 Retail
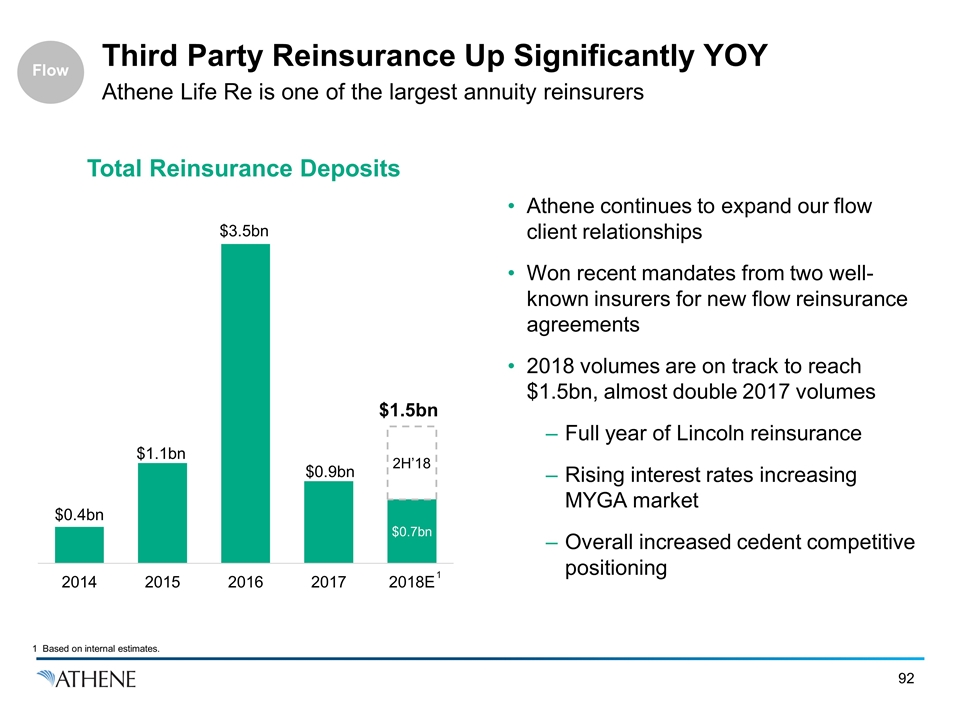
Third Party Reinsurance Up Significantly YOY Athene Life Re is one of the largest annuity reinsurers Athene continues to expand our flow client relationships Won recent mandates from two well-known insurers for new flow reinsurance agreements 2018 volumes are on track to reach $1.5bn, almost double 2017 volumes Full year of Lincoln reinsurance Rising interest rates increasing MYGA market Overall increased cedent competitive positioning $1.5bn Total Reinsurance Deposits 1 Based on internal estimates. 1 Flow
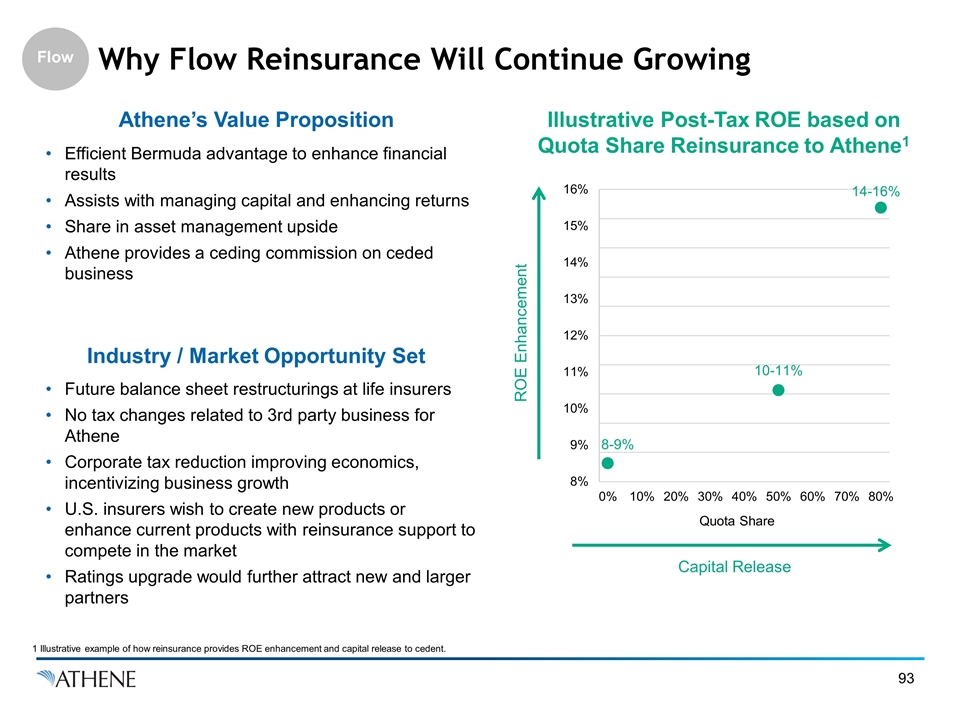
Why Flow Reinsurance Will Continue Growing Illustrative Post-Tax ROE based on Quota Share Reinsurance to Athene1 Athene’s Value Proposition Efficient Bermuda advantage to enhance financial results Assists with managing capital and enhancing returns Share in asset management upside Athene provides a ceding commission on ceded business Industry / Market Opportunity Set Future balance sheet restructurings at life insurers No tax changes related to 3rd party business for Athene Corporate tax reduction improving economics, incentivizing business growth U.S. insurers wish to create new products or enhance current products with reinsurance support to compete in the market Ratings upgrade would further attract new and larger partners Capital Release ROE Enhancement Flow 1 Illustrative example of how reinsurance provides ROE enhancement and capital release to cedent.
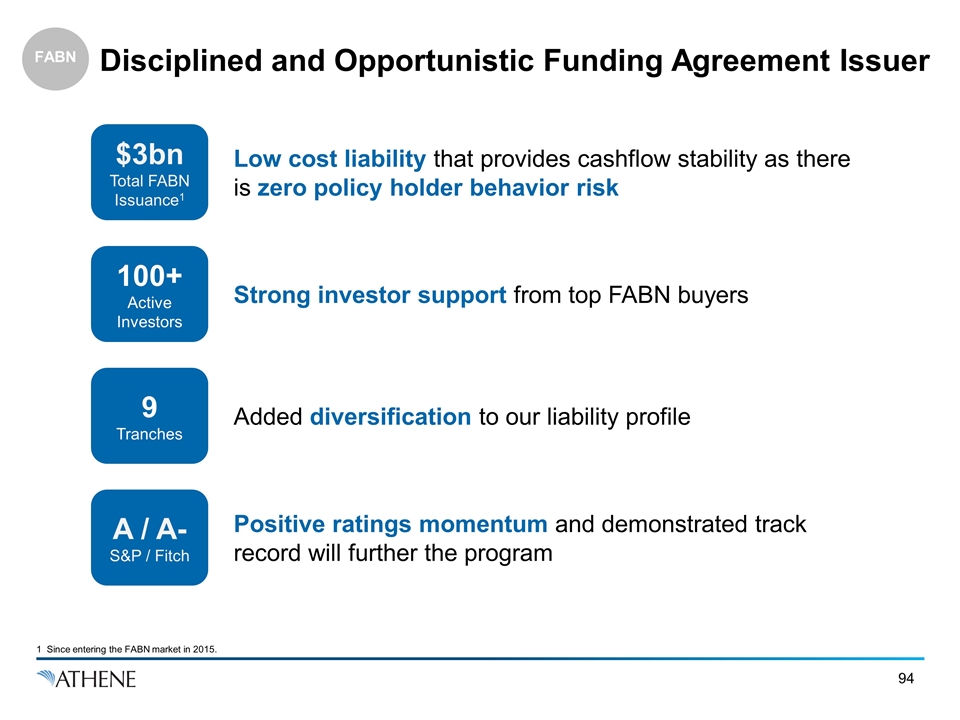
$3bn Total FABN Issuance1 Disciplined and Opportunistic Funding Agreement Issuer 1 Since entering the FABN market in 2015. Low cost liability that provides cashflow stability as there is zero policy holder behavior risk Positive ratings momentum and demonstrated track record will further the program Added diversification to our liability profile 100+ Active Investors A / A- S&P / Fitch 9 Tranches Strong investor support from top FABN buyers FABN

Bill Wheeler Pension Risk Transfer
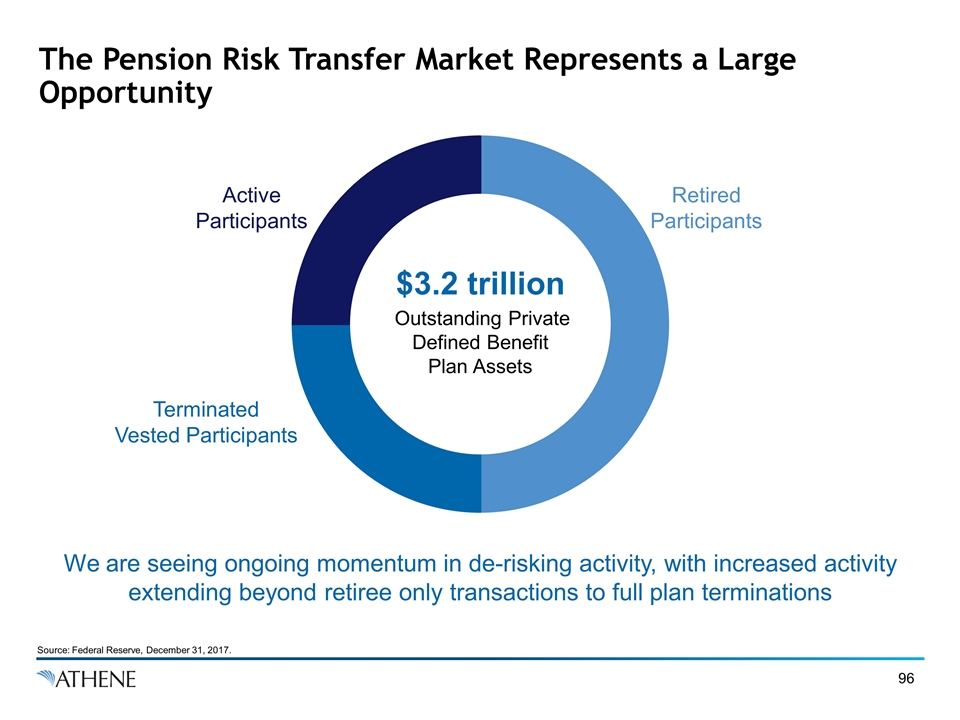
The Pension Risk Transfer Market Represents a Large Opportunity We are seeing ongoing momentum in de-risking activity, with increased activity extending beyond retiree only transactions to full plan terminations $3.2 trillion Outstanding Private Defined Benefit Plan Assets Retired Participants Terminated Vested Participants Active Participants Source: Federal Reserve, December 31, 2017.
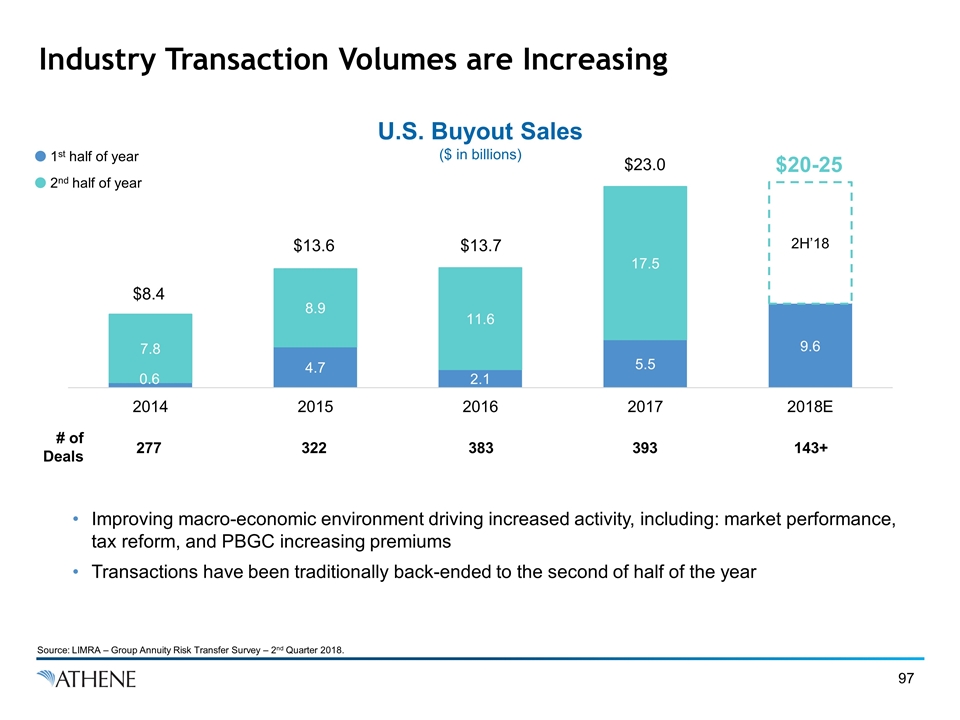
Industry Transaction Volumes are Increasing U.S. Buyout Sales ($ in billions) $20-25 2nd half of year 1st half of year $8.4 $13.6 $13.7 $23.0 Improving macro-economic environment driving increased activity, including: market performance, tax reform, and PBGC increasing premiums Transactions have been traditionally back-ended to the second of half of the year # of Deals 277 322 383 393 143+ Source: LIMRA – Group Annuity Risk Transfer Survey – 2nd Quarter 2018.
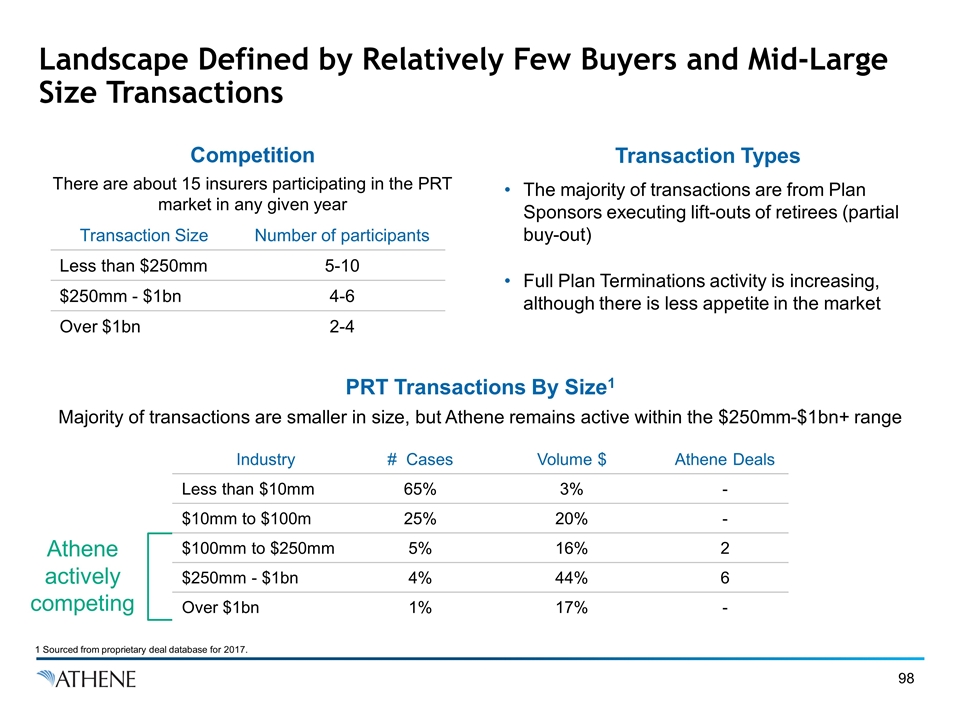
Athene actively competing Landscape Defined by Relatively Few Buyers and Mid-Large Size Transactions Competition Transaction Types There are about 15 insurers participating in the PRT market in any given year The majority of transactions are from Plan Sponsors executing lift-outs of retirees (partial buy-out) Full Plan Terminations activity is increasing, although there is less appetite in the market Transaction Size Number of participants Less than $250mm 5-10 $250mm - $1bn 4-6 Over $1bn 2-4 Majority of transactions are smaller in size, but Athene remains active within the $250mm-$1bn+ range Industry # Cases Volume $ Athene Deals Less than $10mm 65% 3% - $10mm to $100m 25% 20% - $100mm to $250mm 5% 16% 2 $250mm - $1bn 4% 44% 6 Over $1bn 1% 17% - PRT Transactions By Size1 1 Sourced from proprietary deal database for 2017.
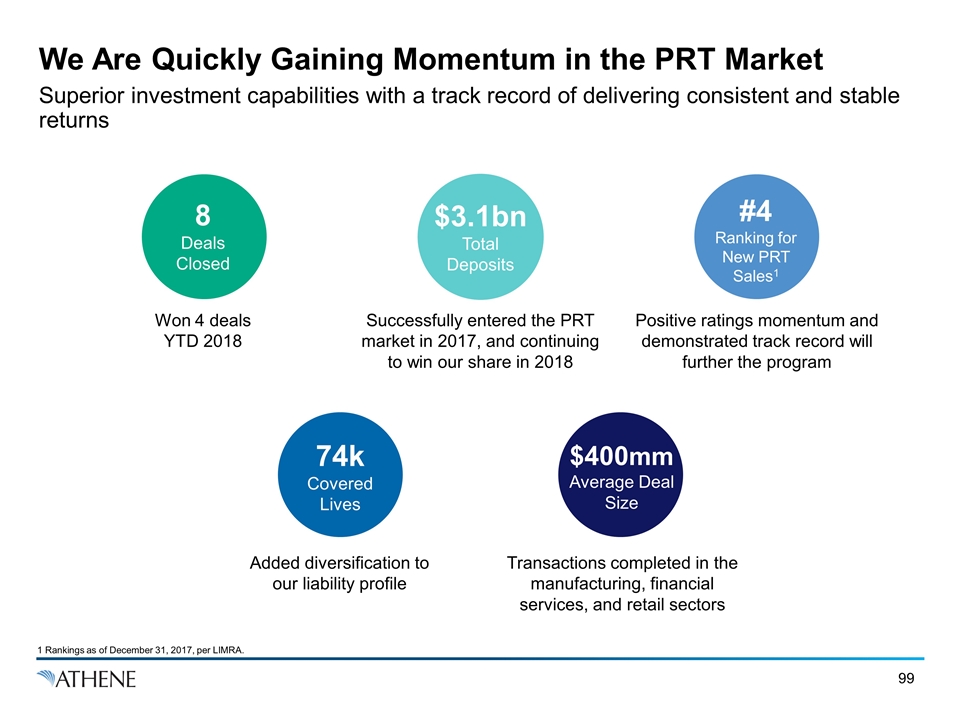
We Are Quickly Gaining Momentum in the PRT Market Superior investment capabilities with a track record of delivering consistent and stable returns 1 Rankings as of December 31, 2017, per LIMRA. 8 Deals Closed $3.1bn Total Deposits #4 Ranking for New PRT Sales1 74k Covered Lives $400mm Average Deal Size Won 4 deals YTD 2018 Successfully entered the PRT market in 2017, and continuing to win our share in 2018 Positive ratings momentum and demonstrated track record will further the program Transactions completed in the manufacturing, financial services, and retail sectors Added diversification to our liability profile

Disciplined & Value Generative Inorganic Strategy Bill Wheeler
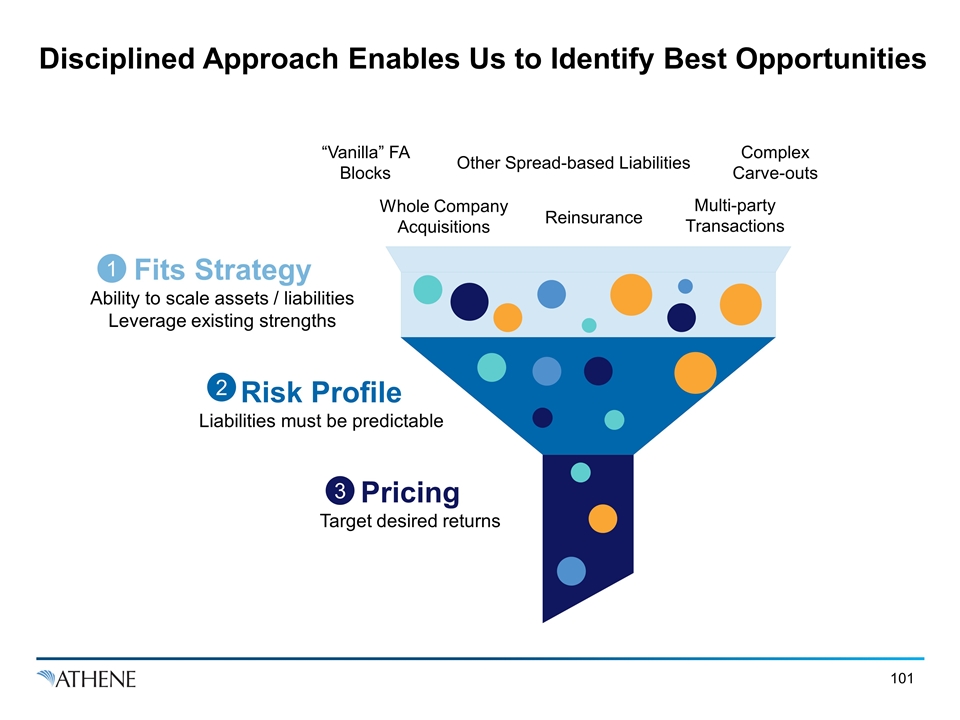
Disciplined Approach Enables Us to Identify Best Opportunities Whole Company Acquisitions Reinsurance Multi-party Transactions Complex Carve-outs Other Spread-based Liabilities “Vanilla” FA Blocks Fits Strategy Ability to scale assets / liabilities Leverage existing strengths Risk Profile Liabilities must be predictable Pricing Target desired returns 1 2 3
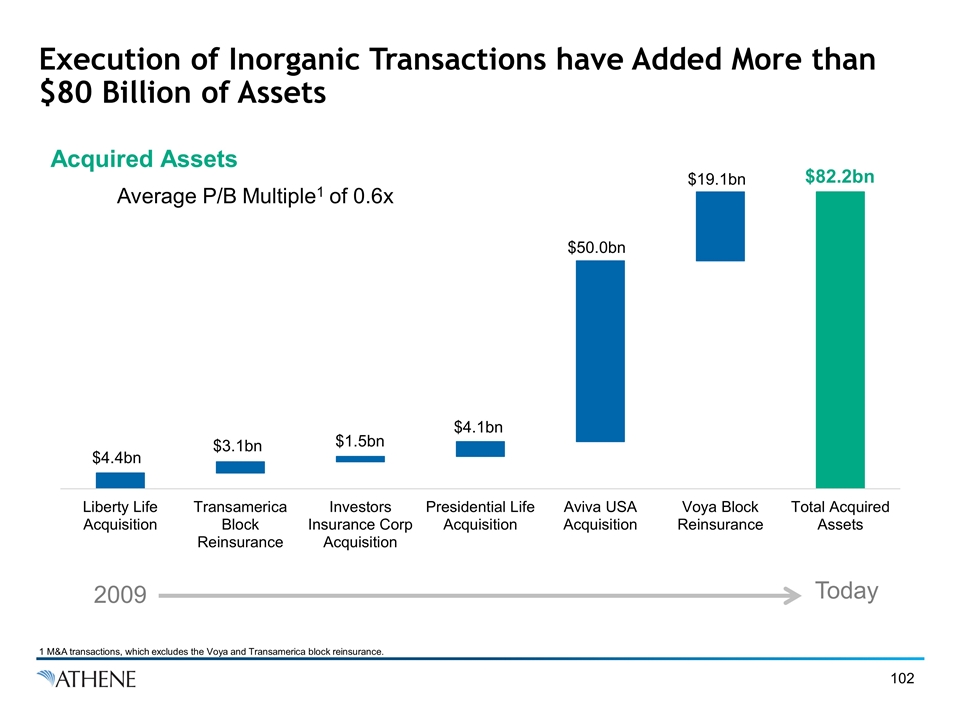
Execution of Inorganic Transactions have Added More than $80 Billion of Assets Acquired Assets $4.4bn $3.1bn $4.1bn $1.5bn $50.0bn $19.1bn $82.2bn 1 M&A transactions, which excludes the Voya and Transamerica block reinsurance. Average P/B Multiple1 of 0.6x 2009 Today
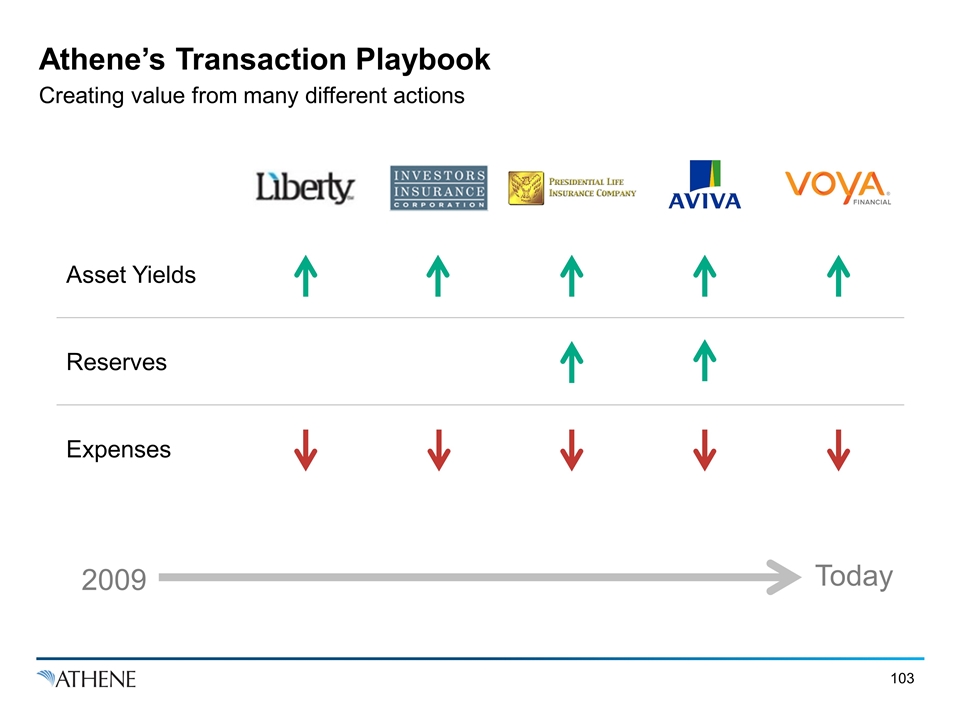
Athene’s Transaction Playbook Creating value from many different actions 2009 Today Asset Yields Reserves Expenses
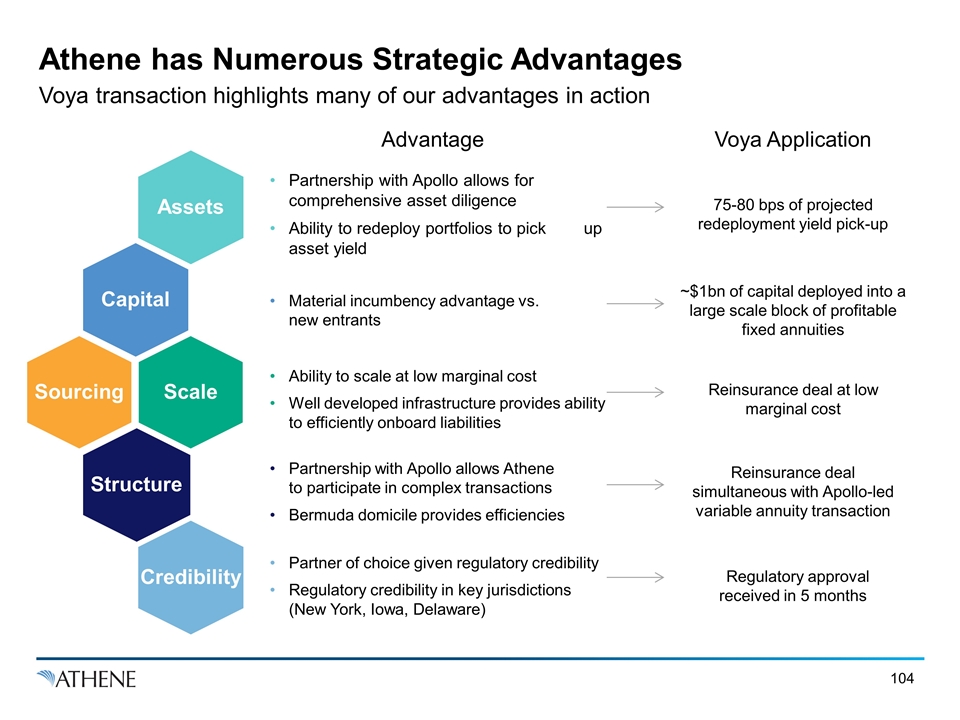
Advantage Voya Application Partnership with Apollo allows for comprehensive asset diligence Ability to redeploy portfolios to pick up asset yield 75-80 bps of projected redeployment yield pick-up Material incumbency advantage vs. new entrants ~$1bn of capital deployed into a large scale block of profitable fixed annuities Ability to scale at low marginal cost Well developed infrastructure provides ability to efficiently onboard liabilities Reinsurance deal at low marginal cost Partnership with Apollo allows Athene to participate in complex transactions Bermuda domicile provides efficiencies Reinsurance deal simultaneous with Apollo-led variable annuity transaction Partner of choice given regulatory credibility Regulatory credibility in key jurisdictions (New York, Iowa, Delaware) Regulatory approval received in 5 months Athene has Numerous Strategic Advantages Voya transaction highlights many of our advantages in action Assets Capital Scale Structure Credibility Sourcing
Liability Growth Strategy Q&A

Risk Management John Rhodes
Risk Management is Embedded in Everything We Do The goal of risk management is to manage Athene’s risks such that it can grow profitably across various markets Robust risk management framework and procedures Risk strategy, investment, ALM and liquidity compliance policies at the Board and Management levels Risk team plays a key role in assessing inorganic opportunities Stress testing plays a key role in defining risk appetite Stress tests are performed on both sides of the balance sheet including Recession and Lehman cases
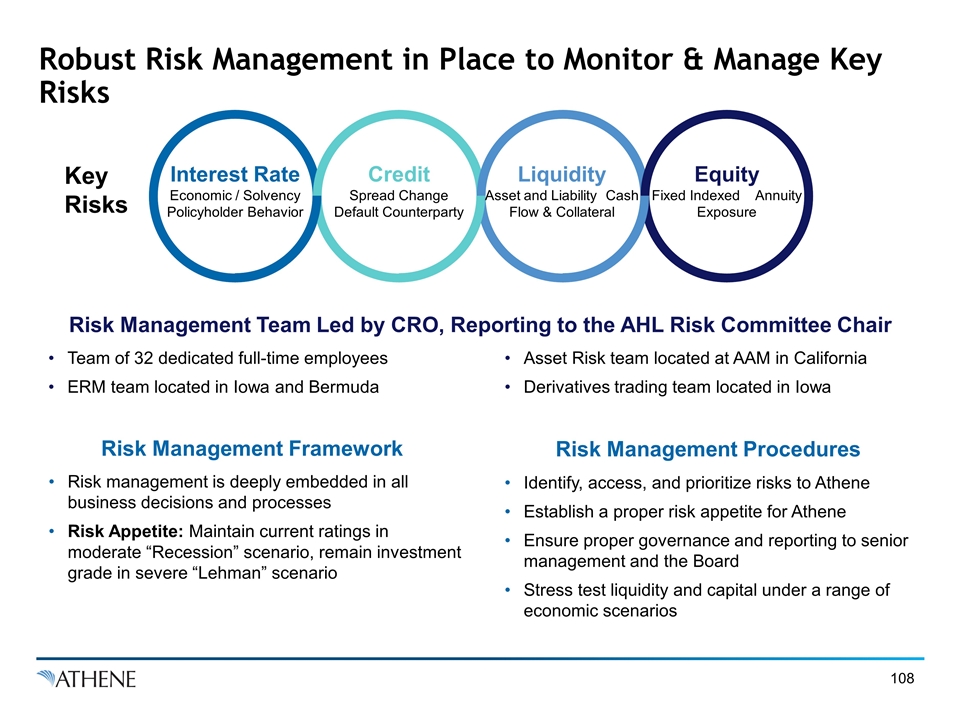
Robust Risk Management in Place to Monitor & Manage Key Risks Credit Spread Change Default Counterparty Liquidity Asset and Liability Cash Flow & Collateral Equity Fixed Indexed Annuity Exposure Interest Rate Economic / Solvency Policyholder Behavior Key Risks Risk Management Team Led by CRO, Reporting to the AHL Risk Committee Chair Team of 32 dedicated full-time employees ERM team located in Iowa and Bermuda Asset Risk team located at AAM in California Derivatives trading team located in Iowa Risk Management Framework Risk Management Procedures Risk management is deeply embedded in all business decisions and processes Risk Appetite: Maintain current ratings in moderate “Recession” scenario, remain investment grade in severe “Lehman” scenario Identify, access, and prioritize risks to Athene Establish a proper risk appetite for Athene Ensure proper governance and reporting to senior management and the Board Stress test liquidity and capital under a range of economic scenarios
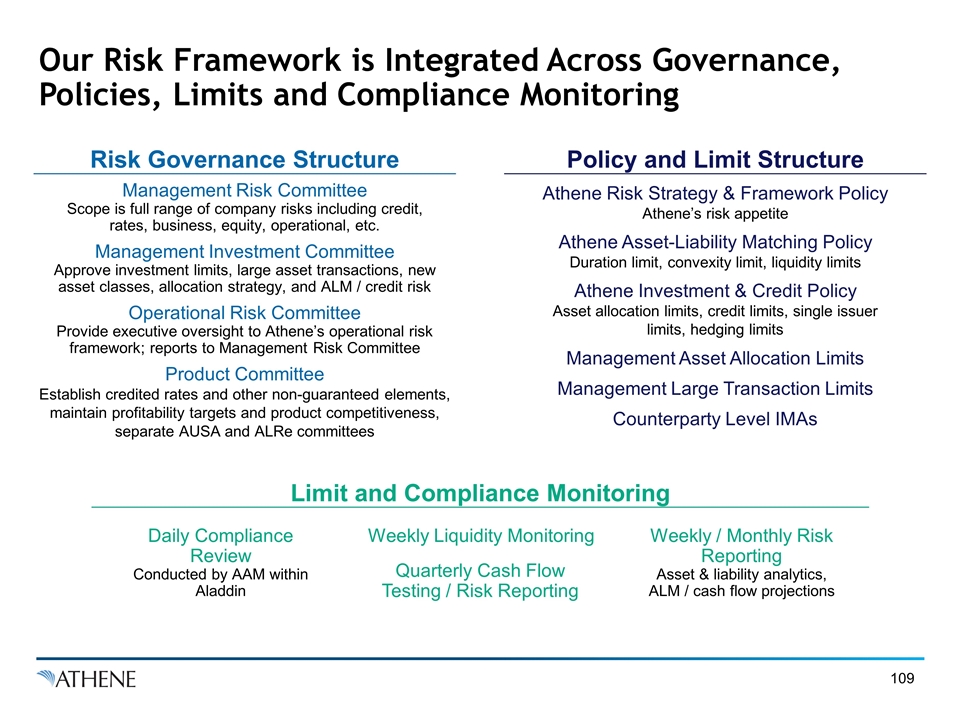
Our Risk Framework is Integrated Across Governance, Policies, Limits and Compliance Monitoring Management Risk Committee Scope is full range of company risks including credit, rates, business, equity, operational, etc. Management Investment Committee Approve investment limits, large asset transactions, new asset classes, allocation strategy, and ALM / credit risk Operational Risk Committee Provide executive oversight to Athene’s operational risk framework; reports to Management Risk Committee Product Committee Establish credited rates and other non-guaranteed elements, maintain profitability targets and product competitiveness, separate AUSA and ALRe committees Risk Governance Structure Athene Risk Strategy & Framework Policy Athene’s risk appetite Athene Asset-Liability Matching Policy Duration limit, convexity limit, liquidity limits Athene Investment & Credit Policy Asset allocation limits, credit limits, single issuer limits, hedging limits Management Asset Allocation Limits Management Large Transaction Limits Counterparty Level IMAs Policy and Limit Structure Limit and Compliance Monitoring Daily Compliance Review Conducted by AAM within Aladdin Weekly Liquidity Monitoring Quarterly Cash Flow Testing / Risk Reporting Weekly / Monthly Risk Reporting Asset & liability analytics, ALM / cash flow projections
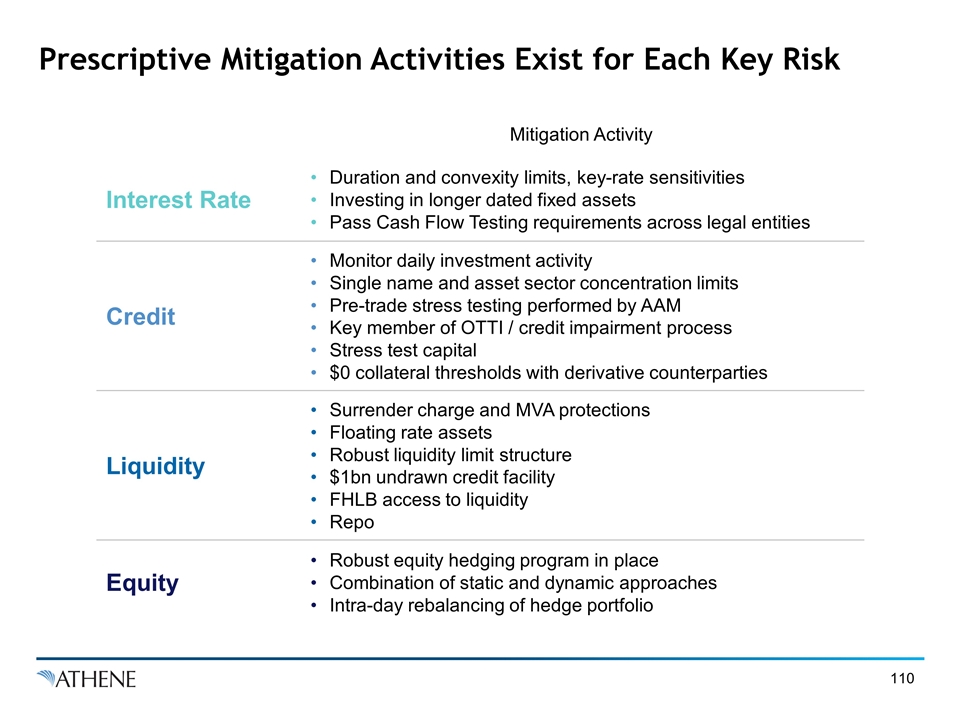
Prescriptive Mitigation Activities Exist for Each Key Risk Mitigation Activity Interest Rate Duration and convexity limits, key-rate sensitivities Investing in longer dated fixed assets Pass Cash Flow Testing requirements across legal entities Credit Monitor daily investment activity Single name and asset sector concentration limits Pre-trade stress testing performed by AAM Key member of OTTI / credit impairment process Stress test capital $0 collateral thresholds with derivative counterparties Liquidity Surrender charge and MVA protections Floating rate assets Robust liquidity limit structure $1bn undrawn credit facility FHLB access to liquidity Repo Equity Robust equity hedging program in place Combination of static and dynamic approaches Intra-day rebalancing of hedge portfolio
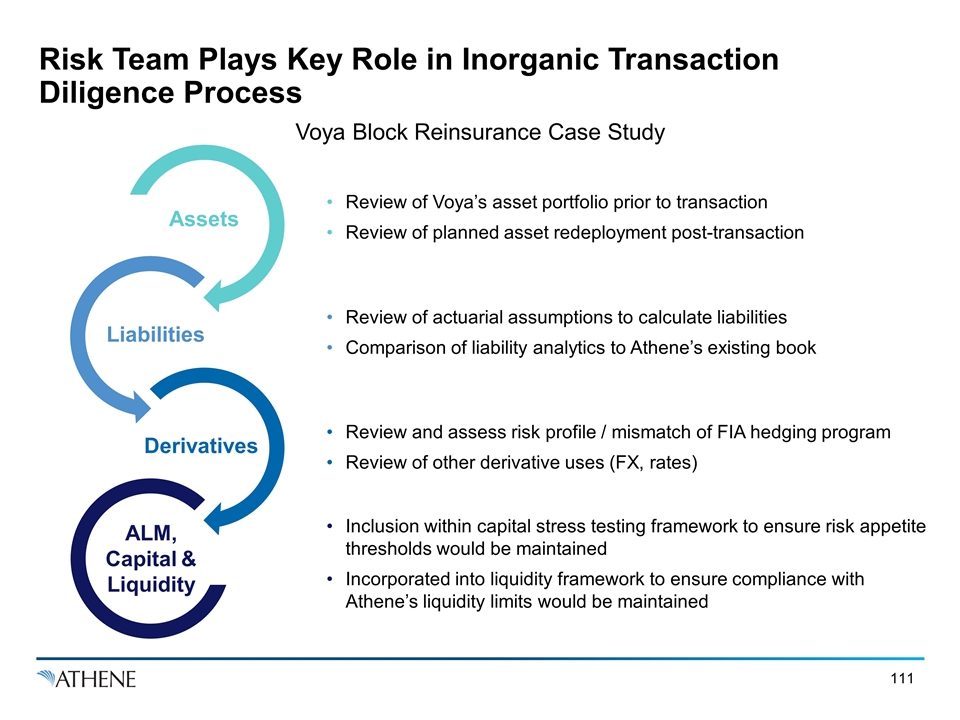
Risk Team Plays Key Role in Inorganic Transaction Diligence Process Voya Block Reinsurance Case Study Review of Voya’s asset portfolio prior to transaction Review of planned asset redeployment post-transaction ALM, Capital & Liquidity Review of actuarial assumptions to calculate liabilities Comparison of liability analytics to Athene’s existing book Review and assess risk profile / mismatch of FIA hedging program Review of other derivative uses (FX, rates) Inclusion within capital stress testing framework to ensure risk appetite thresholds would be maintained Incorporated into liquidity framework to ensure compliance with Athene’s liquidity limits would be maintained Assets Liabilities Derivatives
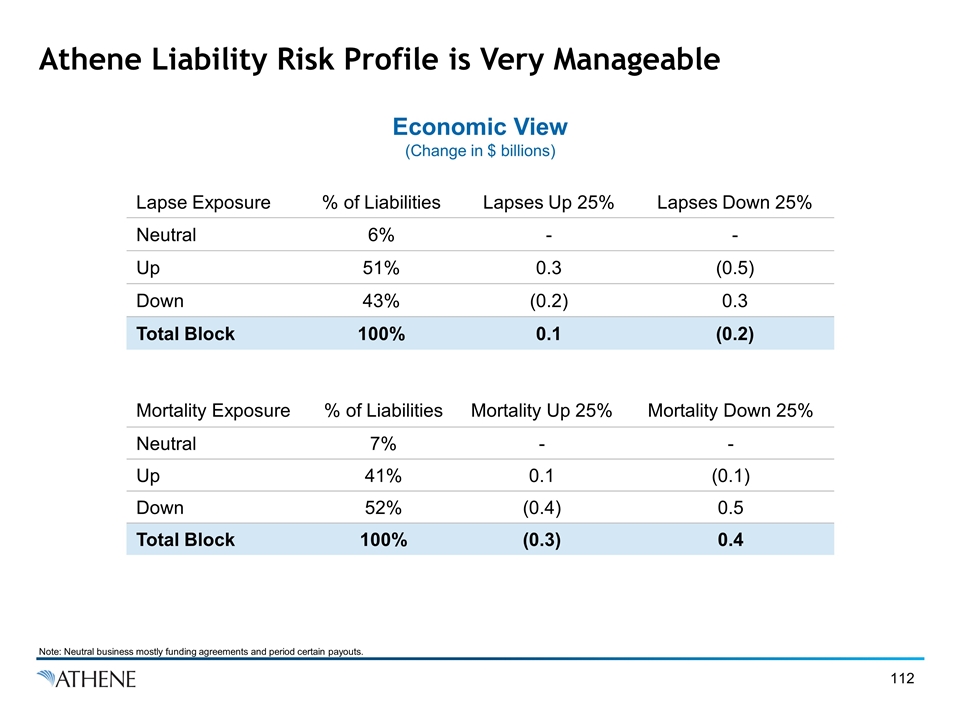
Athene Liability Risk Profile is Very Manageable Economic View (Change in $ billions) Lapse Exposure % of Liabilities Lapses Up 25% Lapses Down 25% Neutral 6% - - Up 51% 0.3 (0.5) Down 43% (0.2) 0.3 Total Block 100% 0.1 (0.2) Mortality Exposure % of Liabilities Mortality Up 25% Mortality Down 25% Neutral 7% - - Up 41% 0.1 (0.1) Down 52% (0.4) 0.5 Total Block 100% (0.3) 0.4 Note: Neutral business mostly funding agreements and period certain payouts.
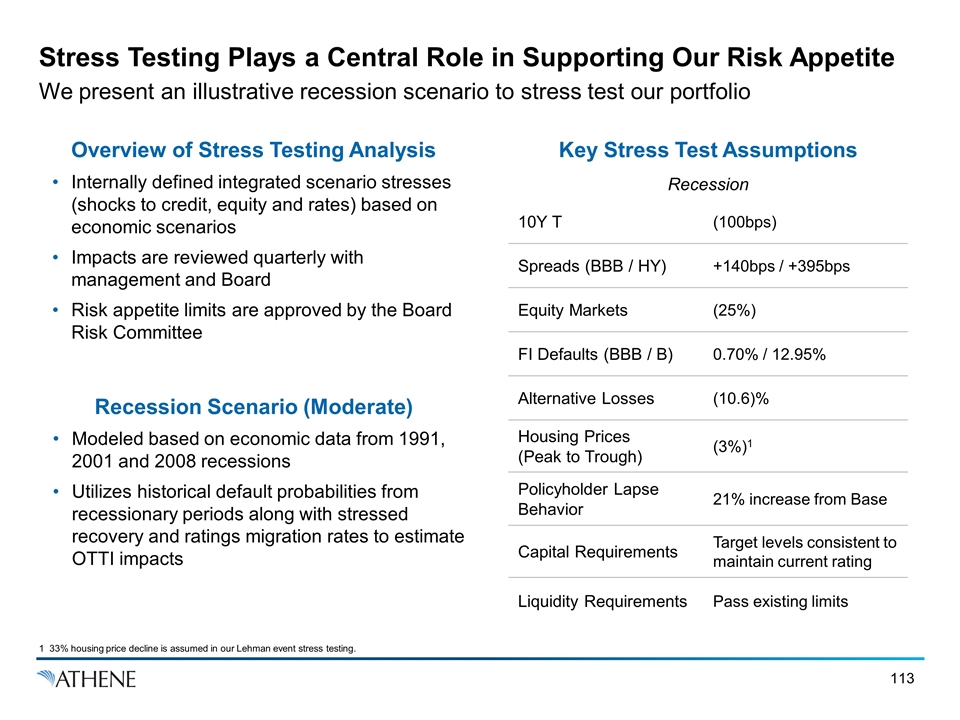
Stress Testing Plays a Central Role in Supporting Our Risk Appetite We present an illustrative recession scenario to stress test our portfolio Key Stress Test Assumptions Overview of Stress Testing Analysis Internally defined integrated scenario stresses (shocks to credit, equity and rates) based on economic scenarios Impacts are reviewed quarterly with management and Board Risk appetite limits are approved by the Board Risk Committee Recession Scenario (Moderate) Modeled based on economic data from 1991, 2001 and 2008 recessions Utilizes historical default probabilities from recessionary periods along with stressed recovery and ratings migration rates to estimate OTTI impacts Recession 10Y T (100bps) Spreads (BBB / HY) +140bps / +395bps Equity Markets (25%) FI Defaults (BBB / B) 0.70% / 12.95% Alternative Losses (10.6)% Housing Prices (Peak to Trough) (3%)1 Policyholder Lapse Behavior 21% increase from Base Capital Requirements Target levels consistent to maintain current rating Liquidity Requirements Pass existing limits 1 33% housing price decline is assumed in our Lehman event stress testing.
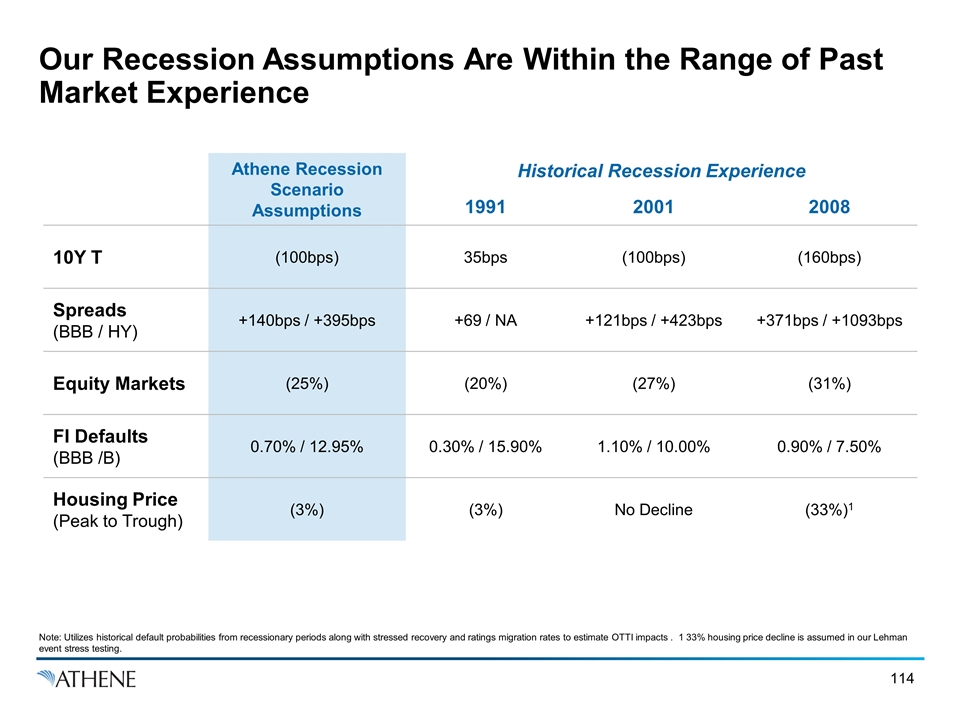
Our Recession Assumptions Are Within the Range of Past Market Experience Athene Recession Scenario Assumptions Historical Recession Experience 1991 2001 2008 10Y T (100bps) 35bps (100bps) (160bps) Spreads (BBB / HY) +140bps / +395bps +69 / NA +121bps / +423bps +371bps / +1093bps Equity Markets (25%) (20%) (27%) (31%) FI Defaults (BBB /B) 0.70% / 12.95% 0.30% / 15.90% 1.10% / 10.00% 0.90% / 7.50% Housing Price (Peak to Trough) (3%) (3%) No Decline (33%)1 Note: Utilizes historical default probabilities from recessionary periods along with stressed recovery and ratings migration rates to estimate OTTI impacts . 1 33% housing price decline is assumed in our Lehman event stress testing.
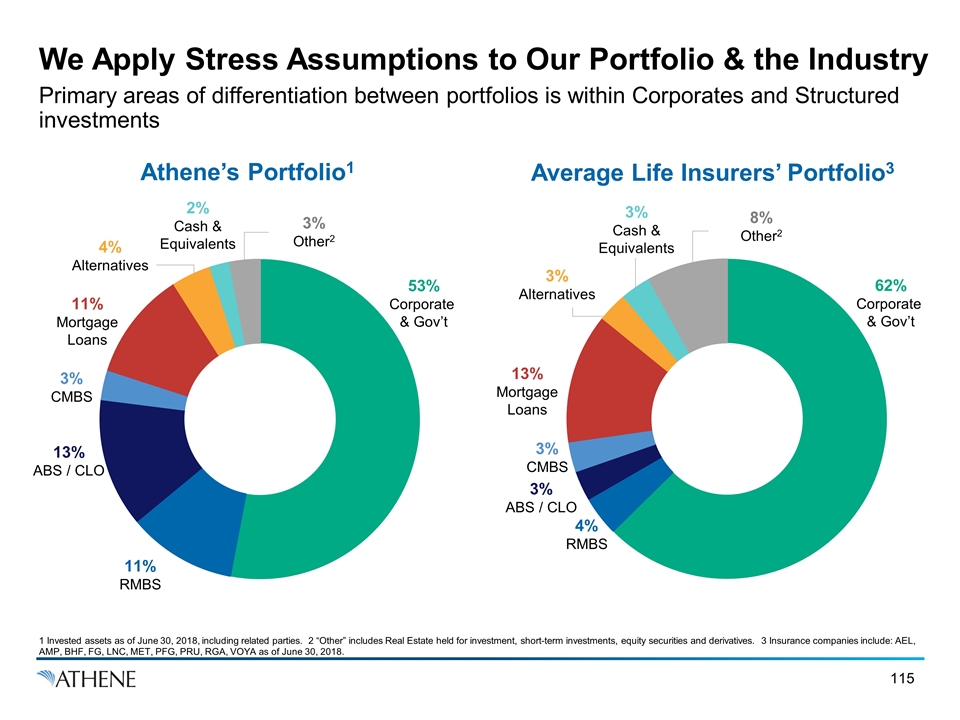
We Apply Stress Assumptions to Our Portfolio & the Industry Primary areas of differentiation between portfolios is within Corporates and Structured investments Athene’s Portfolio1 Average Life Insurers’ Portfolio3 1 Invested assets as of June 30, 2018, including related parties. 2 “Other” includes Real Estate held for investment, short-term investments, equity securities and derivatives. 3 Insurance companies include: AEL, AMP, BHF, FG, LNC, MET, PFG, PRU, RGA, VOYA as of June 30, 2018. 11% RMBS 13% ABS / CLO 3% CMBS 11% Mortgage Loans 4% Alternatives 2% Cash & Equivalents 53% Corporate & Gov’t 3% Other2 4% RMBS 3% ABS / CLO 3% CMBS 62% Corporate & Gov’t 8% Other2 13% Mortgage Loans 3% Alternatives 3% Cash & Equivalents
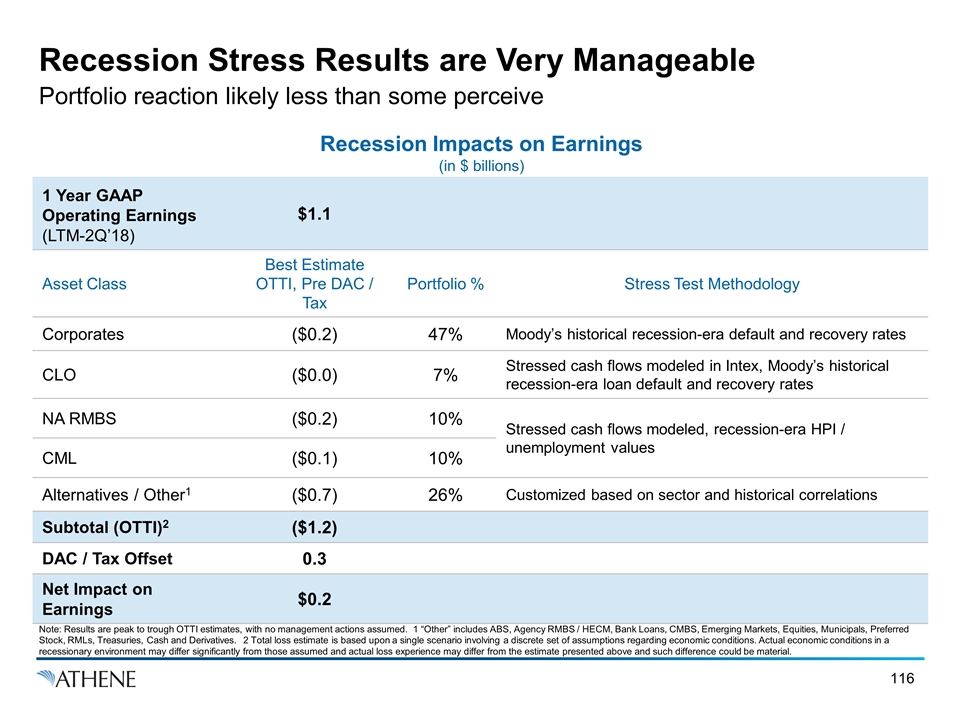
Recession Stress Results are Very Manageable Portfolio reaction likely less than some perceive Recession Impacts on Earnings (in $ billions) 1 Year GAAP Operating Earnings (LTM-2Q’18) $1.1 Asset Class Best Estimate OTTI, Pre DAC / Tax Portfolio % Stress Test Methodology Corporates ($0.2) 47% Moody’s historical recession-era default and recovery rates CLO ($0.0) 7% Stressed cash flows modeled in Intex, Moody’s historical recession-era loan default and recovery rates NA RMBS ($0.2) 10% Stressed cash flows modeled, recession-era HPI / unemployment values CML ($0.1) 10% Alternatives / Other1 ($0.7) 26% Customized based on sector and historical correlations Subtotal (OTTI)2 ($1.2) DAC / Tax Offset 0.3 Net Impact on Earnings $0.2 Note: Results are peak to trough OTTI estimates, with no management actions assumed. 1 “Other” includes ABS, Agency RMBS / HECM, Bank Loans, CMBS, Emerging Markets, Equities, Municipals, Preferred Stock, RMLs, Treasuries, Cash and Derivatives. 2 Total loss estimate is based upon a single scenario involving a discrete set of assumptions regarding economic conditions. Actual economic conditions in a recessionary environment may differ significantly from those assumed and actual loss experience may differ from the estimate presented above and such difference could be material.
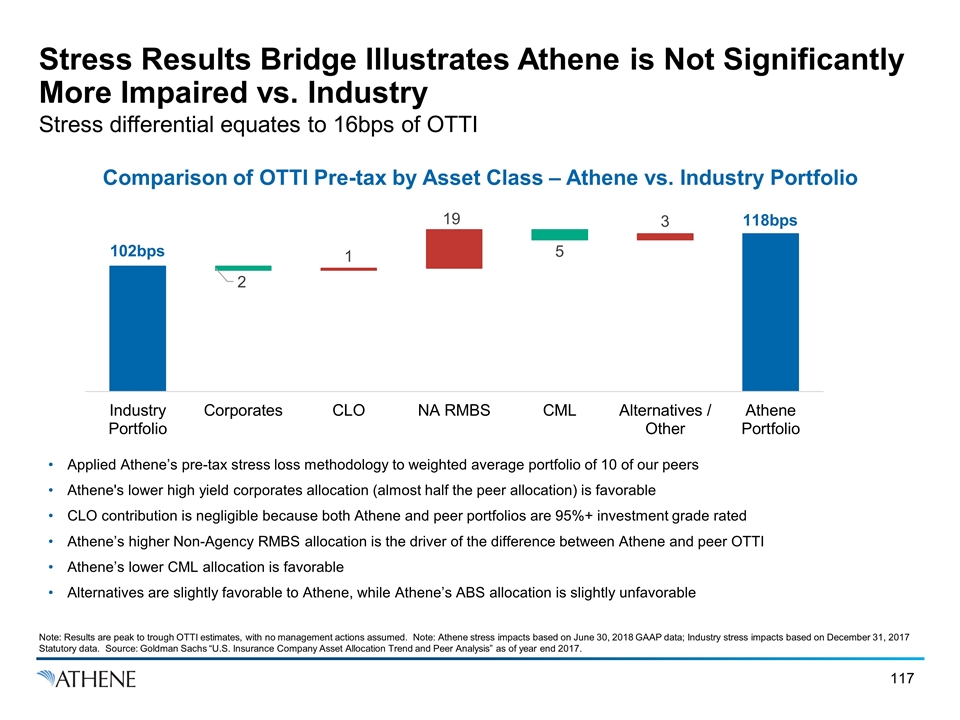
Stress Results Bridge Illustrates Athene is Not Significantly More Impaired vs. Industry Stress differential equates to 16bps of OTTI Comparison of OTTI Pre-tax by Asset Class – Athene vs. Industry Portfolio 102bps 118bps Note: Results are peak to trough OTTI estimates, with no management actions assumed. Note: Athene stress impacts based on June 30, 2018 GAAP data; Industry stress impacts based on December 31, 2017 Statutory data. Source: Goldman Sachs “U.S. Insurance Company Asset Allocation Trend and Peer Analysis” as of year end 2017. Applied Athene’s pre-tax stress loss methodology to weighted average portfolio of 10 of our peers Athene's lower high yield corporates allocation (almost half the peer allocation) is favorable CLO contribution is negligible because both Athene and peer portfolios are 95%+ investment grade rated Athene’s higher Non-Agency RMBS allocation is the driver of the difference between Athene and peer OTTI Athene’s lower CML allocation is favorable Alternatives are slightly favorable to Athene, while Athene’s ABS allocation is slightly unfavorable
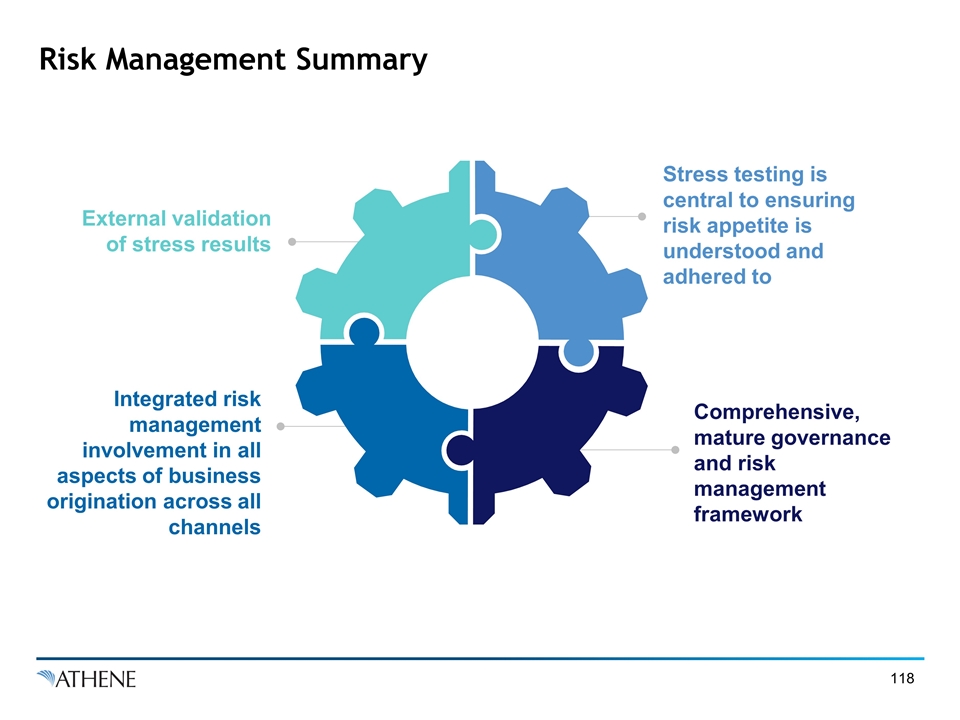
Risk Management Summary External validation of stress results Stress testing is central to ensuring risk appetite is understood and adhered to Comprehensive, mature governance and risk management framework Integrated risk management involvement in all aspects of business origination across all channels

Optimizing Profitability With an Efficient and Scalable Structure Marty Klein
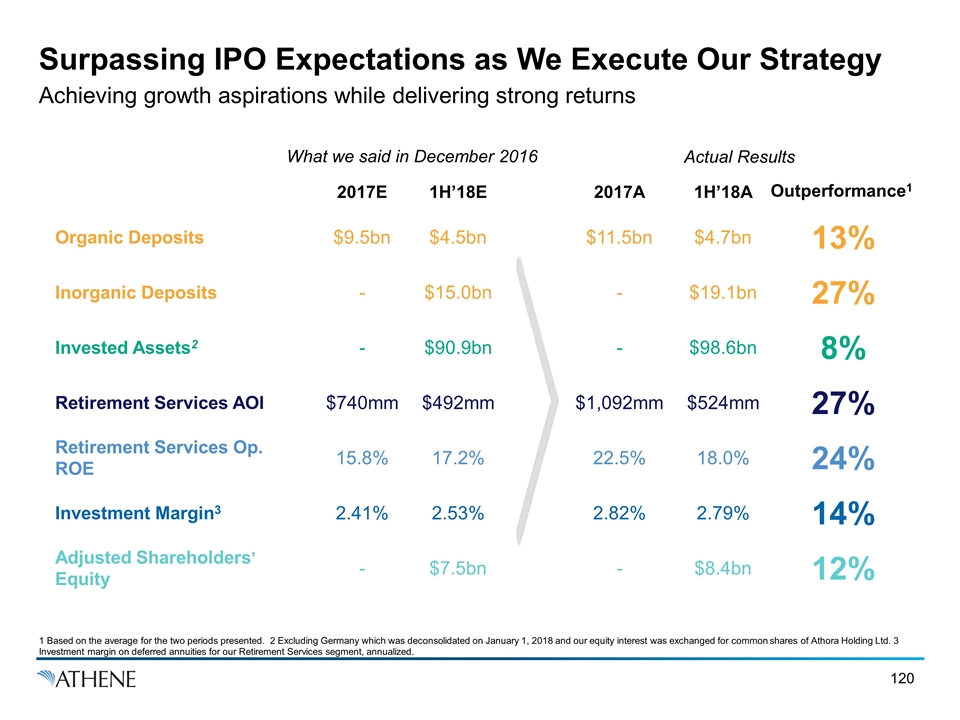
Surpassing IPO Expectations as We Execute Our Strategy Achieving growth aspirations while delivering strong returns Actual Results 2017E 1H’18E 2017A 1H’18A Organic Deposits $9.5bn $4.5bn $11.5bn $4.7bn 13% Inorganic Deposits - $15.0bn - $19.1bn 27% Invested Assets2 - $90.9bn - $98.6bn 8% Retirement Services AOI $740mm $492mm $1,092mm $524mm 27% Retirement Services Op. ROE 15.8% 17.2% 22.5% 18.0% 24% Investment Margin3 2.41% 2.53% 2.82% 2.79% 14% Adjusted Shareholders’ Equity - $7.5bn - $8.4bn 12% Outperformance1 1 Based on the average for the two periods presented. 2 Excluding Germany which was deconsolidated on January 1, 2018 and our equity interest was exchanged for common shares of Athora Holding Ltd. 3 Investment margin on deferred annuities for our Retirement Services segment, annualized. What we said in December 2016
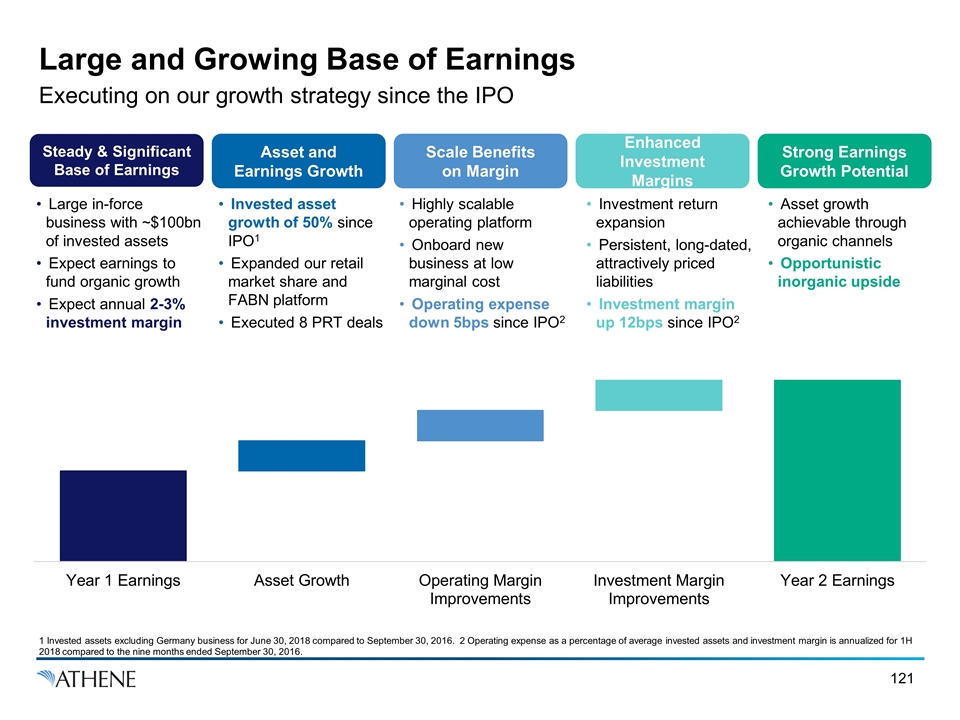
Large and Growing Base of Earnings Executing on our growth strategy since the IPO Large in-force business with ~$100bn of invested assets Expect earnings to fund organic growth Expect annual 2-3% investment margin Invested asset growth of 50% since IPO1 Expanded our retail market share and FABN platform Executed 8 PRT deals Highly scalable operating platform Onboard new business at low marginal cost Operating expense down 5bps since IPO2 Investment return expansion Persistent, long-dated, attractively priced liabilities Investment margin up 12bps since IPO2 Asset growth achievable through organic channels Opportunistic inorganic upside Steady & Significant Base of Earnings Asset and Earnings Growth Enhanced Investment Margins Strong Earnings Growth Potential Scale Benefits on Margin 1 Invested assets excluding Germany business for June 30, 2018 compared to September 30, 2016. 2 Operating expense as a percentage of average invested assets and investment margin is annualized for 1H 2018 compared to the nine months ended September 30, 2016.
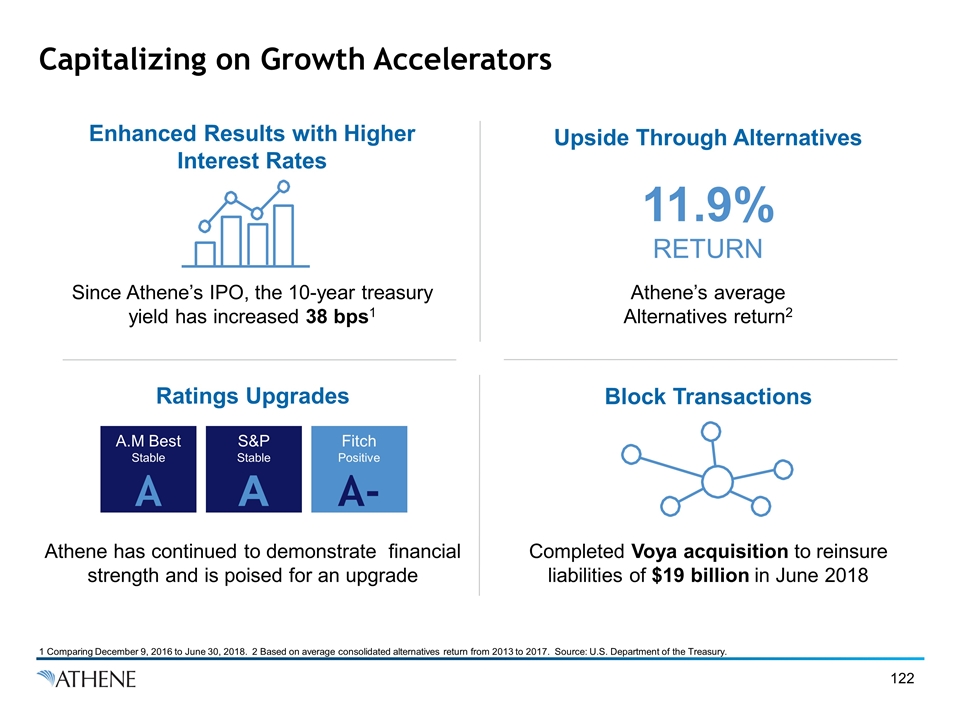
Capitalizing on Growth Accelerators Upside Through Alternatives Ratings Upgrades Block Transactions Enhanced Results with Higher Interest Rates Since Athene’s IPO, the 10-year treasury yield has increased 38 bps1 Athene’s average Alternatives return2 11.9% RETURN Athene has continued to demonstrate financial strength and is poised for an upgrade Completed Voya acquisition to reinsure liabilities of $19 billion in June 2018 A.M Best Stable A S&P Stable A Fitch Positive A- 1 Comparing December 9, 2016 to June 30, 2018. 2 Based on average consolidated alternatives return from 2013 to 2017. Source: U.S. Department of the Treasury.
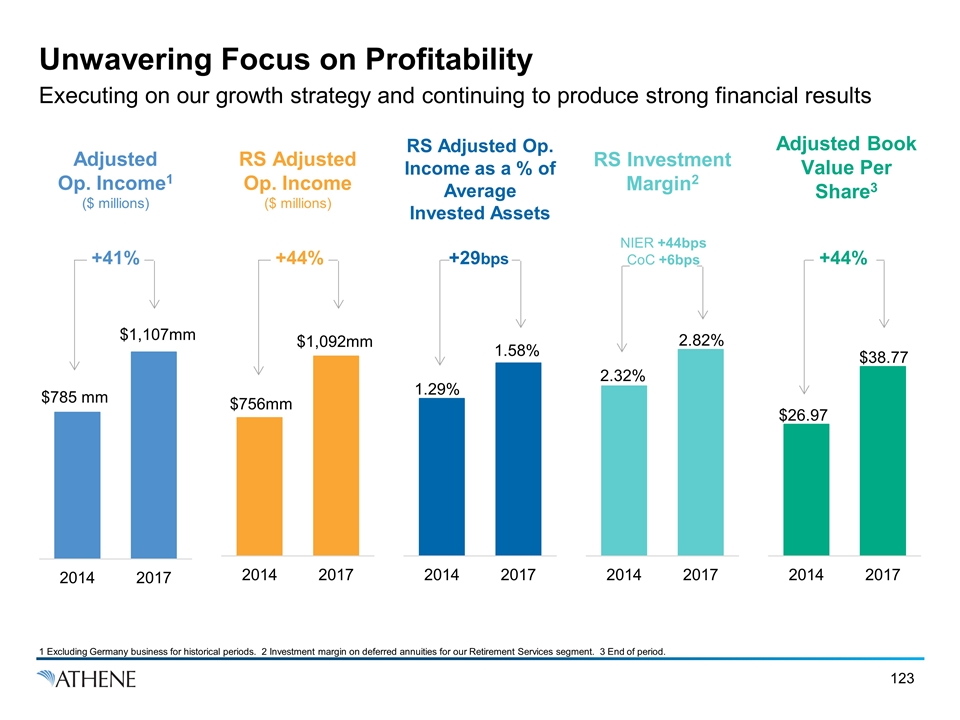
Unwavering Focus on Profitability Executing on our growth strategy and continuing to produce strong financial results 1 Excluding Germany business for historical periods. 2 Investment margin on deferred annuities for our Retirement Services segment. 3 End of period. Adjusted Op. Income1 ($ millions) RS Adjusted Op. Income as a % of Average Invested Assets RS Investment Margin2 RS Adjusted Op. Income ($ millions) Adjusted Book Value Per Share3 $1,107mm +41% +44% +29bps NIER +44bps CoC +6bps +44%
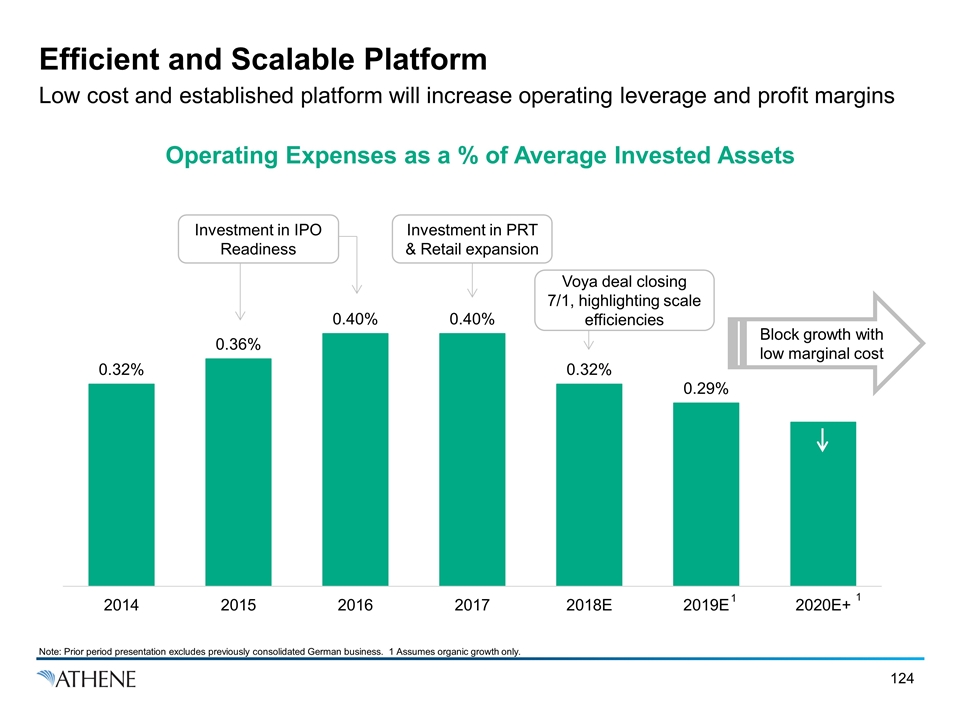
Efficient and Scalable Platform Low cost and established platform will increase operating leverage and profit margins Operating Expenses as a % of Average Invested Assets Investment in IPO Readiness Investment in PRT & Retail expansion Voya deal closing 7/1, highlighting scale efficiencies Block growth with low marginal cost Note: Prior period presentation excludes previously consolidated German business. 1 Assumes organic growth only. 1 1
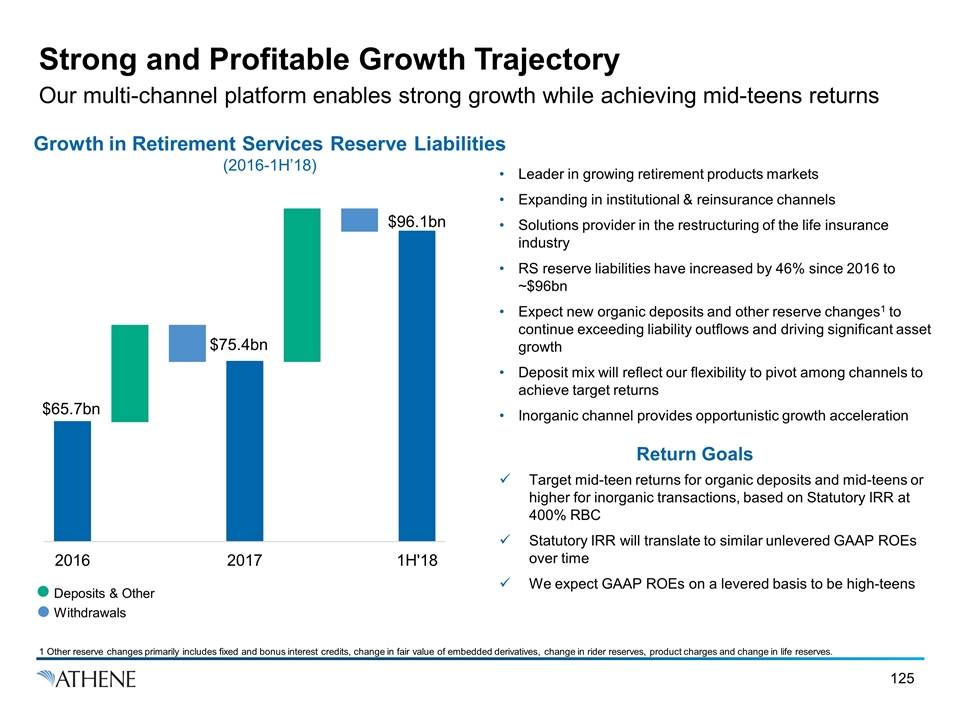
Strong and Profitable Growth Trajectory Our multi-channel platform enables strong growth while achieving mid-teens returns Growth in Retirement Services Reserve Liabilities (2016-1H’18) 1 Other reserve changes primarily includes fixed and bonus interest credits, change in fair value of embedded derivatives, change in rider reserves, product charges and change in life reserves. Leader in growing retirement products markets Expanding in institutional & reinsurance channels Solutions provider in the restructuring of the life insurance industry RS reserve liabilities have increased by 46% since 2016 to ~$96bn Expect new organic deposits and other reserve changes1 to continue exceeding liability outflows and driving significant asset growth Deposit mix will reflect our flexibility to pivot among channels to achieve target returns Inorganic channel provides opportunistic growth acceleration Return Goals Target mid-teen returns for organic deposits and mid-teens or higher for inorganic transactions, based on Statutory IRR at 400% RBC Statutory IRR will translate to similar unlevered GAAP ROEs over time We expect GAAP ROEs on a levered basis to be high-teens
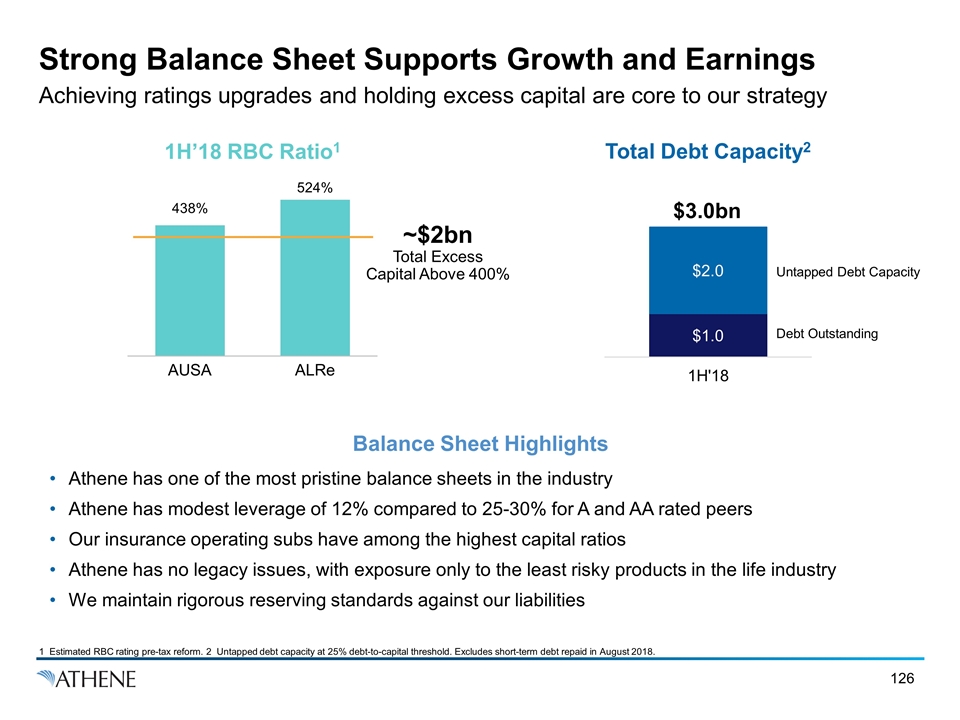
Strong Balance Sheet Supports Growth and Earnings Achieving ratings upgrades and holding excess capital are core to our strategy 1H’18 RBC Ratio1 Total Debt Capacity2 Balance Sheet Highlights Athene has one of the most pristine balance sheets in the industry Athene has modest leverage of 12% compared to 25-30% for A and AA rated peers Our insurance operating subs have among the highest capital ratios Athene has no legacy issues, with exposure only to the least risky products in the life industry We maintain rigorous reserving standards against our liabilities ~$2bn Total Excess Capital Above 400% $3.0bn Debt Outstanding 1 Estimated RBC rating pre-tax reform. 2 Untapped debt capacity at 25% debt-to-capital threshold. Excludes short-term debt repaid in August 2018.
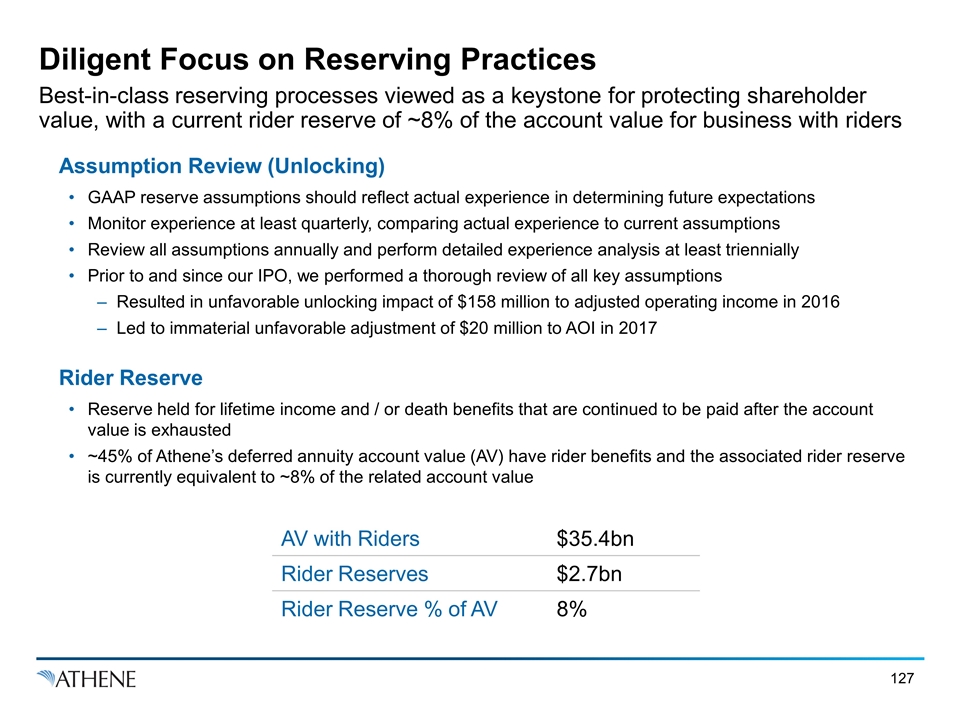
Diligent Focus on Reserving Practices Best-in-class reserving processes viewed as a keystone for protecting shareholder value, with a current rider reserve of ~8% of the account value for business with riders Rider Reserve Reserve held for lifetime income and / or death benefits that are continued to be paid after the account value is exhausted ~45% of Athene’s deferred annuity account value (AV) have rider benefits and the associated rider reserve is currently equivalent to ~8% of the related account value AV with Riders $35.4bn Rider Reserves $2.7bn Rider Reserve % of AV 8% Assumption Review (Unlocking) GAAP reserve assumptions should reflect actual experience in determining future expectations Monitor experience at least quarterly, comparing actual experience to current assumptions Review all assumptions annually and perform detailed experience analysis at least triennially Prior to and since our IPO, we performed a thorough review of all key assumptions Resulted in unfavorable unlocking impact of $158 million to adjusted operating income in 2016 Led to immaterial unfavorable adjustment of $20 million to AOI in 2017
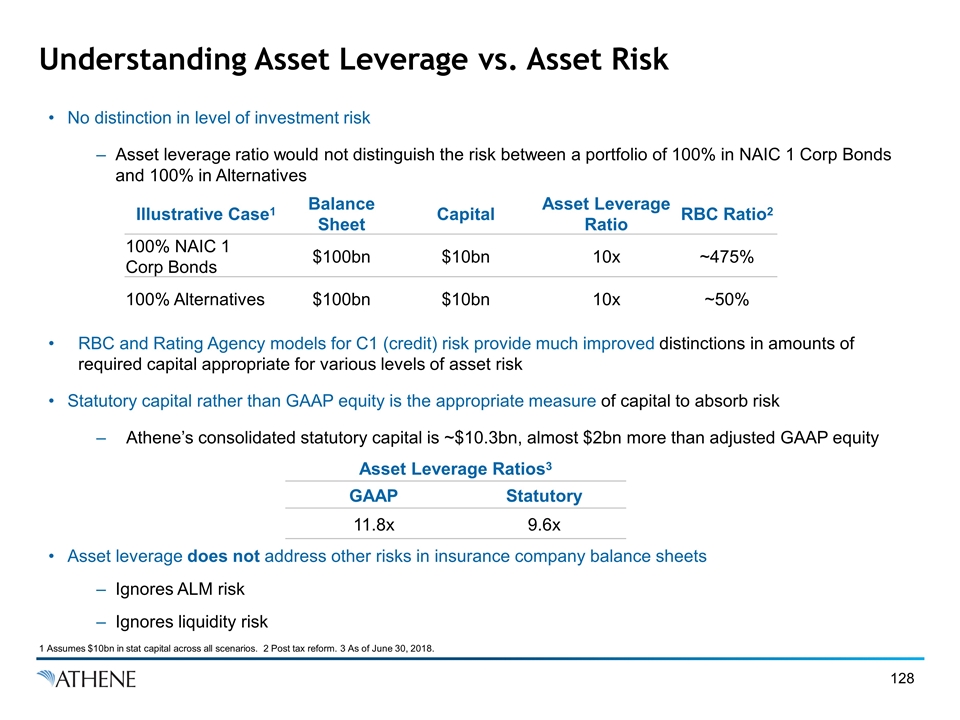
Understanding Asset Leverage vs. Asset Risk No distinction in level of investment risk Asset leverage ratio would not distinguish the risk between a portfolio of 100% in NAIC 1 Corp Bonds and 100% in Alternatives RBC and Rating Agency models for C1 (credit) risk provide much improved distinctions in amounts of required capital appropriate for various levels of asset risk Statutory capital rather than GAAP equity is the appropriate measure of capital to absorb risk Athene’s consolidated statutory capital is ~$10.3bn, almost $2bn more than adjusted GAAP equity Asset leverage does not address other risks in insurance company balance sheets Ignores ALM risk Ignores liquidity risk Illustrative Case1 Balance Sheet Capital Asset Leverage Ratio RBC Ratio2 100% NAIC 1 Corp Bonds $100bn $10bn 10x ~475% 100% Alternatives $100bn $10bn 10x ~50% 1 Assumes $10bn in stat capital across all scenarios. 2 Post tax reform. 3 As of June 30, 2018. Asset Leverage Ratios3 GAAP Statutory 11.8x 9.6x
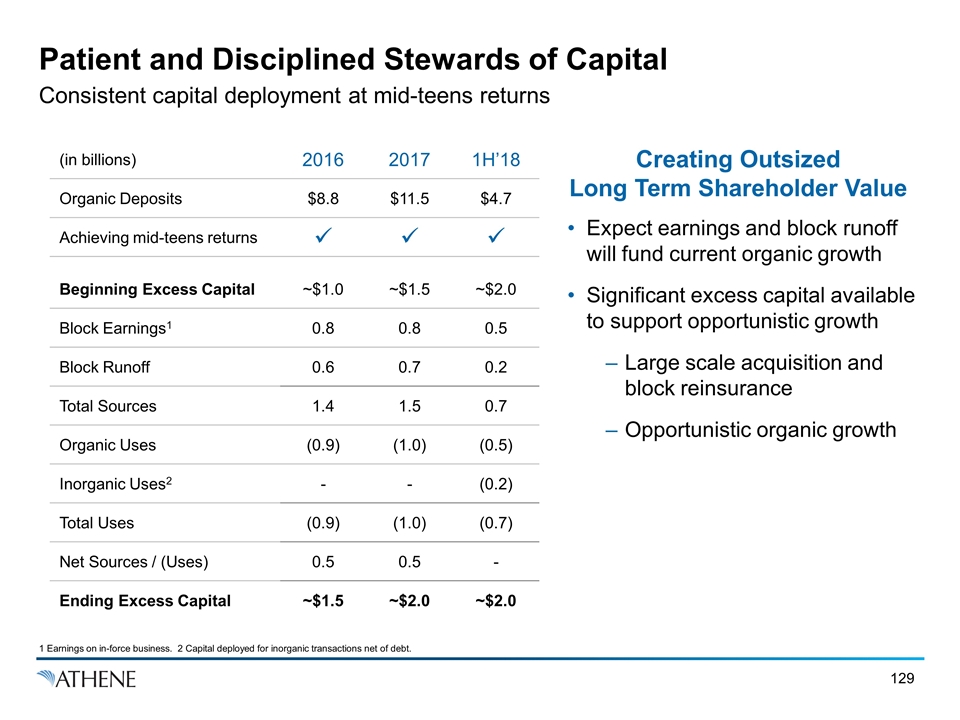
Patient and Disciplined Stewards of Capital Consistent capital deployment at mid-teens returns (in billions) 2016 2017 1H’18 Organic Deposits $8.8 $11.5 $4.7 Achieving mid-teens returns ü ü ü Beginning Excess Capital ~$1.0 ~$1.5 ~$2.0 Block Earnings1 0.8 0.8 0.5 Block Runoff 0.6 0.7 0.2 Total Sources 1.4 1.5 0.7 Organic Uses (0.9) (1.0) (0.5) Inorganic Uses2 - - (0.2) Total Uses (0.9) (1.0) (0.7) Net Sources / (Uses) 0.5 0.5 - Ending Excess Capital ~$1.5 ~$2.0 ~$2.0 Creating Outsized Long Term Shareholder Value Expect earnings and block runoff will fund current organic growth Significant excess capital available to support opportunistic growth Large scale acquisition and block reinsurance Opportunistic organic growth 1 Earnings on in-force business. 2 Capital deployed for inorganic transactions net of debt.
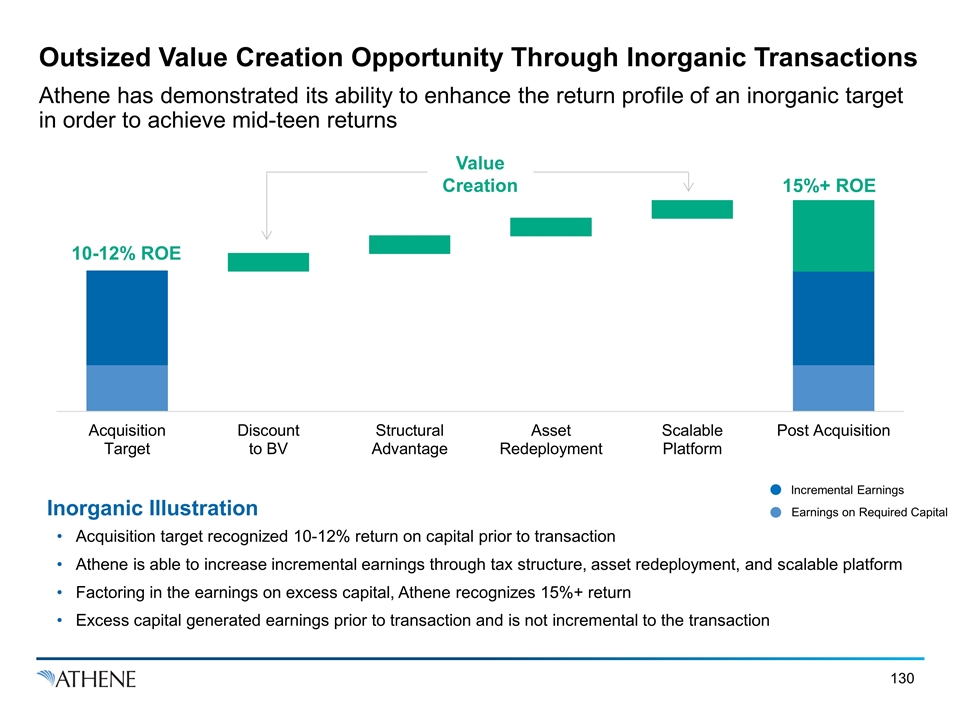
Outsized Value Creation Opportunity Through Inorganic Transactions Athene has demonstrated its ability to enhance the return profile of an inorganic target in order to achieve mid-teen returns Incremental Earnings Earnings on Required Capital Inorganic Illustration Acquisition target recognized 10-12% return on capital prior to transaction Athene is able to increase incremental earnings through tax structure, asset redeployment, and scalable platform Factoring in the earnings on excess capital, Athene recognizes 15%+ return Excess capital generated earnings prior to transaction and is not incremental to the transaction 15%+ ROE Value Creation 10-12% ROE
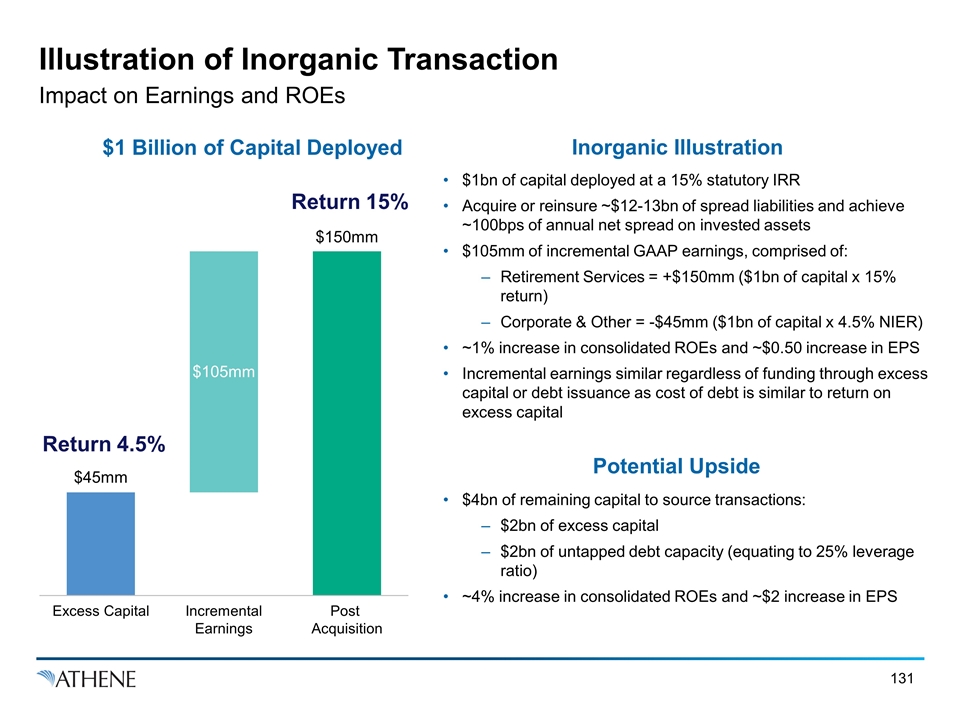
Illustration of Inorganic Transaction Impact on Earnings and ROEs $1 Billion of Capital Deployed Inorganic Illustration Potential Upside $1bn of capital deployed at a 15% statutory IRR Acquire or reinsure ~$12-13bn of spread liabilities and achieve ~100bps of annual net spread on invested assets $105mm of incremental GAAP earnings, comprised of: Retirement Services = +$150mm ($1bn of capital x 15% return) Corporate & Other = -$45mm ($1bn of capital x 4.5% NIER) ~1% increase in consolidated ROEs and ~$0.50 increase in EPS Incremental earnings similar regardless of funding through excess capital or debt issuance as cost of debt is similar to return on excess capital $4bn of remaining capital to source transactions: $2bn of excess capital $2bn of untapped debt capacity (equating to 25% leverage ratio) ~4% increase in consolidated ROEs and ~$2 increase in EPS Excess Capital Return 4.5% Return 15%
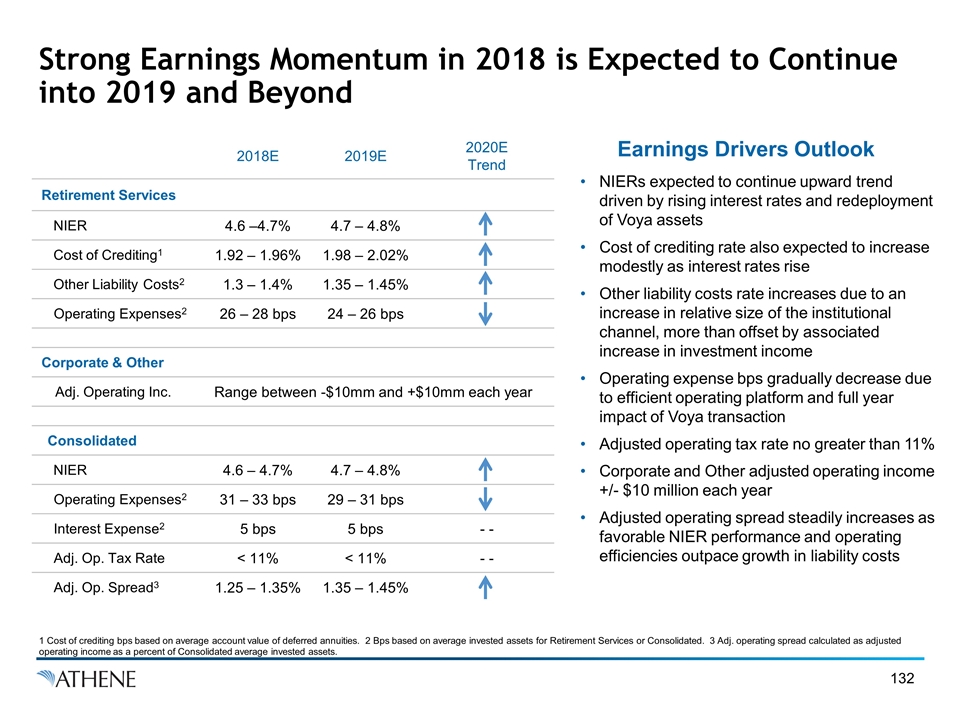
Strong Earnings Momentum in 2018 is Expected to Continue into 2019 and Beyond NIERs expected to continue upward trend driven by rising interest rates and redeployment of Voya assets Cost of crediting rate also expected to increase modestly as interest rates rise Other liability costs rate increases due to an increase in relative size of the institutional channel, more than offset by associated increase in investment income Operating expense bps gradually decrease due to efficient operating platform and full year impact of Voya transaction Adjusted operating tax rate no greater than 11% Corporate and Other adjusted operating income +/- $10 million each year Adjusted operating spread steadily increases as favorable NIER performance and operating efficiencies outpace growth in liability costs Earnings Drivers Outlook 2018E 2019E 2020E Trend Retirement Services NIER 4.6 –4.7% 4.7 – 4.8% Cost of Crediting1 1.92 – 1.96% 1.98 – 2.02% Other Liability Costs2 1.3 – 1.4% 1.35 – 1.45% Operating Expenses2 26 – 28 bps 24 – 26 bps Corporate & Other Adj. Operating Inc. Range between -$10mm and +$10mm each year Consolidated NIER 4.6 – 4.7% 4.7 – 4.8% Operating Expenses2 31 – 33 bps 29 – 31 bps Interest Expense2 5 bps 5 bps - - Adj. Op. Tax Rate < 11% < 11% - - Adj. Op. Spread3 1.25 – 1.35% 1.35 – 1.45% 1 Cost of crediting bps based on average account value of deferred annuities. 2 Bps based on average invested assets for Retirement Services or Consolidated. 3 Adj. operating spread calculated as adjusted operating income as a percent of Consolidated average invested assets.

Attractive ROE Production & Prudent Capital Management Drive Shareholder Value Jim Belardi
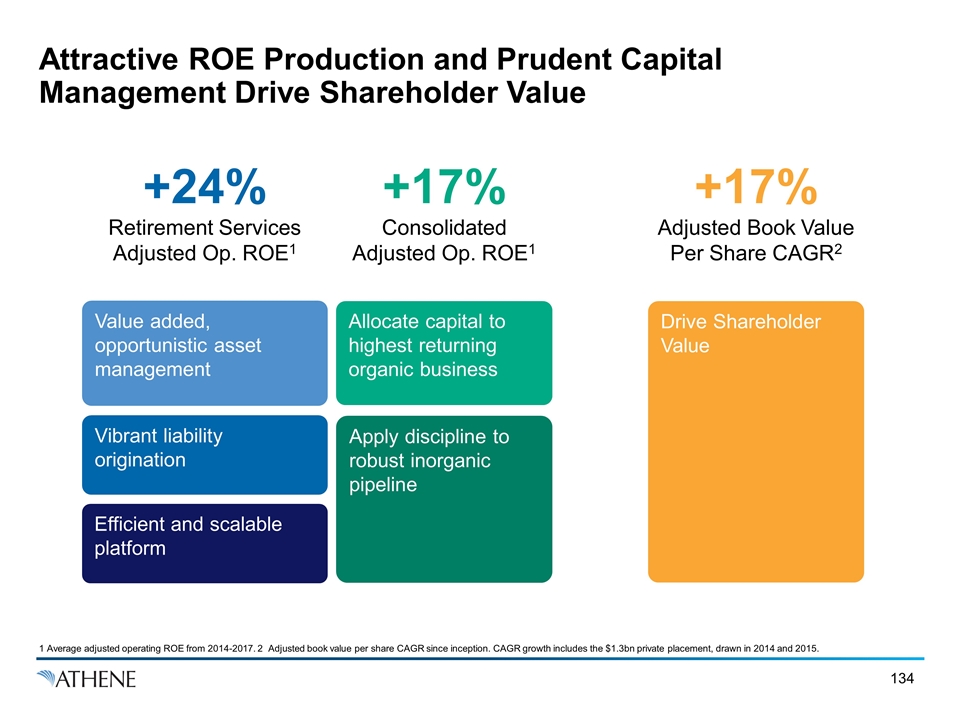
Attractive ROE Production and Prudent Capital Management Drive Shareholder Value 1 Average adjusted operating ROE from 2014-2017. 2 Adjusted book value per share CAGR since inception. CAGR growth includes the $1.3bn private placement, drawn in 2014 and 2015. Value added, opportunistic asset management Apply discipline to robust inorganic pipeline Vibrant liability origination Efficient and scalable platform +24% Retirement Services Adjusted Op. ROE1 Allocate capital to highest returning organic business Drive Shareholder Value +17% Adjusted Book Value Per Share CAGR2 +17% Consolidated Adjusted Op. ROE1
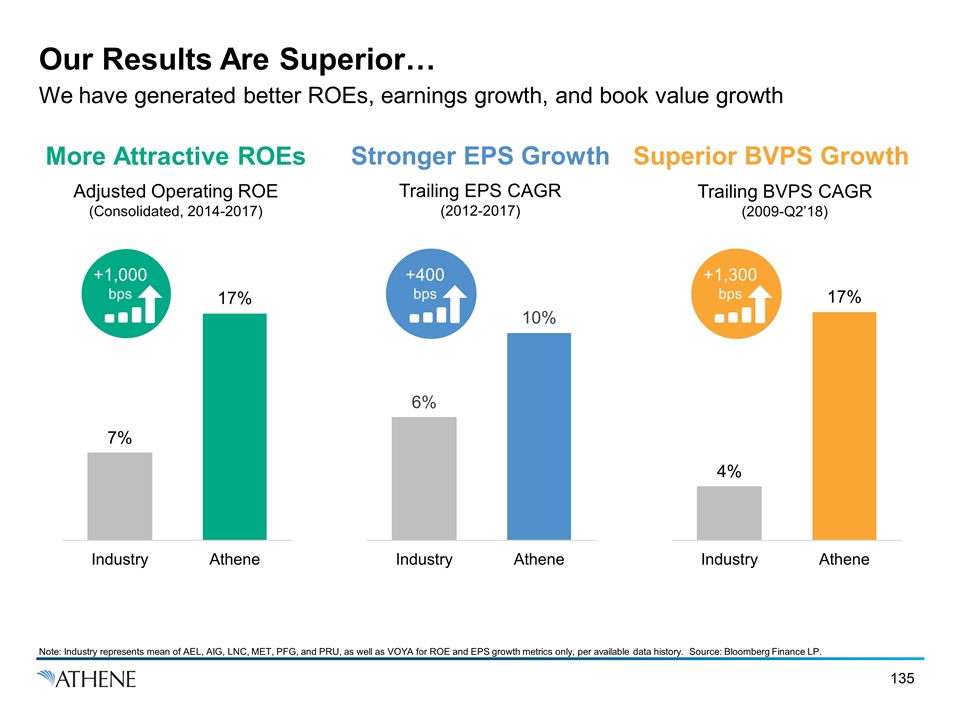
Our Results Are Superior… We have generated better ROEs, earnings growth, and book value growth More Attractive ROEs Stronger EPS Growth Superior BVPS Growth Note: Industry represents mean of AEL, AIG, LNC, MET, PFG, and PRU, as well as VOYA for ROE and EPS growth metrics only, per available data history. Source: Bloomberg Finance LP. Adjusted Operating ROE (Consolidated, 2014-2017) Trailing EPS CAGR (2012-2017) Trailing BVPS CAGR (2009-Q2’18) +1,000 bps +400 bps +1,300 bps
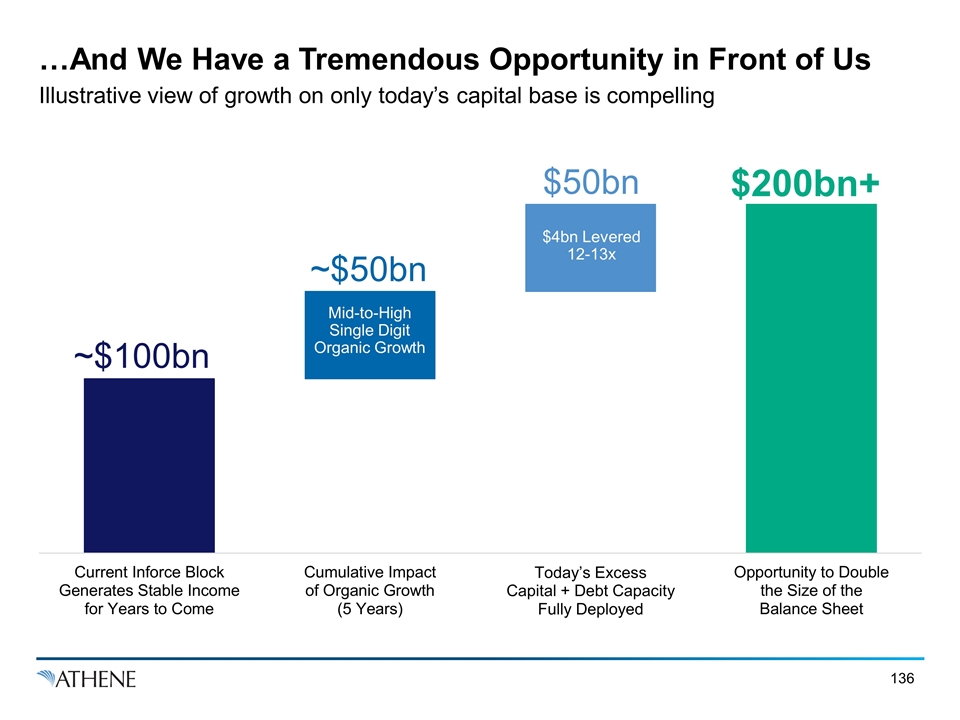
…And We Have a Tremendous Opportunity in Front of Us Illustrative view of growth on only today’s capital base is compelling Mid-to-High Single Digit Organic Growth $4bn Levered 12-13x ~$100bn ~$50bn $50bn $200bn+
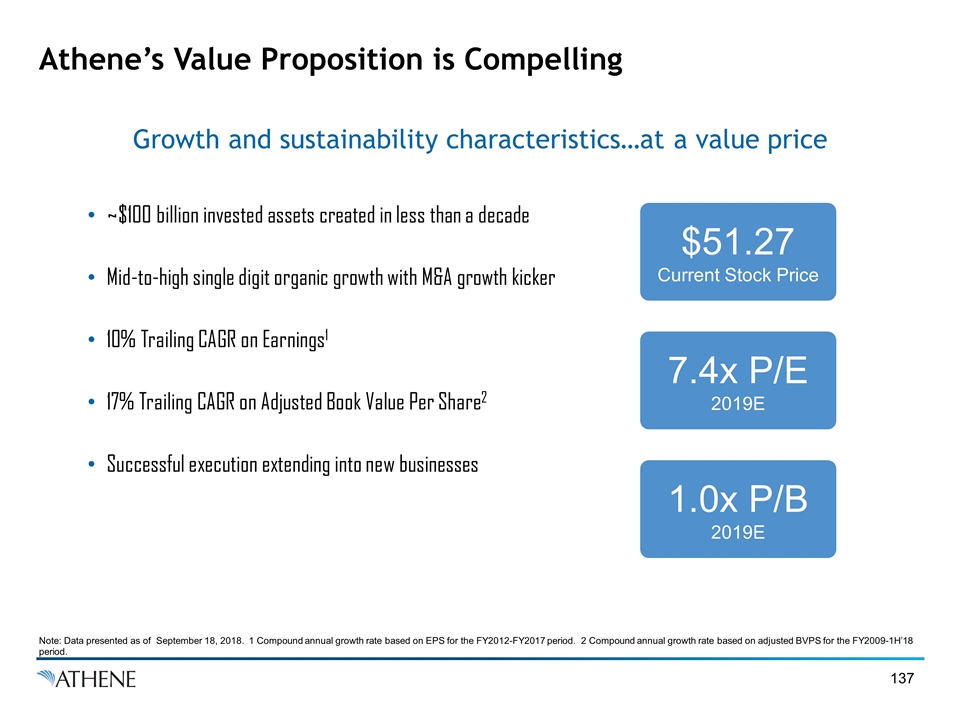
Athene’s Value Proposition is Compelling Growth and sustainability characteristics…at a value price Note: Data presented as of September 18, 2018. 1 Compound annual growth rate based on EPS for the FY2012-FY2017 period. 2 Compound annual growth rate based on adjusted BVPS for the FY2009-1H’18 period. ~$100 billion invested assets created in less than a decade Mid-to-high single digit organic growth with M&A growth kicker 10% Trailing CAGR on Earnings1 17% Trailing CAGR on Adjusted Book Value Per Share2 Successful execution extending into new businesses $51.27 Current Stock Price 7.4x P/E 2019E 1.0x P/B 2019E
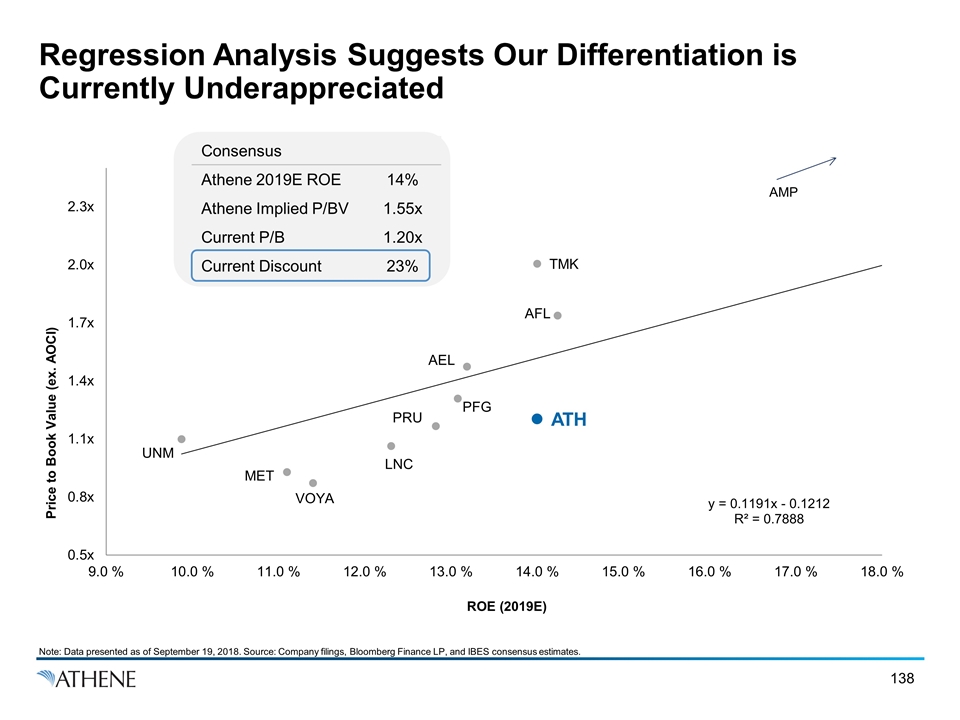
Regression Analysis Suggests Our Differentiation is Currently Underappreciated Consensus Athene 2019E ROE 14% Athene Implied P/BV 1.55x Current P/B 1.20x Current Discount 23% Note: Data presented as of September 19, 2018. Source: Company filings, Bloomberg Finance LP, and IBES consensus estimates.
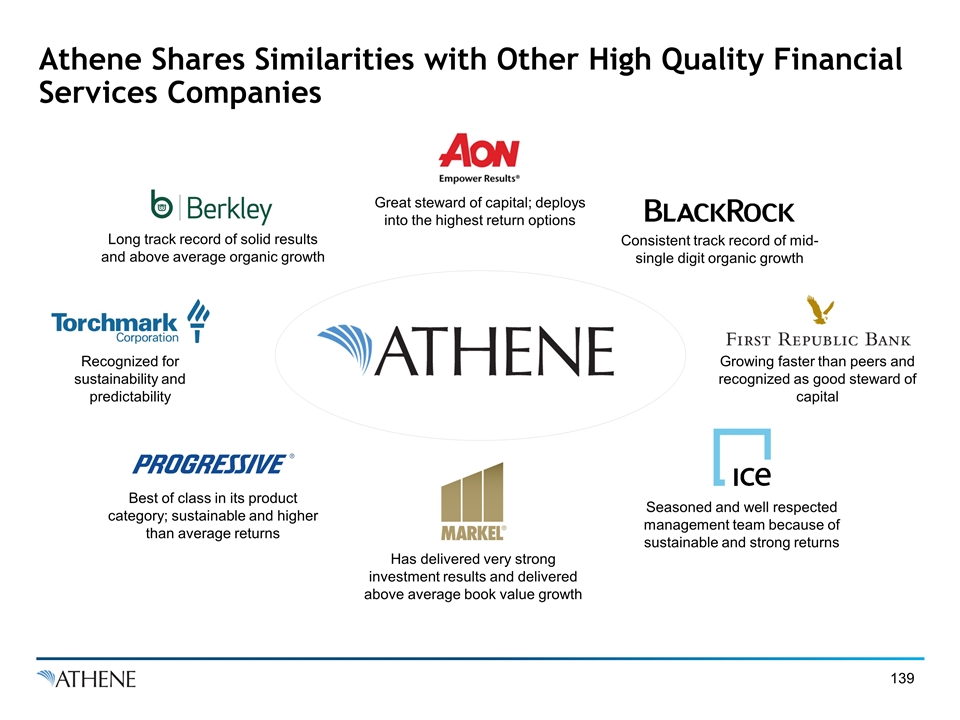
Athene Shares Similarities with Other High Quality Financial Services Companies Long track record of solid results and above average organic growth Recognized for sustainability and predictability Best of class in its product category; sustainable and higher than average returns Has delivered very strong investment results and delivered above average book value growth Seasoned and well respected management team because of sustainable and strong returns Growing faster than peers and recognized as good steward of capital Consistent track record of mid-single digit organic growth Great steward of capital; deploys into the highest return options
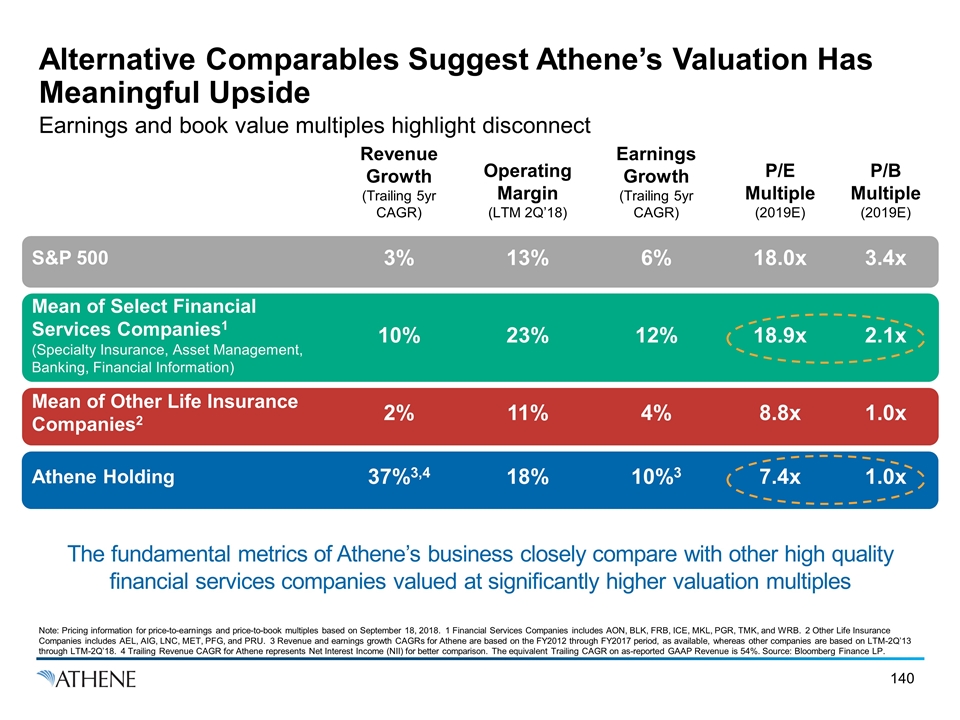
Alternative Comparables Suggest Athene’s Valuation Has Meaningful Upside Earnings and book value multiples highlight disconnect The fundamental metrics of Athene’s business closely compare with other high quality financial services companies valued at significantly higher valuation multiples Note: Pricing information for price-to-earnings and price-to-book multiples based on September 18, 2018. 1 Financial Services Companies includes AON, BLK, FRB, ICE, MKL, PGR, TMK, and WRB. 2 Other Life Insurance Companies includes AEL, AIG, LNC, MET, PFG, and PRU. 3 Revenue and earnings growth CAGRs for Athene are based on the FY2012 through FY2017 period, as available, whereas other companies are based on LTM-2Q’13 through LTM-2Q’18. 4 Trailing Revenue CAGR for Athene represents Net Interest Income (NII) for better comparison. The equivalent Trailing CAGR on as-reported GAAP Revenue is 54%. Source: Bloomberg Finance LP. Revenue Growth (Trailing 5yr CAGR) Operating Margin (LTM 2Q’18) Earnings Growth (Trailing 5yr CAGR) P/E Multiple (2019E) P/B Multiple (2019E) S&P 500 3% 13% 6% 18.0x 3.4x Mean of Select Financial Services Companies1 (Specialty Insurance, Asset Management, Banking, Financial Information) 10% 23% 12% 18.9x 2.1x Mean of Other Life Insurance Companies2 2% 11% 4% 8.8x 1.0x Athene Holding 37%3,4 18% 10%3 7.4x 1.0x
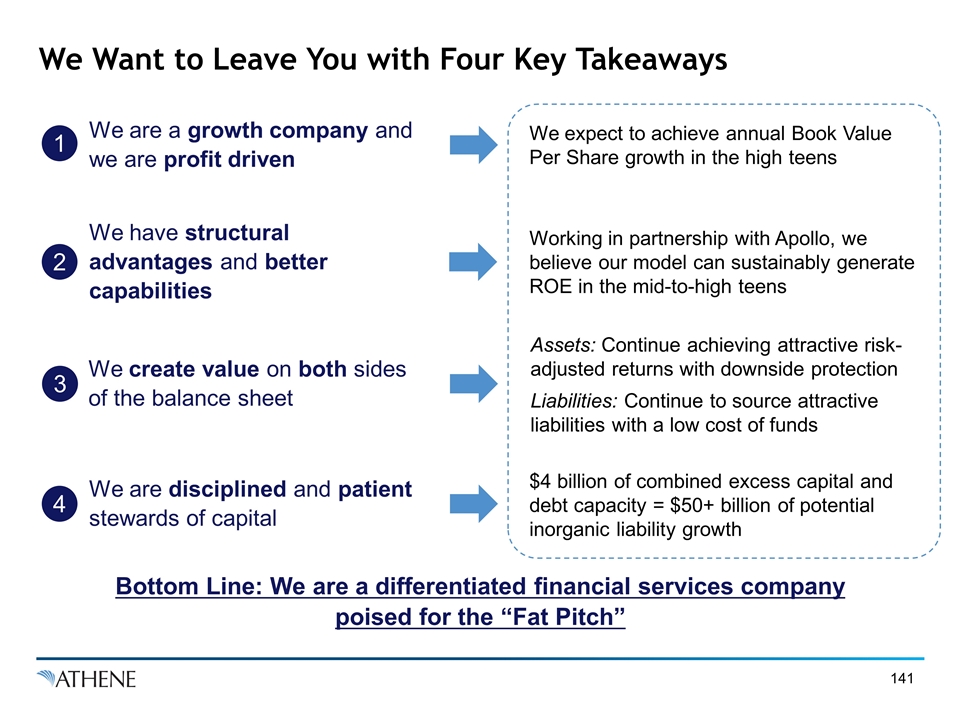
We Want to Leave You with Four Key Takeaways Bottom Line: We are a differentiated financial services company poised for the “Fat Pitch” We create value on both sides of the balance sheet We are disciplined and patient stewards of capital We have structural advantages and better capabilities 3 We are a growth company and we are profit driven 4 2 1 We expect to achieve annual Book Value Per Share growth in the high teens Working in partnership with Apollo, we believe our model can sustainably generate ROE in the mid-to-high teens $4 billion of combined excess capital and debt capacity = $50+ billion of potential inorganic liability growth Assets: Continue achieving attractive risk-adjusted returns with downside protection Liabilities: Continue to source attractive liabilities with a low cost of funds

Management Q&A Panel

Appendix
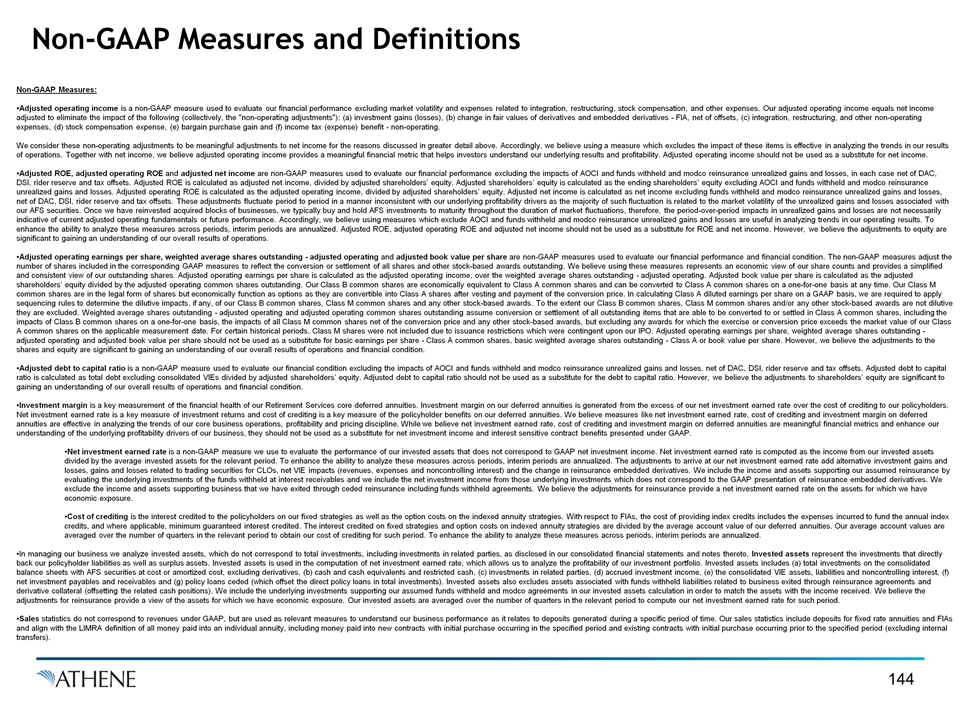
Non-GAAP Measures and Definitions Non-GAAP Measures: Adjusted operating income is a non-GAAP measure used to evaluate our financial performance excluding market volatility and expenses related to integration, restructuring, stock compensation, and other expenses. Our adjusted operating income equals net income adjusted to eliminate the impact of the following (collectively, the "non-operating adjustments"): (a) investment gains (losses), (b) change in fair values of derivatives and embedded derivatives - FIA, net of offsets, (c) integration, restructuring, and other non-operating expenses, (d) stock compensation expense, (e) bargain purchase gain and (f) income tax (expense) benefit - non-operating. We consider these non-operating adjustments to be meaningful adjustments to net income for the reasons discussed in greater detail above. Accordingly, we believe using a measure which excludes the impact of these items is effective in analyzing the trends in our results of operations. Together with net income, we believe adjusted operating income provides a meaningful financial metric that helps investors understand our underlying results and profitability. Adjusted operating income should not be used as a substitute for net income. Adjusted ROE, adjusted operating ROE and adjusted net income are non-GAAP measures used to evaluate our financial performance excluding the impacts of AOCI and funds withheld and modco reinsurance unrealized gains and losses, in each case net of DAC, DSI, rider reserve and tax offsets. Adjusted ROE is calculated as adjusted net income, divided by adjusted shareholders’ equity. Adjusted shareholders’ equity is calculated as the ending shareholders’ equity excluding AOCI and funds withheld and modco reinsurance unrealized gains and losses. Adjusted operating ROE is calculated as the adjusted operating income, divided by adjusted shareholders’ equity. Adjusted net income is calculated as net income excluding funds withheld and modco reinsurance unrealized gains and losses, net of DAC, DSI, rider reserve and tax offsets. These adjustments fluctuate period to period in a manner inconsistent with our underlying profitability drivers as the majority of such fluctuation is related to the market volatility of the unrealized gains and losses associated with our AFS securities. Once we have reinvested acquired blocks of businesses, we typically buy and hold AFS investments to maturity throughout the duration of market fluctuations, therefore, the period-over-period impacts in unrealized gains and losses are not necessarily indicative of current adjusted operating fundamentals or future performance. Accordingly, we believe using measures which exclude AOCI and funds withheld and modco reinsurance unrealized gains and losses are useful in analyzing trends in our operating results. To enhance the ability to analyze these measures across periods, interim periods are annualized. Adjusted ROE, adjusted operating ROE and adjusted net income should not be used as a substitute for ROE and net income. However, we believe the adjustments to equity are significant to gaining an understanding of our overall results of operations. Adjusted operating earnings per share, weighted average shares outstanding - adjusted operating and adjusted book value per share are non-GAAP measures used to evaluate our financial performance and financial condition. The non-GAAP measures adjust the number of shares included in the corresponding GAAP measures to reflect the conversion or settlement of all shares and other stock-based awards outstanding. We believe using these measures represents an economic view of our share counts and provides a simplified and consistent view of our outstanding shares. Adjusted operating earnings per share is calculated as the adjusted operating income, over the weighted average shares outstanding - adjusted operating. Adjusted book value per share is calculated as the adjusted shareholders’ equity divided by the adjusted operating common shares outstanding. Our Class B common shares are economically equivalent to Class A common shares and can be converted to Class A common shares on a one-for-one basis at any time. Our Class M common shares are in the legal form of shares but economically function as options as they are convertible into Class A shares after vesting and payment of the conversion price. In calculating Class A diluted earnings per share on a GAAP basis, we are required to apply sequencing rules to determine the dilutive impacts, if any, of our Class B common shares, Class M common shares and any other stock-based awards. To the extent our Class B common shares, Class M common shares and/or any other stock-based awards are not dilutive they are excluded. Weighted average shares outstanding - adjusted operating and adjusted operating common shares outstanding assume conversion or settlement of all outstanding items that are able to be converted to or settled in Class A common shares, including the impacts of Class B common shares on a one-for-one basis, the impacts of all Class M common shares net of the conversion price and any other stock-based awards, but excluding any awards for which the exercise or conversion price exceeds the market value of our Class A common shares on the applicable measurement date. For certain historical periods, Class M shares were not included due to issuance restrictions which were contingent upon our IPO. Adjusted operating earnings per share, weighted average shares outstanding - adjusted operating and adjusted book value per share should not be used as a substitute for basic earnings per share - Class A common shares, basic weighted average shares outstanding - Class A or book value per share. However, we believe the adjustments to the shares and equity are significant to gaining an understanding of our overall results of operations and financial condition. Adjusted debt to capital ratio is a non-GAAP measure used to evaluate our financial condition excluding the impacts of AOCI and funds withheld and modco reinsurance unrealized gains and losses, net of DAC, DSI, rider reserve and tax offsets. Adjusted debt to capital ratio is calculated as total debt excluding consolidated VIEs divided by adjusted shareholders’ equity. Adjusted debt to capital ratio should not be used as a substitute for the debt to capital ratio. However, we believe the adjustments to shareholders’ equity are significant to gaining an understanding of our overall results of operations and financial condition. Investment margin is a key measurement of the financial health of our Retirement Services core deferred annuities. Investment margin on our deferred annuities is generated from the excess of our net investment earned rate over the cost of crediting to our policyholders. Net investment earned rate is a key measure of investment returns and cost of crediting is a key measure of the policyholder benefits on our deferred annuities. We believe measures like net investment earned rate, cost of crediting and investment margin on deferred annuities are effective in analyzing the trends of our core business operations, profitability and pricing discipline. While we believe net investment earned rate, cost of crediting and investment margin on deferred annuities are meaningful financial metrics and enhance our understanding of the underlying profitability drivers of our business, they should not be used as a substitute for net investment income and interest sensitive contract benefits presented under GAAP. Net investment earned rate is a non-GAAP measure we use to evaluate the performance of our invested assets that does not correspond to GAAP net investment income. Net investment earned rate is computed as the income from our invested assets divided by the average invested assets for the relevant period. To enhance the ability to analyze these measures across periods, interim periods are annualized. The adjustments to arrive at our net investment earned rate add alternative investment gains and losses, gains and losses related to trading securities for CLOs, net VIE impacts (revenues, expenses and noncontrolling interest) and the change in reinsurance embedded derivatives. We include the income and assets supporting our assumed reinsurance by evaluating the underlying investments of the funds withheld at interest receivables and we include the net investment income from those underlying investments which does not correspond to the GAAP presentation of reinsurance embedded derivatives. We exclude the income and assets supporting business that we have exited through ceded reinsurance including funds withheld agreements. We believe the adjustments for reinsurance provide a net investment earned rate on the assets for which we have economic exposure. Cost of crediting is the interest credited to the policyholders on our fixed strategies as well as the option costs on the indexed annuity strategies. With respect to FIAs, the cost of providing index credits includes the expenses incurred to fund the annual index credits, and where applicable, minimum guaranteed interest credited. The interest credited on fixed strategies and option costs on indexed annuity strategies are divided by the average account value of our deferred annuities. Our average account values are averaged over the number of quarters in the relevant period to obtain our cost of crediting for such period. To enhance the ability to analyze these measures across periods, interim periods are annualized. In managing our business we analyze invested assets, which do not correspond to total investments, including investments in related parties, as disclosed in our consolidated financial statements and notes thereto. Invested assets represent the investments that directly back our policyholder liabilities as well as surplus assets. Invested assets is used in the computation of net investment earned rate, which allows us to analyze the profitability of our investment portfolio. Invested assets includes (a) total investments on the consolidated balance sheets with AFS securities at cost or amortized cost, excluding derivatives, (b) cash and cash equivalents and restricted cash, (c) investments in related parties, (d) accrued investment income, (e) the consolidated VIE assets, liabilities and noncontrolling interest, (f) net investment payables and receivables and (g) policy loans ceded (which offset the direct policy loans in total investments). Invested assets also excludes assets associated with funds withheld liabilities related to business exited through reinsurance agreements and derivative collateral (offsetting the related cash positions). We include the underlying investments supporting our assumed funds withheld and modco agreements in our invested assets calculation in order to match the assets with the income received. We believe the adjustments for reinsurance provide a view of the assets for which we have economic exposure. Our invested assets are averaged over the number of quarters in the relevant period to compute our net investment earned rate for such period. Sales statistics do not correspond to revenues under GAAP, but are used as relevant measures to understand our business performance as it relates to deposits generated during a specific period of time. Our sales statistics include deposits for fixed rate annuities and FIAs and align with the LIMRA definition of all money paid into an individual annuity, including money paid into new contracts with initial purchase occurring in the specified period and existing contracts with initial purchase occurring prior to the specified period (excluding internal transfers).
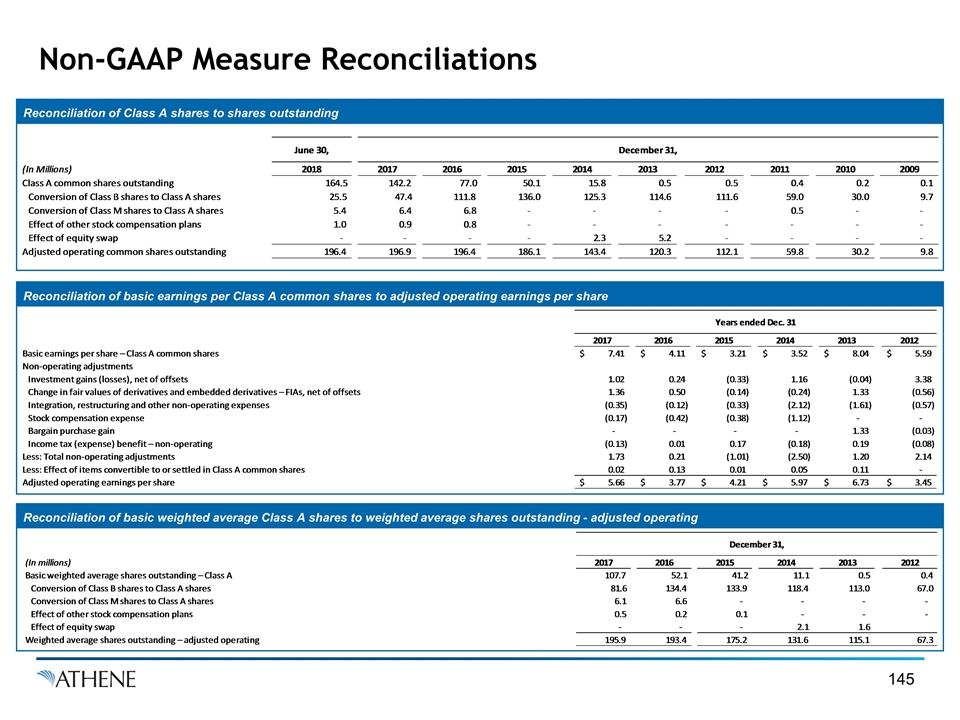
Non-GAAP Measure Reconciliations Reconciliation of Class A shares to shares outstanding Reconciliation of basic weighted average Class A shares to weighted average shares outstanding - adjusted operating Reconciliation of basic earnings per Class A common shares to adjusted operating earnings per share Reconciliation of basic weighted average Class A shares to weighted average shares outstanding - adjusted operating Reconciliation of basic weighted average Class A shares to weighted average shares outstanding - adjusted operating Reconciliation of basic weighted average Class A shares to weighted average shares outstanding - adjusted operating
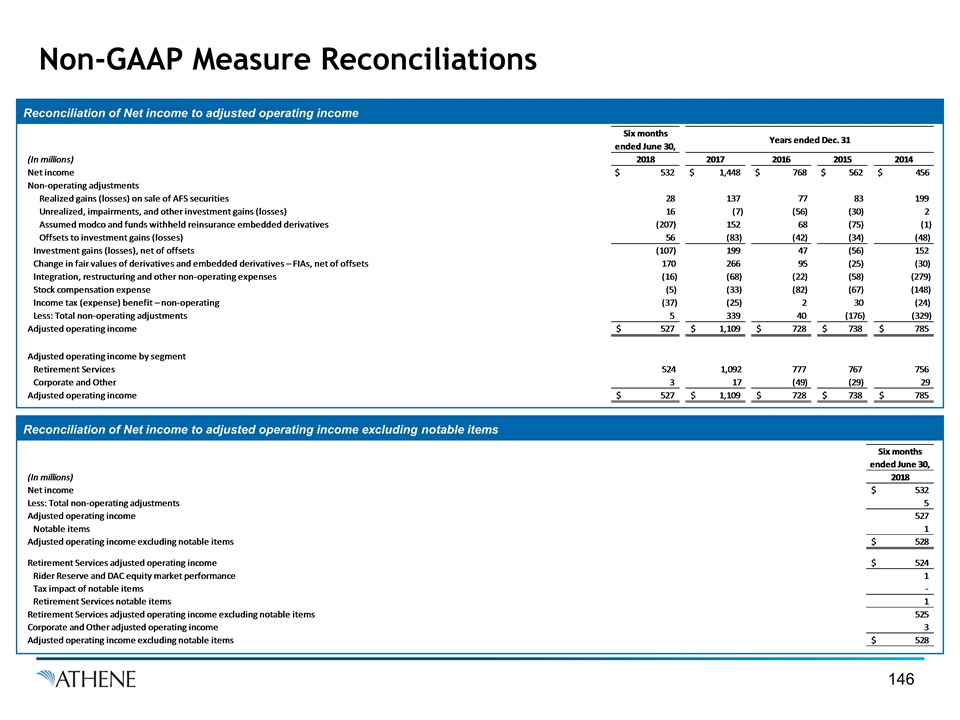
Non-GAAP Measure Reconciliations Reconciliation of Net income to adjusted operating income Reconciliation of basic weighted average Class A shares to weighted average shares outstanding - adjusted operating Reconciliation of Net income to adjusted operating income excluding notable items Reconciliation of basic weighted average Class A shares to weighted average shares outstanding - adjusted operating
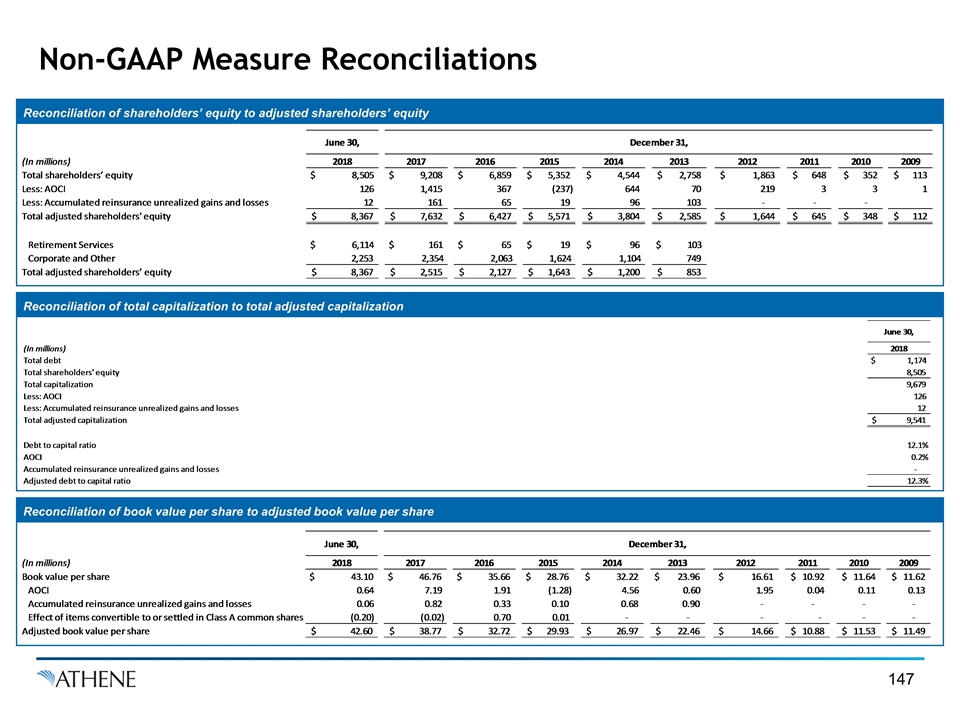
Non-GAAP Measure Reconciliations Reconciliation of shareholders’ equity to adjusted shareholders’ equity Reconciliation of basic weighted average Class A shares to weighted average shares outstanding - adjusted operating Reconciliation of total capitalization to total adjusted capitalization Reconciliation of basic weighted average Class A shares to weighted average shares outstanding - adjusted operating Reconciliation of book value per share to adjusted book value per share Reconciliation of basic weighted average Class A shares to weighted average shares outstanding - adjusted operating
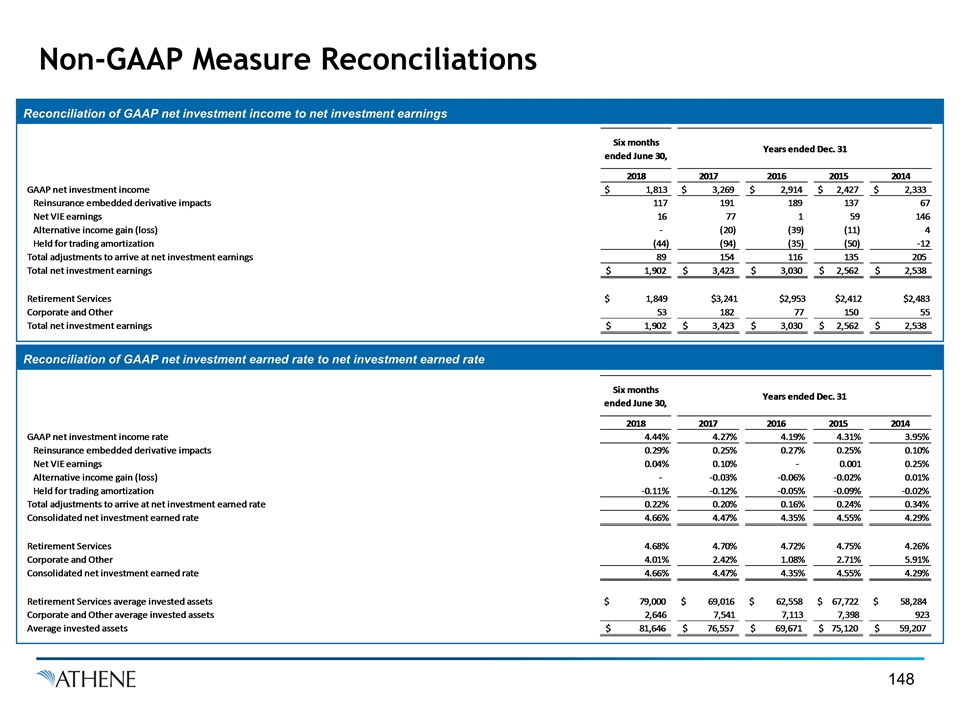
Non-GAAP Measure Reconciliations Reconciliation of GAAP net investment income to net investment earnings Reconciliation of basic weighted average Class A shares to weighted average shares outstanding - adjusted operating Reconciliation of GAAP net investment earned rate to net investment earned rate Reconciliation of basic weighted average Class A shares to weighted average shares outstanding - adjusted operating
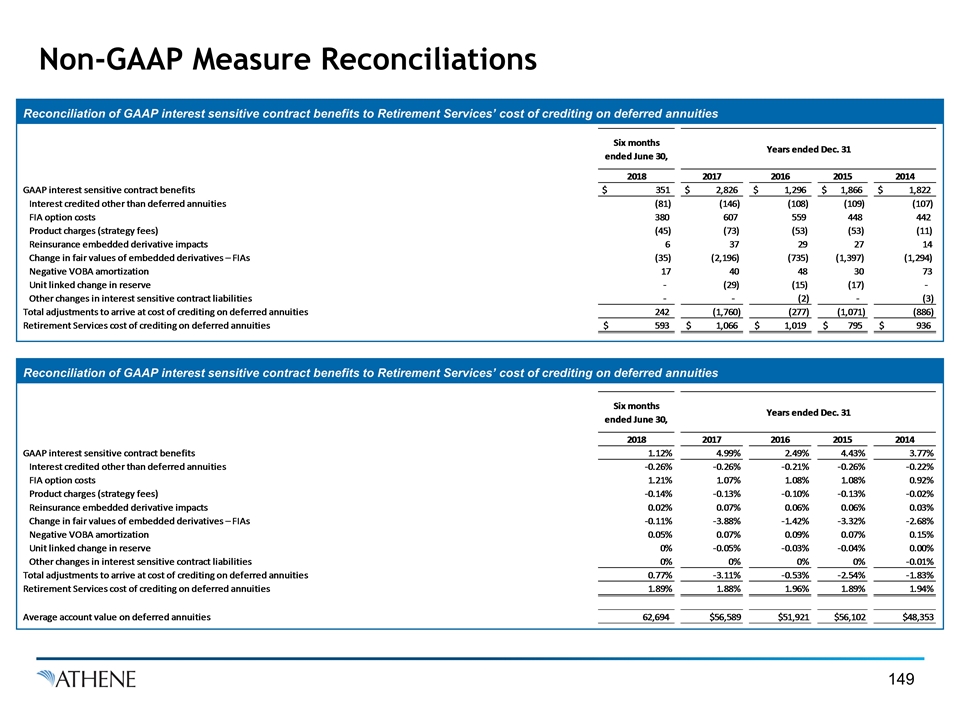
Non-GAAP Measure Reconciliations Reconciliation of GAAP interest sensitive contract benefits to Retirement Services’ cost of crediting on deferred annuities Reconciliation of basic weighted average Class A shares to weighted average shares outstanding - adjusted operating Reconciliation of GAAP interest sensitive contract benefits to Retirement Services’ cost of crediting on deferred annuities Reconciliation of basic weighted average Class A shares to weighted average shares outstanding - adjusted operating
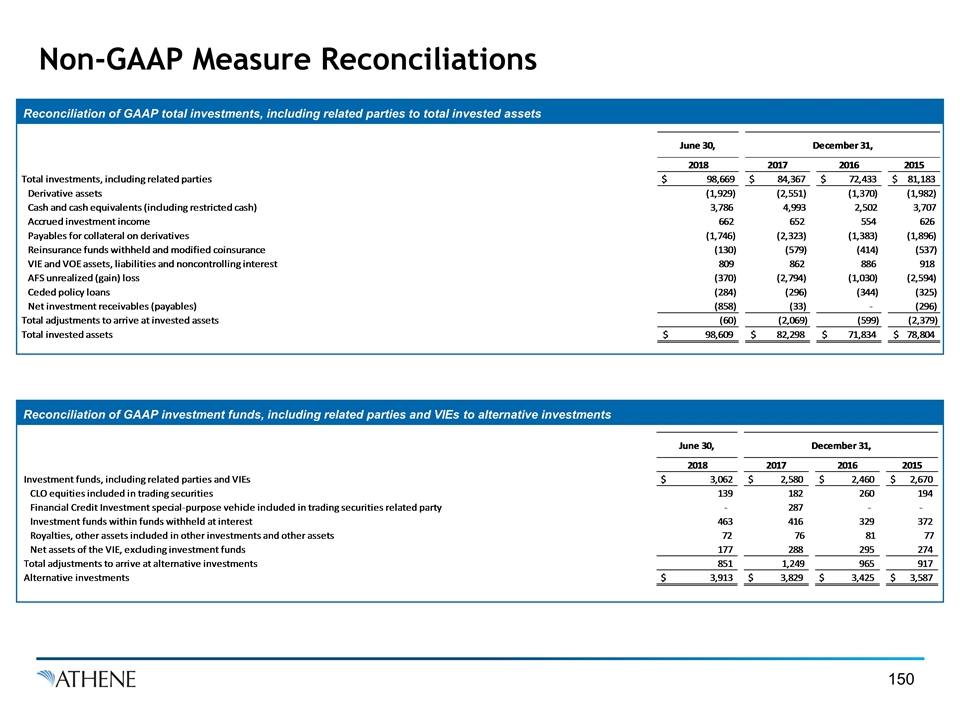
Non-GAAP Measure Reconciliations Reconciliation of GAAP total investments, including related parties to total invested assets Reconciliation of basic weighted average Class A shares to weighted average shares outstanding - adjusted operating Reconciliation of GAAP investment funds, including related parties and VIEs to alternative investments Reconciliation of basic weighted average Class A shares to weighted average shares outstanding - adjusted operating
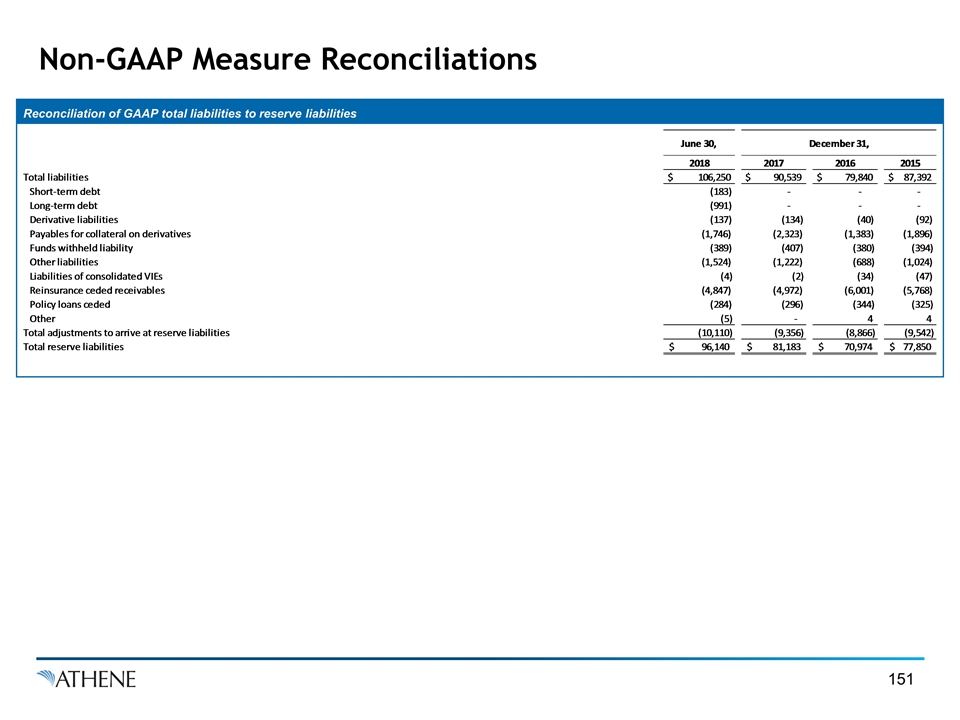
Non-GAAP Measure Reconciliations Reconciliation of GAAP total liabilities to reserve liabilities Reconciliation of basic weighted average Class A shares to weighted average shares outstanding - adjusted operating