425: Filing under Securities Act Rule 425 of certain prospectuses and communications in connection with business combination transactions
Published on October 19, 2021
Filed by Athene Holding Ltd
Pursuant to Rule 425 under the Securities Act of 1933
and deemed filed pursuant to Rule 14a-12
under the Securities Exchange Act of 1934
Subject Company: Athene Holding Ltd; Apollo Global Management, Inc.; Tango Holdings, Inc.
(Commission File No. 001-37963)

Forward Looking Statements and Important Disclosures This presentation has been prepared by Apollo Global Management, Inc., a Delaware corporation (together with its subsidiaries, “Apollo”) solely for informational purposes for its public stockholders in connection with evaluating the business, operations and financial results of Apollo and Athene Holding Ltd., a Bermuda exempted company (together with its subsidiaries, “Athene”), and assumes that the previously announced merger of Apollo and Athene will be successfully consummated. Information and data in the materials are as of June 30, 2021 unless otherwise noted, including information and data labeled “2021”, “Current”, “Today” and similar labeled content. Information and data labeled “Tomorrow” is prospective and aspirational and not intended to denote a particular date in the future unless otherwise noted. Apollo makes no representation or warranty, express or implied, as to the fairness, accuracy, reasonableness or completeness of the information contained herein, including, but not limited to, information obtained from third parties. Unless otherwise specified, information included herein is sourced from and reflects the views and opinions of Apollo Analysts. Certain information contained in these materials has been obtained from sources other than Apollo. While such information is believed to be reliable for purposes used herein, no representations are made as to the accuracy or completeness thereof and Apollo does not take any responsibility for such information. This presentation may contain trade names, trademarks and service marks of companies which (i) neither Apollo nor Apollo Funds own or (ii) are investments of Apollo or one or more Apollo Funds. We do not intend our use or display of these companies’ trade names, trademarks or service marks to imply a relationship with, or endorsement or sponsorship of us by, such companies. Certain information contained in the presentation discusses general market activity, industry or sector trends, or other broad-based economic, market or political conditions and should not be construed as research or investment advice. This presentation is not complete and the information contained herein may change at any time without notice. Apollo does not have any responsibility to update the presentation to account for such changes. The information contained herein is not intended to provide, and should not be relied upon for, accounting, legal or tax advice or investment recommendations. No Offer or Solicitation This presentation is for informational purposes only and not intended to and does not constitute an offer to subscribe for, buy or sell, the solicitation of an offer to subscribe for, buy or sell or an invitation to subscribe for, buy or sell any securities, products or services, including interests in the funds, vehicles or accounts sponsored or managed by Apollo (each, an “Apollo Fund”), any capital markets services offered by Apollo, or the solicitation of any vote or approval in any jurisdiction pursuant to or in connection with the proposed transaction or otherwise, nor shall there be any sale, issuance or transfer of securities in any jurisdiction in contravention of applicable law. Additional Information Regarding the Transaction and Where to Find It This presentation is being made in respect of the proposed transaction involving Tango Holdings, Inc., a Delaware corporation and a direct wholly owned subsidiary of Apollo (“HoldCo”), Apollo and Athene. The proposed transaction will be submitted to the stockholders of Apollo and the shareholders of Athene for their respective consideration. In connection therewith, the parties intend to file relevant materials with the Securities and Exchange Commission (the “SEC”), including a definitive joint proxy statement/prospectus, which will be mailed to the stockholders of Apollo and the shareholders of Athene. However, such documents are not currently available. BEFORE MAKING ANY VOTING OR ANY INVESTMENT DECISION, AS APPLICABLE, INVESTORS AND SECURITY HOLDERS OF APOLLO AND ATHENE ARE URGED TO READ THE DEFINITIVE JOINT PROXY STATEMENT/PROSPECTUS REGARDING THE PROPOSED TRANSACTION AND ANY OTHER RELEVANT DOCUMENTS FILED OR TO BE FILED WITH THE SECURITIES AND EXCHANGE COMMISSION (“SEC”) CAREFULLY AND IN THEIR ENTIRETY WHEN THEY BECOME AVAILABLE BECAUSE THEY WILL CONTAIN IMPORTANT INFORMATION ABOUT THE PROPOSED TRANSACTION. Investors and security holders may obtain free copies of the definitive joint proxy statement/prospectus, any amendments or supplements thereto and other documents containing important information about Apollo and Athene, once such documents are filed with the SEC, through the website maintained by the SEC at http://www.sec.gov. Copies of the documents filed with the SEC by Apollo will be available free of charge under the “Stockholders” section of Apollo’s website located at http://www.apollo.com or by contacting Apollo’s Investor Relations Department at (212) 822-0528 or ir@apollo.com. Copies of the documents filed with the SEC by Athene will be available free of charge under the “Investors” section of Athene’s website located at http://www.athene.com or by contacting Athene’s Investor Relations Department at (441) 279-8531 or ir@athene.com. Participants in the Solicitation Apollo, Athene, HoldCo and their respective directors, executive officers, members of management and employees may, under the rules of the SEC, be deemed to be participants in the solicitation of proxies in connection with the proposed transaction. Information about the directors and executive officers of Apollo and HoldCo is set forth in Apollo’s proxy statement for its 2021 annual meeting of stockholders, which was filed with the SEC on August 16, 2021, its annual report on Form 10-K for the fiscal year ended December 31, 2020, which was filed with the SEC on February 19, 2021, and in subsequent documents filed with the SEC, each of which can be obtained free of charge from the sources indicated above. Information about the directors and executive officers of Athene is set forth in Athene’s proxy statement for its 2021 annual meeting of shareholders, which was filed with the SEC on July 22, 2021, its annual report on Form 10-K for the fiscal year ended December 31, 2020, which was filed with the SEC on February 19, 2021, its amendment to its annual report on Form 10-K/A for the fiscal year ended December 31, 2020, which was filed with the SEC on April 20, 2021, and in subsequent documents filed with the SEC, each of which can be obtained free of charge from the sources indicated above. APOLLO INVESTOR DAY 2021 2Forward Looking Statements and Important Disclosures This presentation has been prepared by Apollo Global Management, Inc., a Delaware corporation (together with its subsidiaries, “Apollo”) solely for informational purposes for its public stockholders in connection with evaluating the business, operations and financial results of Apollo and Athene Holding Ltd., a Bermuda exempted company (together with its subsidiaries, “Athene”), and assumes that the previously announced merger of Apollo and Athene will be successfully consummated. Information and data in the materials are as of June 30, 2021 unless otherwise noted, including information and data labeled “2021”, “Current”, “Today” and similar labeled content. Information and data labeled “Tomorrow” is prospective and aspirational and not intended to denote a particular date in the future unless otherwise noted. Apollo makes no representation or warranty, express or implied, as to the fairness, accuracy, reasonableness or completeness of the information contained herein, including, but not limited to, information obtained from third parties. Unless otherwise specified, information included herein is sourced from and reflects the views and opinions of Apollo Analysts. Certain information contained in these materials has been obtained from sources other than Apollo. While such information is believed to be reliable for purposes used herein, no representations are made as to the accuracy or completeness thereof and Apollo does not take any responsibility for such information. This presentation may contain trade names, trademarks and service marks of companies which (i) neither Apollo nor Apollo Funds own or (ii) are investments of Apollo or one or more Apollo Funds. We do not intend our use or display of these companies’ trade names, trademarks or service marks to imply a relationship with, or endorsement or sponsorship of us by, such companies. Certain information contained in the presentation discusses general market activity, industry or sector trends, or other broad-based economic, market or political conditions and should not be construed as research or investment advice. This presentation is not complete and the information contained herein may change at any time without notice. Apollo does not have any responsibility to update the presentation to account for such changes. The information contained herein is not intended to provide, and should not be relied upon for, accounting, legal or tax advice or investment recommendations. No Offer or Solicitation This presentation is for informational purposes only and not intended to and does not constitute an offer to subscribe for, buy or sell, the solicitation of an offer to subscribe for, buy or sell or an invitation to subscribe for, buy or sell any securities, products or services, including interests in the funds, vehicles or accounts sponsored or managed by Apollo (each, an “Apollo Fund”), any capital markets services offered by Apollo, or the solicitation of any vote or approval in any jurisdiction pursuant to or in connection with the proposed transaction or otherwise, nor shall there be any sale, issuance or transfer of securities in any jurisdiction in contravention of applicable law. Additional Information Regarding the Transaction and Where to Find It This presentation is being made in respect of the proposed transaction involving Tango Holdings, Inc., a Delaware corporation and a direct wholly owned subsidiary of Apollo (“HoldCo”), Apollo and Athene. The proposed transaction will be submitted to the stockholders of Apollo and the shareholders of Athene for their respective consideration. In connection therewith, the parties intend to file relevant materials with the Securities and Exchange Commission (the “SEC”), including a definitive joint proxy statement/prospectus, which will be mailed to the stockholders of Apollo and the shareholders of Athene. However, such documents are not currently available. BEFORE MAKING ANY VOTING OR ANY INVESTMENT DECISION, AS APPLICABLE, INVESTORS AND SECURITY HOLDERS OF APOLLO AND ATHENE ARE URGED TO READ THE DEFINITIVE JOINT PROXY STATEMENT/PROSPECTUS REGARDING THE PROPOSED TRANSACTION AND ANY OTHER RELEVANT DOCUMENTS FILED OR TO BE FILED WITH THE SECURITIES AND EXCHANGE COMMISSION (“SEC”) CAREFULLY AND IN THEIR ENTIRETY WHEN THEY BECOME AVAILABLE BECAUSE THEY WILL CONTAIN IMPORTANT INFORMATION ABOUT THE PROPOSED TRANSACTION. Investors and security holders may obtain free copies of the definitive joint proxy statement/prospectus, any amendments or supplements thereto and other documents containing important information about Apollo and Athene, once such documents are filed with the SEC, through the website maintained by the SEC at http://www.sec.gov. Copies of the documents filed with the SEC by Apollo will be available free of charge under the “Stockholders” section of Apollo’s website located at http://www.apollo.com or by contacting Apollo’s Investor Relations Department at (212) 822-0528 or ir@apollo.com. Copies of the documents filed with the SEC by Athene will be available free of charge under the “Investors” section of Athene’s website located at http://www.athene.com or by contacting Athene’s Investor Relations Department at (441) 279-8531 or ir@athene.com. Participants in the Solicitation Apollo, Athene, HoldCo and their respective directors, executive officers, members of management and employees may, under the rules of the SEC, be deemed to be participants in the solicitation of proxies in connection with the proposed transaction. Information about the directors and executive officers of Apollo and HoldCo is set forth in Apollo’s proxy statement for its 2021 annual meeting of stockholders, which was filed with the SEC on August 16, 2021, its annual report on Form 10-K for the fiscal year ended December 31, 2020, which was filed with the SEC on February 19, 2021, and in subsequent documents filed with the SEC, each of which can be obtained free of charge from the sources indicated above. Information about the directors and executive officers of Athene is set forth in Athene’s proxy statement for its 2021 annual meeting of shareholders, which was filed with the SEC on July 22, 2021, its annual report on Form 10-K for the fiscal year ended December 31, 2020, which was filed with the SEC on February 19, 2021, its amendment to its annual report on Form 10-K/A for the fiscal year ended December 31, 2020, which was filed with the SEC on April 20, 2021, and in subsequent documents filed with the SEC, each of which can be obtained free of charge from the sources indicated above. APOLLO INVESTOR DAY 2021 2
Forward Looking Statements and Important Disclosures Other information regarding the participants in the proxy solicitations of the stockholders of Apollo and the shareholders of Athene, and a description of their direct and indirect interests, by security holdings or otherwise, will be contained in the preliminary and definitive joint proxy statement/prospectus and other relevant materials to be filed with the SEC when they become available. Forward Looking Statements Apollo Safe Harbor for Forward Looking Statements Disclaimer This presentation contains forward-looking statements that are within the meaning of Section 27A of the Securities Act of 1933, as amended, and Section 21E of the Securities Exchange Act of 1934, as amended. These statements include, but are not limited to, discussions related to Apollo’s expectations regarding the performance of its business, its liquidity and capital resources and the other non-historical statements in the discussion and analysis. These forward-looking statements are based on management’s beliefs, as well as assumptions made by, and information currently available to, management. When used in this presentation, the words “believe,” “anticipate,” “estimate,” “expect,” “intend”, “may”, “will”, “could”, “should”, “might”, “target”, “project”, “plan”, “seek”, “continue” and similar expressions are intended to identify forward-looking statements. Although management believes that the expectations reflected in these forward-looking statements are reasonable, it can give no assurance that these expectations will prove to have been correct. It is possible that actual results will differ, possibly materially, from the anticipated results indicated in these statements. These statements are subject to certain risks, uncertainties and assumptions, including risks relating to Apollo’s dependence on certain key personnel, Apollo’s ability to raise new Apollo Funds, the impact of COVID-19, the impact of energy market dislocation, market conditions, generally, Apollo’s ability to manage its growth, fund performance, changes in Apollo’s regulatory environment and tax status, the variability of Apollo’s revenues, net income and cash flow, Apollo’s use of leverage to finance its businesses and investments by Apollo Funds, litigation risks and consummation of the merger of Apollo with Athene, potential governance changes and related transactions which are subject to regulatory, corporate and shareholders approvals, among others. Due to the COVID-19 pandemic, there has been uncertainty and disruption in the global economy and financial markets. While Apollo is unable to accurately predict the full impact that COVID-19 will have on Apollo’s results from operations, financial condition, liquidity and cash flows due to numerous uncertainties, including the duration and severity of the pandemic and containment measures, Apollo’s compliance with these measures has impacted Apollo’s day-to-day operations and could disrupt Apollo’s business and operations, as well as that of the Apollo Funds and their portfolio companies, for an indefinite period of time. Apollo believes these factors include but are not limited to those described under the section entitled “Risk Factors” in Apollo’s annual report on Form 10-K filed with the SEC on February 19, 2021 and Quarterly Report on Form 10-Q filed with the SEC on May 10, 2021, as such factors may be updated from time to time in Apollo’s periodic filings with the SEC, which are accessible on the SEC’s website at http://www.sec.gov. These factors should not be construed as exhaustive and should be read in conjunction with the other cautionary statements that are included in this presentation and in other filings. The proposed transaction is subject to risks, uncertainties and assumptions, which include, but are not limited to: (i) that Apollo may be unable to complete the proposed transaction because, among other reasons, conditions to the closing of the proposed transaction may not be satisfied or waived, including that a governmental entity may prohibit, delay or refuse to grant or place material restrictions on its approval for the consummation of the proposed transaction; (ii) uncertainty as to the timing of completion of the proposed transaction; (iii) the inability to complete the proposed transaction due to the failure to obtain Apollo stockholder approval and Athene shareholder approval for the proposed transaction; (iv) the occurrence of any event, change or other circumstances that could give rise to the termination of the merger agreement; (v) risks related to disruption of management’s attention from Apollo’s ongoing business operations due to the proposed transaction; (vi) the effect of the announcement of the proposed transaction on Apollo’s relationships with its clients, operating results and business generally; (vii) the outcome of any legal proceedings to the extent initiated against Apollo or others following the announcement of the proposed transaction, as well as Apollo’s management’s response to any of the aforementioned factors; and (viii) industry conditions. Apollo undertakes no obligation to publicly update or review any forward-looking statements, whether as a result of new information, future developments or otherwise, except as required by applicable law. This presentation does not constitute an offer of any Apollo Fund. Athene Safe Harbor for Forward-Looking Statements This presentation contains, and certain oral statements made by Athene’s representatives from time to time may contain, forward-looking statements within the meaning of the Private Securities Litigation Reform Act of 1995, Section 27A of the Securities Act of 1933, as amended, and Section 21E of the Securities Exchange Act of 1934, as amended. Such statements are subject to risks and uncertainties that could cause actual results, events and developments to differ materially from those set forth in, or implied by, such statements. These statements are based on the beliefs and assumptions of Athene’s management and the management of Athene’s subsidiaries. Generally, forward-looking statements include actions, events, results, strategies and expectations and are often identifiable by use of the words “believes,” “expects,” “intends,” “anticipates,” “plans,” “seeks,” “estimates,” “projects,” “may,” “will,” “could,” “might,” or “continues” or similar expressions. Forward looking statements within this presentation include, but are not limited to, statements regarding: the consummation of the proposed merger and the benefits to be derived therefrom; the future financial performance and growth prospects of the combined entity; the market environment in which the combined entity will operate; future capital allocation decisions, including the payment of dividends; the structure and operation of the company post-merger; and the tax treatment of the proposed transaction. APOLLO INVESTOR DAY 2021 3Forward Looking Statements and Important Disclosures Other information regarding the participants in the proxy solicitations of the stockholders of Apollo and the shareholders of Athene, and a description of their direct and indirect interests, by security holdings or otherwise, will be contained in the preliminary and definitive joint proxy statement/prospectus and other relevant materials to be filed with the SEC when they become available. Forward Looking Statements Apollo Safe Harbor for Forward Looking Statements Disclaimer This presentation contains forward-looking statements that are within the meaning of Section 27A of the Securities Act of 1933, as amended, and Section 21E of the Securities Exchange Act of 1934, as amended. These statements include, but are not limited to, discussions related to Apollo’s expectations regarding the performance of its business, its liquidity and capital resources and the other non-historical statements in the discussion and analysis. These forward-looking statements are based on management’s beliefs, as well as assumptions made by, and information currently available to, management. When used in this presentation, the words “believe,” “anticipate,” “estimate,” “expect,” “intend”, “may”, “will”, “could”, “should”, “might”, “target”, “project”, “plan”, “seek”, “continue” and similar expressions are intended to identify forward-looking statements. Although management believes that the expectations reflected in these forward-looking statements are reasonable, it can give no assurance that these expectations will prove to have been correct. It is possible that actual results will differ, possibly materially, from the anticipated results indicated in these statements. These statements are subject to certain risks, uncertainties and assumptions, including risks relating to Apollo’s dependence on certain key personnel, Apollo’s ability to raise new Apollo Funds, the impact of COVID-19, the impact of energy market dislocation, market conditions, generally, Apollo’s ability to manage its growth, fund performance, changes in Apollo’s regulatory environment and tax status, the variability of Apollo’s revenues, net income and cash flow, Apollo’s use of leverage to finance its businesses and investments by Apollo Funds, litigation risks and consummation of the merger of Apollo with Athene, potential governance changes and related transactions which are subject to regulatory, corporate and shareholders approvals, among others. Due to the COVID-19 pandemic, there has been uncertainty and disruption in the global economy and financial markets. While Apollo is unable to accurately predict the full impact that COVID-19 will have on Apollo’s results from operations, financial condition, liquidity and cash flows due to numerous uncertainties, including the duration and severity of the pandemic and containment measures, Apollo’s compliance with these measures has impacted Apollo’s day-to-day operations and could disrupt Apollo’s business and operations, as well as that of the Apollo Funds and their portfolio companies, for an indefinite period of time. Apollo believes these factors include but are not limited to those described under the section entitled “Risk Factors” in Apollo’s annual report on Form 10-K filed with the SEC on February 19, 2021 and Quarterly Report on Form 10-Q filed with the SEC on May 10, 2021, as such factors may be updated from time to time in Apollo’s periodic filings with the SEC, which are accessible on the SEC’s website at http://www.sec.gov. These factors should not be construed as exhaustive and should be read in conjunction with the other cautionary statements that are included in this presentation and in other filings. The proposed transaction is subject to risks, uncertainties and assumptions, which include, but are not limited to: (i) that Apollo may be unable to complete the proposed transaction because, among other reasons, conditions to the closing of the proposed transaction may not be satisfied or waived, including that a governmental entity may prohibit, delay or refuse to grant or place material restrictions on its approval for the consummation of the proposed transaction; (ii) uncertainty as to the timing of completion of the proposed transaction; (iii) the inability to complete the proposed transaction due to the failure to obtain Apollo stockholder approval and Athene shareholder approval for the proposed transaction; (iv) the occurrence of any event, change or other circumstances that could give rise to the termination of the merger agreement; (v) risks related to disruption of management’s attention from Apollo’s ongoing business operations due to the proposed transaction; (vi) the effect of the announcement of the proposed transaction on Apollo’s relationships with its clients, operating results and business generally; (vii) the outcome of any legal proceedings to the extent initiated against Apollo or others following the announcement of the proposed transaction, as well as Apollo’s management’s response to any of the aforementioned factors; and (viii) industry conditions. Apollo undertakes no obligation to publicly update or review any forward-looking statements, whether as a result of new information, future developments or otherwise, except as required by applicable law. This presentation does not constitute an offer of any Apollo Fund. Athene Safe Harbor for Forward-Looking Statements This presentation contains, and certain oral statements made by Athene’s representatives from time to time may contain, forward-looking statements within the meaning of the Private Securities Litigation Reform Act of 1995, Section 27A of the Securities Act of 1933, as amended, and Section 21E of the Securities Exchange Act of 1934, as amended. Such statements are subject to risks and uncertainties that could cause actual results, events and developments to differ materially from those set forth in, or implied by, such statements. These statements are based on the beliefs and assumptions of Athene’s management and the management of Athene’s subsidiaries. Generally, forward-looking statements include actions, events, results, strategies and expectations and are often identifiable by use of the words “believes,” “expects,” “intends,” “anticipates,” “plans,” “seeks,” “estimates,” “projects,” “may,” “will,” “could,” “might,” or “continues” or similar expressions. Forward looking statements within this presentation include, but are not limited to, statements regarding: the consummation of the proposed merger and the benefits to be derived therefrom; the future financial performance and growth prospects of the combined entity; the market environment in which the combined entity will operate; future capital allocation decisions, including the payment of dividends; the structure and operation of the company post-merger; and the tax treatment of the proposed transaction. APOLLO INVESTOR DAY 2021 3
Forward Looking Statements and Important Disclosures Factors that could cause actual results, events and developments to differ include, without limitation: Athene’s failure to obtain approval of the proposed transaction by its shareholders or regulators; Athene’s failure to recognize the benefits expected to be derived from the proposed transaction; unanticipated difficulties or expenditures relating to the proposed transaction; disruptions of Athene’s current plans, operations and relationships with customers, suppliers and other business partners caused by the announcement and pendency of the proposed transaction; legal proceedings, including those that may be instituted against Athene, Athene’s board of directors or special committee, Athene’s executive officers and others following announcement of the proposed transaction; the accuracy of Athene’s assumptions and estimates; Athene’s ability to maintain or improve financial strength ratings; Athene’s ability to manage its business in a highly regulated industry; regulatory changes or actions; the impact of Athene’s reinsurers failing to meet their assumed obligations; the impact of interest rate fluctuations; changes in the federal income tax laws and regulations; the accuracy of Athene’s interpretation of the Tax Cuts and Jobs Act, litigation (including class action litigation), enforcement investigations or regulatory scrutiny; the performance of third parties; the loss of key personnel; telecommunication, information technology and other operational systems failures; the continued availability of capital; new accounting rules or changes to existing accounting rules; general economic conditions; Athene’s ability to protect its intellectual property; the ability to maintain or obtain approval of the Delaware Department of Insurance, the Iowa Insurance Division and other regulatory authorities as required for Athene’s operations; and other factors discussed from time to time in Athene’s filings with the SEC, including its annual report on Form 10-K for the year ended December 31, 2020 and quarterly report on Form 10-Q filed for the period ended June 30, 2021, which can be found at the SEC’s website at http://www.sec.gov. All forward-looking statements described herein are qualified by these cautionary statements and there can be no assurance that the actual results, events or developments referenced herein will occur or be realized. Athene does not undertake any obligation to update or revise forward-looking statements to reflect changed assumptions, the occurrence of unanticipated events or changes to future operating results. The contents of any website referenced in this presentation are not incorporated by reference. Performance Information Past performance is not necessarily indicative of future results and there can be no assurance that Apollo, Athene or any Apollo Fund or strategy will achieve comparable results, or that any investments made by Apollo in the future will be profitable. Actual realized value of currently unrealized investments will depend on, among other factors, future operating results, the value of the assets and market conditions at the time of disposition, any related transaction costs and the timing and manner of sale, all of which may differ from the assumptions and circumstances on which the current unrealized valuations are based. Accordingly, the actual realized values of unrealized investments may differ materially from the values indicated herein. Information contained herein may include information with respect to prior investment performance of one or more Apollo and Athene funds or investments, including gross and/or net internal rates of return (“IRR”) and gross and/or net multiple of investment cost (“MOIC”). Information with respect to prior performance, while a useful tool in evaluating investment activities, is not necessarily indicative of actual results that may be achieved for unrealized investments. The realization of such performance is dependent upon many factors, many of which are beyond the control of Apollo. Aggregated return information is not reflective of an investable product, and as such does not reflect the returns of any Apollo Fund. Please refer to the Appendix for additional important information. APOLLO INVESTOR DAY 2021 4Forward Looking Statements and Important Disclosures Factors that could cause actual results, events and developments to differ include, without limitation: Athene’s failure to obtain approval of the proposed transaction by its shareholders or regulators; Athene’s failure to recognize the benefits expected to be derived from the proposed transaction; unanticipated difficulties or expenditures relating to the proposed transaction; disruptions of Athene’s current plans, operations and relationships with customers, suppliers and other business partners caused by the announcement and pendency of the proposed transaction; legal proceedings, including those that may be instituted against Athene, Athene’s board of directors or special committee, Athene’s executive officers and others following announcement of the proposed transaction; the accuracy of Athene’s assumptions and estimates; Athene’s ability to maintain or improve financial strength ratings; Athene’s ability to manage its business in a highly regulated industry; regulatory changes or actions; the impact of Athene’s reinsurers failing to meet their assumed obligations; the impact of interest rate fluctuations; changes in the federal income tax laws and regulations; the accuracy of Athene’s interpretation of the Tax Cuts and Jobs Act, litigation (including class action litigation), enforcement investigations or regulatory scrutiny; the performance of third parties; the loss of key personnel; telecommunication, information technology and other operational systems failures; the continued availability of capital; new accounting rules or changes to existing accounting rules; general economic conditions; Athene’s ability to protect its intellectual property; the ability to maintain or obtain approval of the Delaware Department of Insurance, the Iowa Insurance Division and other regulatory authorities as required for Athene’s operations; and other factors discussed from time to time in Athene’s filings with the SEC, including its annual report on Form 10-K for the year ended December 31, 2020 and quarterly report on Form 10-Q filed for the period ended June 30, 2021, which can be found at the SEC’s website at http://www.sec.gov. All forward-looking statements described herein are qualified by these cautionary statements and there can be no assurance that the actual results, events or developments referenced herein will occur or be realized. Athene does not undertake any obligation to update or revise forward-looking statements to reflect changed assumptions, the occurrence of unanticipated events or changes to future operating results. The contents of any website referenced in this presentation are not incorporated by reference. Performance Information Past performance is not necessarily indicative of future results and there can be no assurance that Apollo, Athene or any Apollo Fund or strategy will achieve comparable results, or that any investments made by Apollo in the future will be profitable. Actual realized value of currently unrealized investments will depend on, among other factors, future operating results, the value of the assets and market conditions at the time of disposition, any related transaction costs and the timing and manner of sale, all of which may differ from the assumptions and circumstances on which the current unrealized valuations are based. Accordingly, the actual realized values of unrealized investments may differ materially from the values indicated herein. Information contained herein may include information with respect to prior investment performance of one or more Apollo and Athene funds or investments, including gross and/or net internal rates of return (“IRR”) and gross and/or net multiple of investment cost (“MOIC”). Information with respect to prior performance, while a useful tool in evaluating investment activities, is not necessarily indicative of actual results that may be achieved for unrealized investments. The realization of such performance is dependent upon many factors, many of which are beyond the control of Apollo. Aggregated return information is not reflective of an investable product, and as such does not reflect the returns of any Apollo Fund. Please refer to the Appendix for additional important information. APOLLO INVESTOR DAY 2021 4

Welcome Remarks NOAH GUNN Global Head of Investor Relations APOLLO INVESTOR DAY 2021
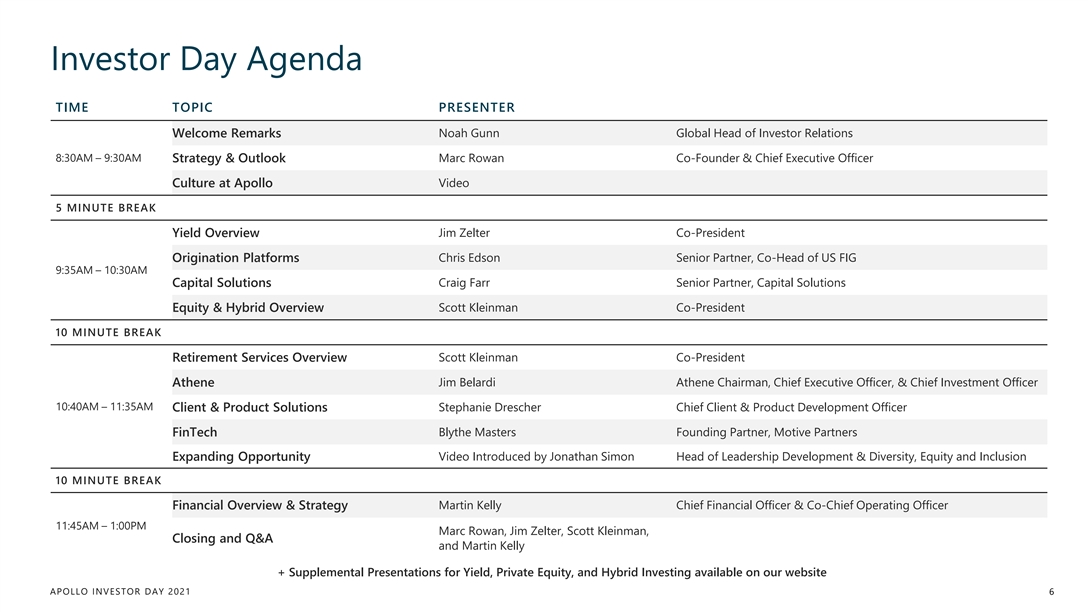
Investor Day Agenda TIME TOPIC PRESENTER Noah Gunn Global Head of Investor Relations Welcome Remarks 8:30AM – 9:30AM Strategy & Outlook Marc Rowan Co-Founder & Chief Executive Officer Culture at Apollo Video 5 MINUTE BREAK Yield Overview Jim Zelter Co-President Origination Platforms Chris Edson Senior Partner, Co-Head of US FIG 9:35AM – 10:30AM Capital Solutions Craig Farr Senior Partner, Capital Solutions Equity & Hybrid Overview Scott Kleinman Co-President 10 MINUTE BREAK Retirement Services Overview Scott Kleinman Co-President Jim Belardi Athene Chairman, Chief Executive Officer, & Chief Investment Officer Athene 10:40AM – 11:35AM Stephanie Drescher Chief Client & Product Development Officer Client & Product Solutions Blythe Masters Founding Partner, Motive Partners FinTech Expanding Opportunity Video Introduced by Jonathan Simon Head of Leadership Development & Diversity, Equity and Inclusion 10 MINUTE BREAK Martin Kelly Chief Financial Officer & Co-Chief Operating Officer Financial Overview & Strategy 11:45AM – 1:00PM Marc Rowan, Jim Zelter, Scott Kleinman, Closing and Q&A and Martin Kelly + Supplemental Presentations for Yield, Private Equity, and Hybrid Investing available on our website APOLLO INVESTOR DAY 2021 6Investor Day Agenda TIME TOPIC PRESENTER Noah Gunn Global Head of Investor Relations Welcome Remarks 8:30AM – 9:30AM Strategy & Outlook Marc Rowan Co-Founder & Chief Executive Officer Culture at Apollo Video 5 MINUTE BREAK Yield Overview Jim Zelter Co-President Origination Platforms Chris Edson Senior Partner, Co-Head of US FIG 9:35AM – 10:30AM Capital Solutions Craig Farr Senior Partner, Capital Solutions Equity & Hybrid Overview Scott Kleinman Co-President 10 MINUTE BREAK Retirement Services Overview Scott Kleinman Co-President Jim Belardi Athene Chairman, Chief Executive Officer, & Chief Investment Officer Athene 10:40AM – 11:35AM Stephanie Drescher Chief Client & Product Development Officer Client & Product Solutions Blythe Masters Founding Partner, Motive Partners FinTech Expanding Opportunity Video Introduced by Jonathan Simon Head of Leadership Development & Diversity, Equity and Inclusion 10 MINUTE BREAK Martin Kelly Chief Financial Officer & Co-Chief Operating Officer Financial Overview & Strategy 11:45AM – 1:00PM Marc Rowan, Jim Zelter, Scott Kleinman, Closing and Q&A and Martin Kelly + Supplemental Presentations for Yield, Private Equity, and Hybrid Investing available on our website APOLLO INVESTOR DAY 2021 6
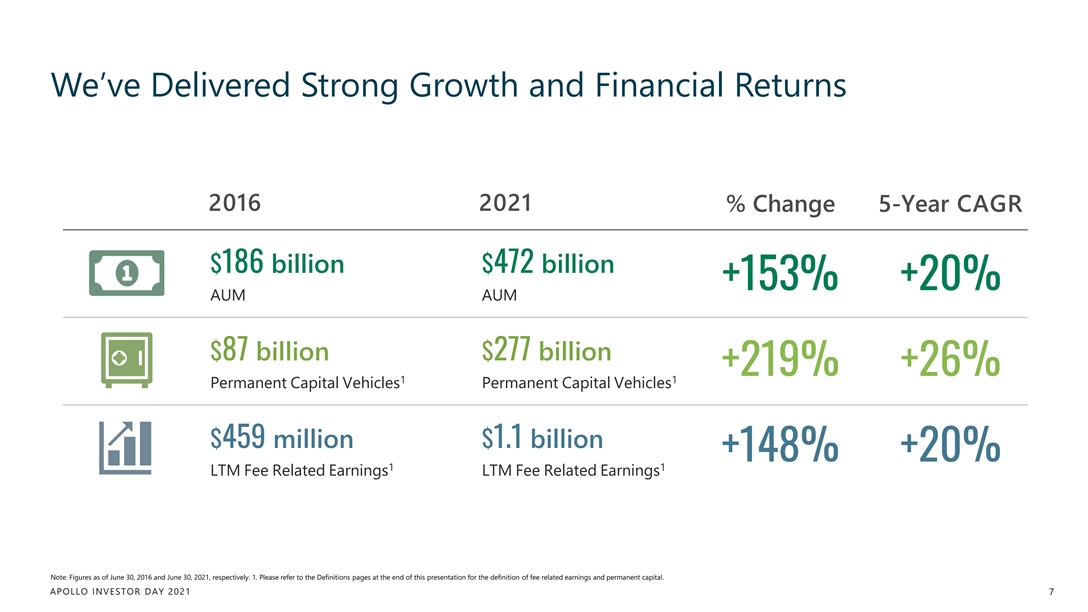
We’ve Delivered Strong Growth and Financial Returns 2016 2021 % Change 5-Year CAGR $186 billion $472 billion +153% +20% AUM AUM $87 billion $277 billion +219% +26% 1 1 Permanent Capital Vehicles Permanent Capital Vehicles $459 million $1.1 billion +148% +20% 1 1 LTM Fee Related Earnings LTM Fee Related Earnings Note: Figures as of June 30, 2016 and June 30, 2021, respectively. 1. Please refer to the Definitions pages at the end of this presentation for the definition of fee related earnings and permanent capital. APOLLO INVESTOR DAY 2021 7We’ve Delivered Strong Growth and Financial Returns 2016 2021 % Change 5-Year CAGR $186 billion $472 billion +153% +20% AUM AUM $87 billion $277 billion +219% +26% 1 1 Permanent Capital Vehicles Permanent Capital Vehicles $459 million $1.1 billion +148% +20% 1 1 LTM Fee Related Earnings LTM Fee Related Earnings Note: Figures as of June 30, 2016 and June 30, 2021, respectively. 1. Please refer to the Definitions pages at the end of this presentation for the definition of fee related earnings and permanent capital. APOLLO INVESTOR DAY 2021 7

Strategy & Outlook MARC ROWAN Co-Founder & Chief Executive Officer APOLLO INVESTOR DAY 2021Strategy & Outlook MARC ROWAN Co-Founder & Chief Executive Officer APOLLO INVESTOR DAY 2021
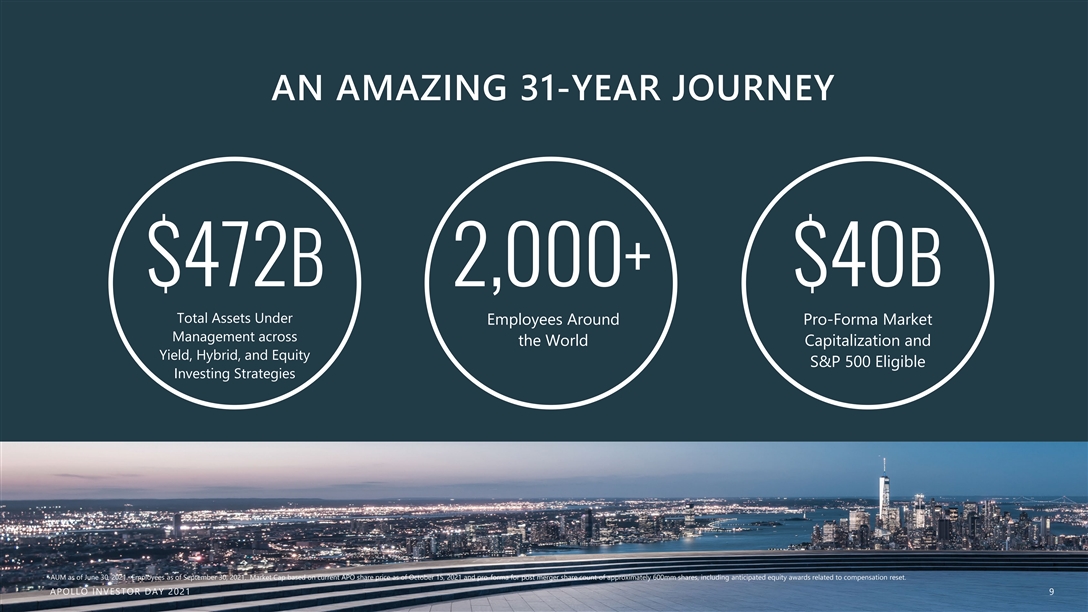
AN AMAZING 31-YEAR JOURNEY $472B 2,000+ $40B Total Assets Under Employees Around Pro-Forma Market Management across the World Capitalization and Yield, Hybrid, and Equity S&P 500 Eligible Investing Strategies AUM as of June 30, 2021. Employees as of September 30, 2021. Market Cap based on current APO share price as of October 15, 2021 and pro-forma for post merger share count of approximately 600mm shares, including anticipated equity awards related to compensation reset. A A AP P PO O OL L LL L LO O O IIIN N NV V VE E ES S ST T TO O OR R R D D DA A AY Y Y 2021 2021 2021 9AN AMAZING 31-YEAR JOURNEY $472B 2,000+ $40B Total Assets Under Employees Around Pro-Forma Market Management across the World Capitalization and Yield, Hybrid, and Equity S&P 500 Eligible Investing Strategies AUM as of June 30, 2021. Employees as of September 30, 2021. Market Cap based on current APO share price as of October 15, 2021 and pro-forma for post merger share count of approximately 600mm shares, including anticipated equity awards related to compensation reset. A A AP P PO O OL L LL L LO O O IIIN N NV V VE E ES S ST T TO O OR R R D D DA A AY Y Y 2021 2021 2021 9

We Can’t Underestimate the Importance of Culture “Culture eats strategy for breakfast.” -PETER DRUCKER APOLLO INVESTOR DAY 2021 10We Can’t Underestimate the Importance of Culture “Culture eats strategy for breakfast.” -PETER DRUCKER APOLLO INVESTOR DAY 2021 10
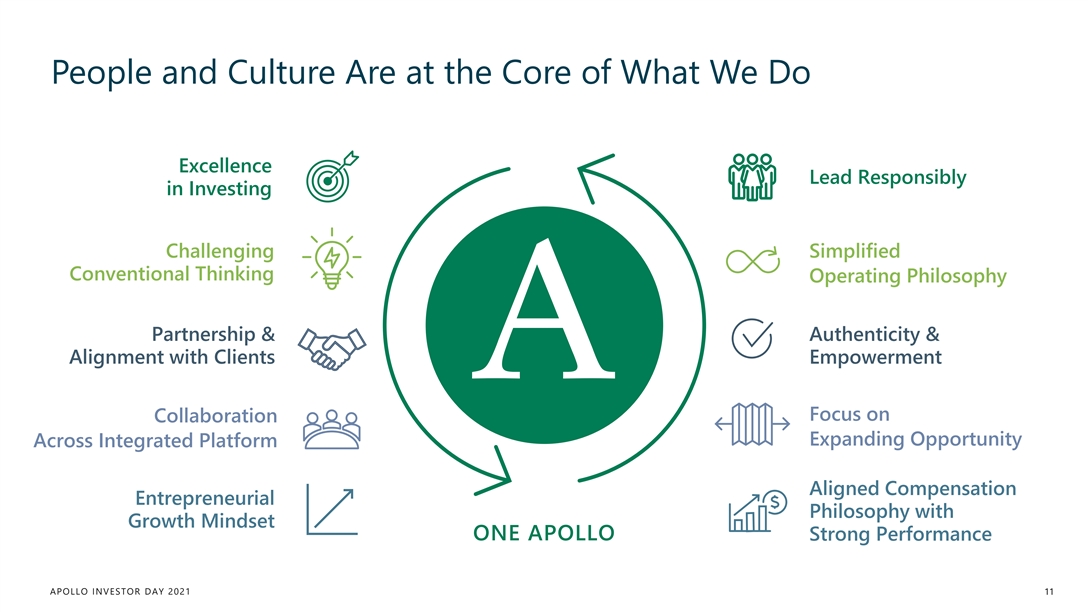
People and Culture Are at the Core of What We Do Excellence Lead Responsibly in Investing Challenging Simplified Conventional Thinking Operating Philosophy Partnership & Authenticity & Alignment with Clients Empowerment Focus on Collaboration Expanding Opportunity Across Integrated Platform Aligned Compensation Entrepreneurial Philosophy with Growth Mindset ONE APOLLO Strong Performance APOLLO INVESTOR DAY 2021 11

Five Key Takeaways ~2x AUM 1 ~2.25x Fee Revenue + earnings on ~$5 billion of growth capital High growth base plan over next 5 years 1 ~2.5x FRE Largest addressable market Unique ecosystem built for massive credit opportunity 2 among alternatives peers Athene is a competitive differentiator Merger has many strategic benefits and allows us to capture 3 large amounts of undervalued spread earnings and growth accelerant $15 billion of capital generation over next 5 years to accelerate Our model is highly capital efficient 4 growth and return to shareholders Industry’s best talent, aligned with changes to compensation Strong momentum behind aligned team 5 philosophy 1. Pro-forma for announced merger with Athene. APOLLO INVESTOR DAY 2021 12Five Key Takeaways ~2x AUM 1 ~2.25x Fee Revenue + earnings on ~$5 billion of growth capital High growth base plan over next 5 years 1 ~2.5x FRE Largest addressable market Unique ecosystem built for massive credit opportunity 2 among alternatives peers Athene is a competitive differentiator Merger has many strategic benefits and allows us to capture 3 large amounts of undervalued spread earnings and growth accelerant $15 billion of capital generation over next 5 years to accelerate Our model is highly capital efficient 4 growth and return to shareholders Industry’s best talent, aligned with changes to compensation Strong momentum behind aligned team 5 philosophy 1. Pro-forma for announced merger with Athene. APOLLO INVESTOR DAY 2021 12

1 High Growth Base Plan Over The Next 5 Years APOLLO INVESTOR DAY 2021 131 High Growth Base Plan Over The Next 5 Years APOLLO INVESTOR DAY 2021 13
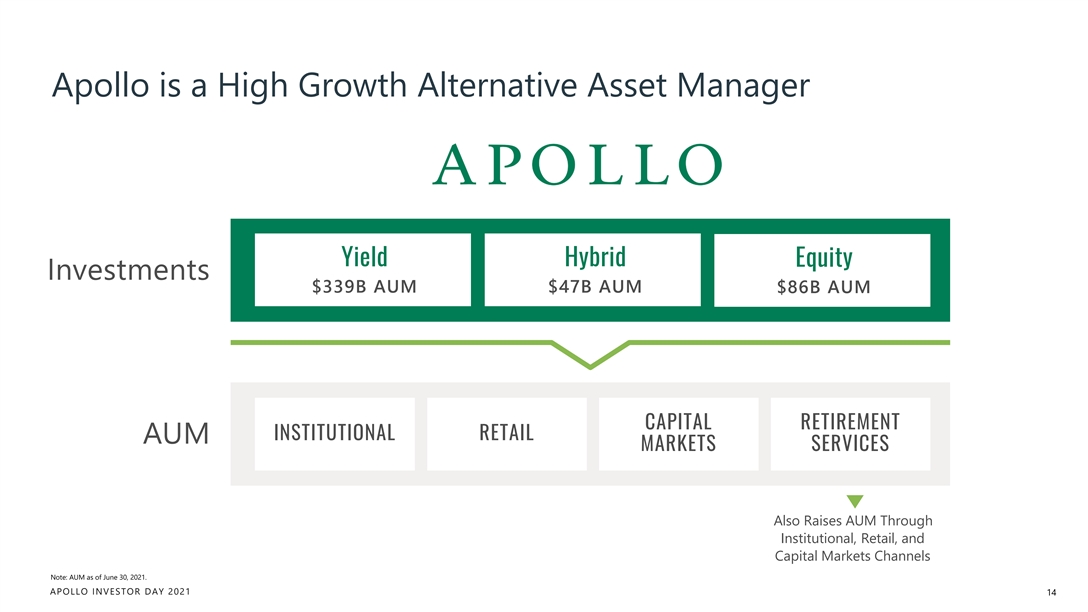
Apollo is a High Growth Alternative Asset Manager Yield Hybrid Equity Investments $339B AUM $47B AUM $86B AUM CAPITAL RETIREMENT INSTITUTIONAL RETAIL AUM MARKETS SERVICES Also Raises AUM Through Institutional, Retail, and Capital Markets Channels Note: AUM as of June 30, 2021. APOLLO INVESTOR DAY 2021 14Apollo is a High Growth Alternative Asset Manager Yield Hybrid Equity Investments $339B AUM $47B AUM $86B AUM CAPITAL RETIREMENT INSTITUTIONAL RETAIL AUM MARKETS SERVICES Also Raises AUM Through Institutional, Retail, and Capital Markets Channels Note: AUM as of June 30, 2021. APOLLO INVESTOR DAY 2021 14
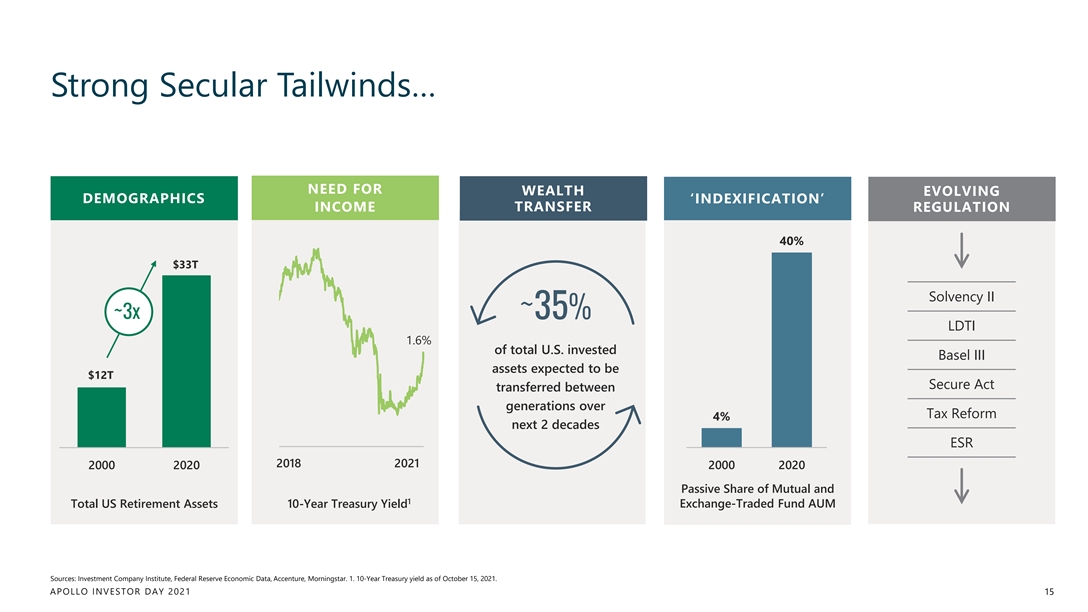
Strong Secular Tailwinds… NEED FOR WEALTH EVOLVING DEMOGRAPHICS ‘INDEXIFICATION’ TRANSFER INCOME REGULATION 40% $33T Solvency II ~3x ~35% LDTI 1.6% of total U.S. invested Basel III assets expected to be $12T Secure Act transferred between generations over Tax Reform 4% next 2 decades ESR 2018 2021 2000 2020 2000 2020 Passive Share of Mutual and 1 Total US Retirement Assets 10-Year Treasury Yield Exchange-Traded Fund AUM Sources: Investment Company Institute, Federal Reserve Economic Data, Accenture, Morningstar. 1. 10-Year Treasury yield as of October 15, 2021. APOLLO INVESTOR DAY 2021 15Strong Secular Tailwinds… NEED FOR WEALTH EVOLVING DEMOGRAPHICS ‘INDEXIFICATION’ TRANSFER INCOME REGULATION 40% $33T Solvency II ~3x ~35% LDTI 1.6% of total U.S. invested Basel III assets expected to be $12T Secure Act transferred between generations over Tax Reform 4% next 2 decades ESR 2018 2021 2000 2020 2000 2020 Passive Share of Mutual and 1 Total US Retirement Assets 10-Year Treasury Yield Exchange-Traded Fund AUM Sources: Investment Company Institute, Federal Reserve Economic Data, Accenture, Morningstar. 1. 10-Year Treasury yield as of October 15, 2021. APOLLO INVESTOR DAY 2021 15
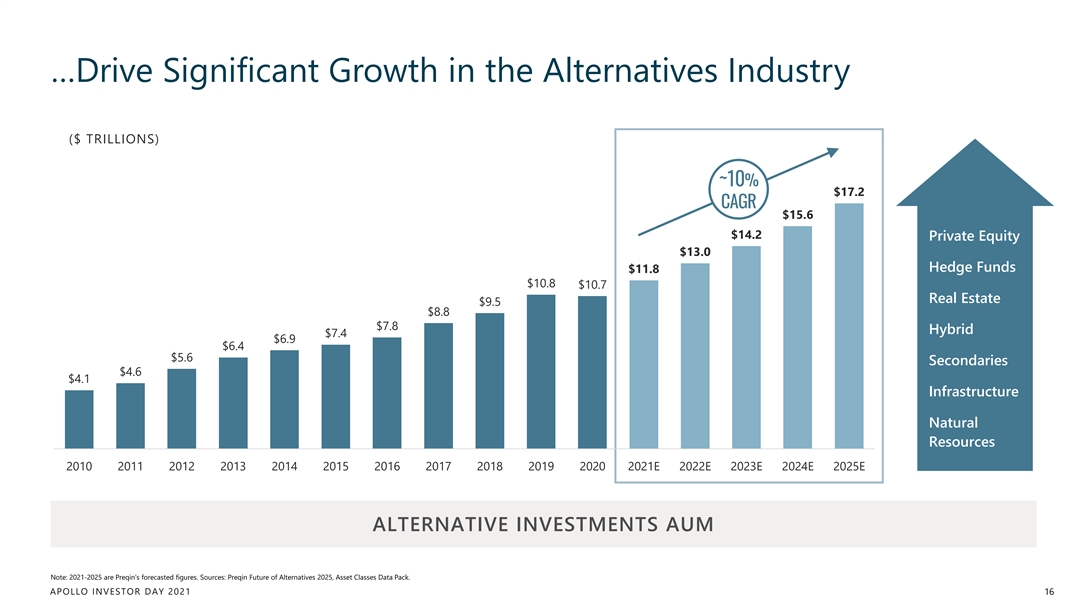
…Drive Significant Growth in the Alternatives Industry ($ TRILLIONS) ~10% $17.2 CAGR $15.6 $14.2 Private Equity $13.0 Hedge Funds $11.8 $10.8 $10.7 Real Estate $9.5 $8.8 $7.8 Hybrid $7.4 $6.9 $6.4 $5.6 Secondaries $4.6 $4.1 Infrastructure Natural Resources 2010 2011 2012 2013 2014 2015 2016 2017 2018 2019 2020 2021E 2022E 2023E 2024E 2025E ALTERNATIVE INVESTMENTS AUM Note: 2021-2025 are Preqin’s forecasted figures. Sources: Preqin Future of Alternatives 2025, Asset Classes Data Pack. APOLLO INVESTOR DAY 2021 16…Drive Significant Growth in the Alternatives Industry ($ TRILLIONS) ~10% $17.2 CAGR $15.6 $14.2 Private Equity $13.0 Hedge Funds $11.8 $10.8 $10.7 Real Estate $9.5 $8.8 $7.8 Hybrid $7.4 $6.9 $6.4 $5.6 Secondaries $4.6 $4.1 Infrastructure Natural Resources 2010 2011 2012 2013 2014 2015 2016 2017 2018 2019 2020 2021E 2022E 2023E 2024E 2025E ALTERNATIVE INVESTMENTS AUM Note: 2021-2025 are Preqin’s forecasted figures. Sources: Preqin Future of Alternatives 2025, Asset Classes Data Pack. APOLLO INVESTOR DAY 2021 16
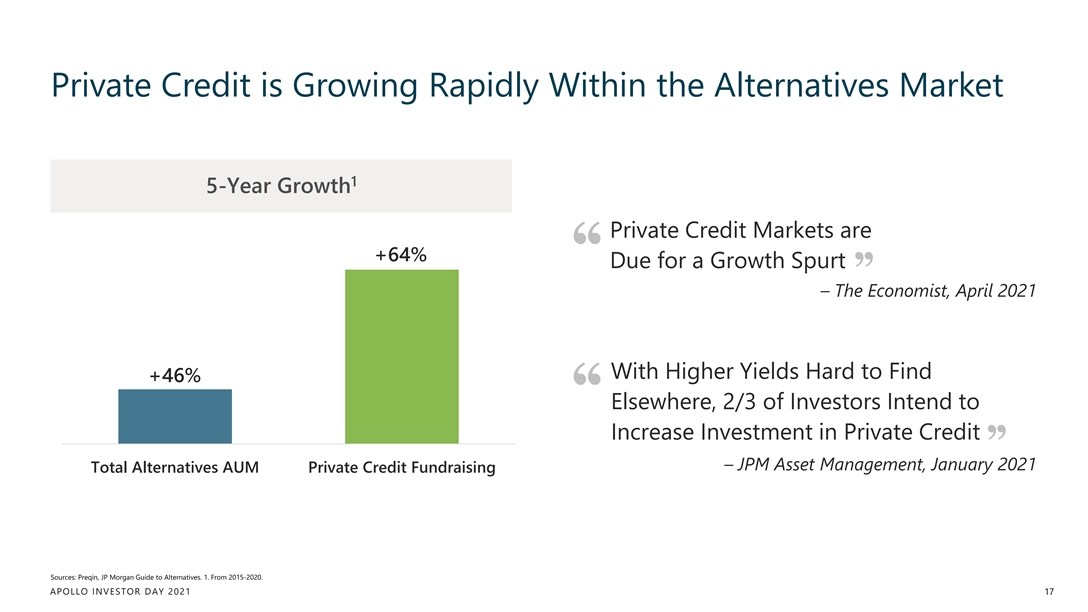
Private Credit is Growing Rapidly Within the Alternatives Market 1 5-Year Growth Private Credit Markets are +64% Due for a Growth Spurt – The Economist, April 2021 With Higher Yields Hard to Find +46% Elsewhere, 2/3 of Investors Intend to Increase Investment in Private Credit – JPM Asset Management, January 2021 Total Alternatives AUM Private Credit Fundraising Sources: Preqin, JP Morgan Guide to Alternatives. 1. From 2015-2020. APOLLO INVESTOR DAY 2021 17
WHAT WE DO We seek to provide excess returns to investors on a risk-adjusted basis We serve a growing market driven by the need for retirement income A AP PO OL LL LO O IIN NV VE ES ST TO OR R D DA AY Y 2021 2021 18WHAT WE DO We seek to provide excess returns to investors on a risk-adjusted basis We serve a growing market driven by the need for retirement income A AP PO OL LL LO O IIN NV VE ES ST TO OR R D DA AY Y 2021 2021 18
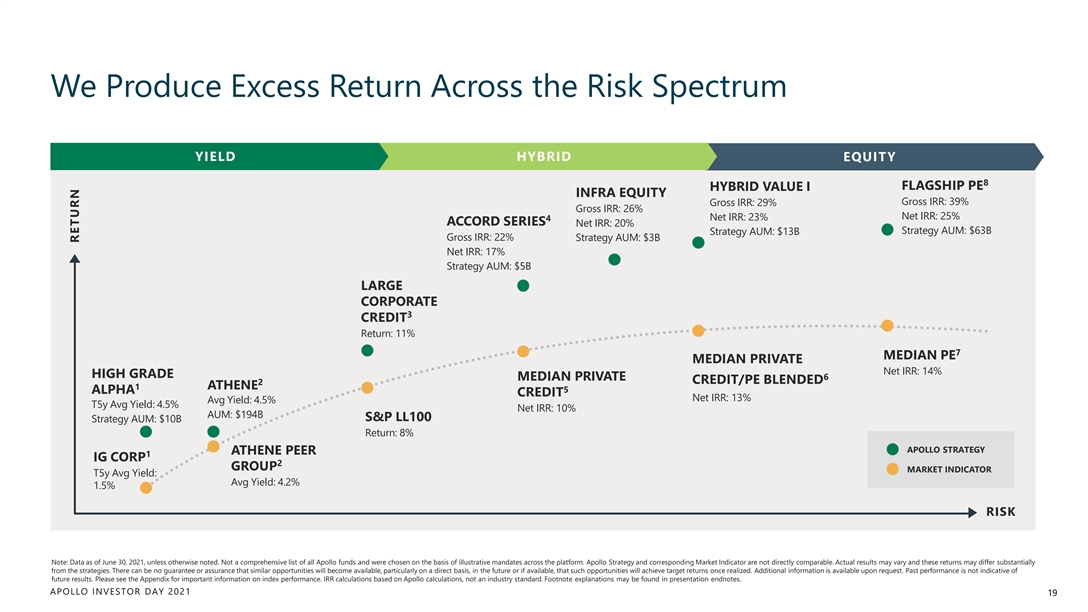
We Produce Excess Return Across the Risk Spectrum YIELD HYBRID EQUITY 8 FLAGSHIP PE HYBRID VALUE I INFRA EQUITY Gross IRR: 39% Gross IRR: 29% Gross IRR: 26% Net IRR: 25% 4 Net IRR: 23% ACCORD SERIES Net IRR: 20% Strategy AUM: $63B Strategy AUM: $13B Gross IRR: 22% Strategy AUM: $3B Net IRR: 17% Strategy AUM: $5B LARGE CORPORATE 3 CREDIT Return: 11% 7 MEDIAN PE MEDIAN PRIVATE Net IRR: 14% HIGH GRADE 6 MEDIAN PRIVATE CREDIT/PE BLENDED 2 1 ATHENE 5 ALPHA CREDIT Net IRR: 13% Avg Yield: 4.5% T5y Avg Yield: 4.5% Net IRR: 10% AUM: $194B S&P LL100 Strategy AUM: $10B Return: 8% APOLLO STRATEGY ATHENE PEER 1 IG CORP 2 GROUP MARKET INDICATOR T5y Avg Yield: Avg Yield: 4.2% 1.5% RISK Note: Data as of June 30, 2021, unless otherwise noted. Not a comprehensive list of all Apollo funds and were chosen on the basis of illustrative mandates across the platform. Apollo Strategy and corresponding Market Indicator are not directly comparable. Actual results may vary and these returns may differ substantially from the strategies. There can be no guarantee or assurance that similar opportunities will become available, particularly on a direct basis, in the future or if available, that such opportunities will achieve target returns once realized. Additional information is available upon request. Past performance is not indicative of future results. Please see the Appendix for important information on index performance. IRR calculations based on Apollo calculations, not an industry standard. Footnote explanations may be found in presentation endnotes. APOLLO INVESTOR DAY 2021 19 RETURNWe Produce Excess Return Across the Risk Spectrum YIELD HYBRID EQUITY 8 FLAGSHIP PE HYBRID VALUE I INFRA EQUITY Gross IRR: 39% Gross IRR: 29% Gross IRR: 26% Net IRR: 25% 4 Net IRR: 23% ACCORD SERIES Net IRR: 20% Strategy AUM: $63B Strategy AUM: $13B Gross IRR: 22% Strategy AUM: $3B Net IRR: 17% Strategy AUM: $5B LARGE CORPORATE 3 CREDIT Return: 11% 7 MEDIAN PE MEDIAN PRIVATE Net IRR: 14% HIGH GRADE 6 MEDIAN PRIVATE CREDIT/PE BLENDED 2 1 ATHENE 5 ALPHA CREDIT Net IRR: 13% Avg Yield: 4.5% T5y Avg Yield: 4.5% Net IRR: 10% AUM: $194B S&P LL100 Strategy AUM: $10B Return: 8% APOLLO STRATEGY ATHENE PEER 1 IG CORP 2 GROUP MARKET INDICATOR T5y Avg Yield: Avg Yield: 4.2% 1.5% RISK Note: Data as of June 30, 2021, unless otherwise noted. Not a comprehensive list of all Apollo funds and were chosen on the basis of illustrative mandates across the platform. Apollo Strategy and corresponding Market Indicator are not directly comparable. Actual results may vary and these returns may differ substantially from the strategies. There can be no guarantee or assurance that similar opportunities will become available, particularly on a direct basis, in the future or if available, that such opportunities will achieve target returns once realized. Additional information is available upon request. Past performance is not indicative of future results. Please see the Appendix for important information on index performance. IRR calculations based on Apollo calculations, not an industry standard. Footnote explanations may be found in presentation endnotes. APOLLO INVESTOR DAY 2021 19 RETURN
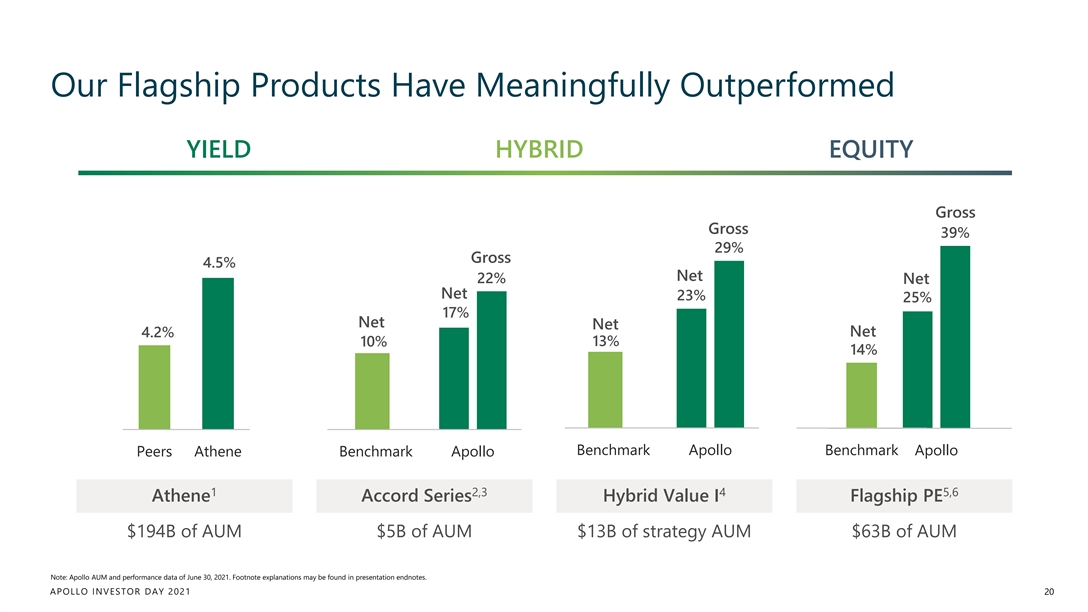
Our Flagship Products Have Meaningfully Outperformed YIELD HYBRID EQUITY Gross Gross 39% 29% Gross 4.5% Net 22% Net Net 23% 25% 17% Net Net 4.2% Net 13% 10% 14% Benchmark Apollo Benchmark Apollo Peers Athene Benchmark Apollo 1 2,3 4 5,6 Athene Accord Series Hybrid Value I Flagship PE $194B of AUM $5B of AUM $13B of strategy AUM $63B of AUM Note: Apollo AUM and performance data of June 30, 2021. Footnote explanations may be found in presentation endnotes. APOLLO INVESTOR DAY 2021 20Our Flagship Products Have Meaningfully Outperformed YIELD HYBRID EQUITY Gross Gross 39% 29% Gross 4.5% Net 22% Net Net 23% 25% 17% Net Net 4.2% Net 13% 10% 14% Benchmark Apollo Benchmark Apollo Peers Athene Benchmark Apollo 1 2,3 4 5,6 Athene Accord Series Hybrid Value I Flagship PE $194B of AUM $5B of AUM $13B of strategy AUM $63B of AUM Note: Apollo AUM and performance data of June 30, 2021. Footnote explanations may be found in presentation endnotes. APOLLO INVESTOR DAY 2021 20
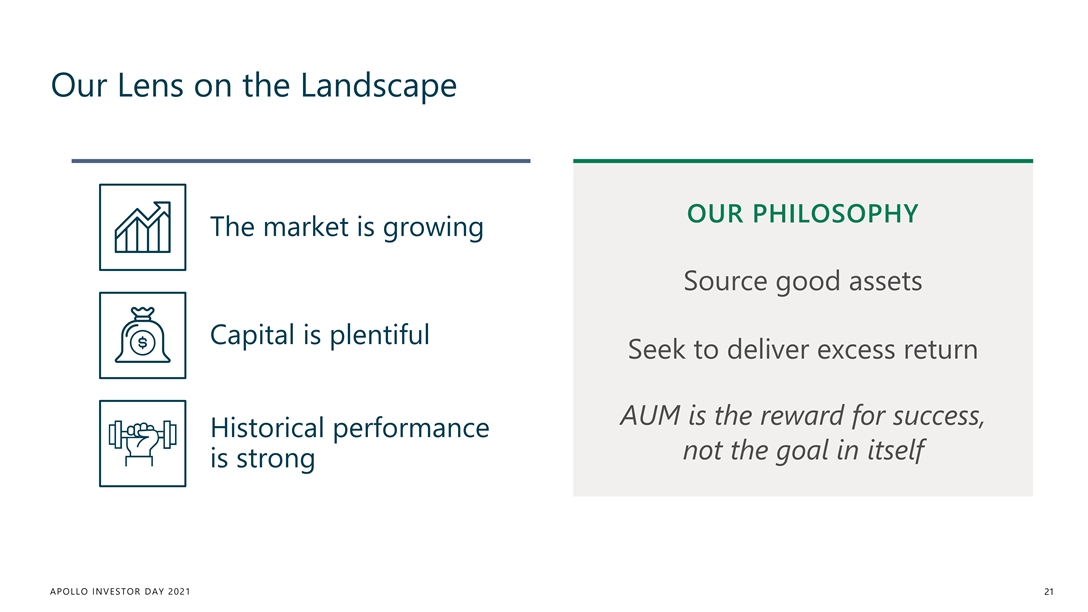
Our Lens on the Landscape OUR PHILOSOPHY The market is growing Source good assets Capital is plentiful Seek to deliver excess return AUM is the reward for success, Historical performance not the goal in itself is strong APOLLO INVESTOR DAY 2021 21Our Lens on the Landscape OUR PHILOSOPHY The market is growing Source good assets Capital is plentiful Seek to deliver excess return AUM is the reward for success, Historical performance not the goal in itself is strong APOLLO INVESTOR DAY 2021 21
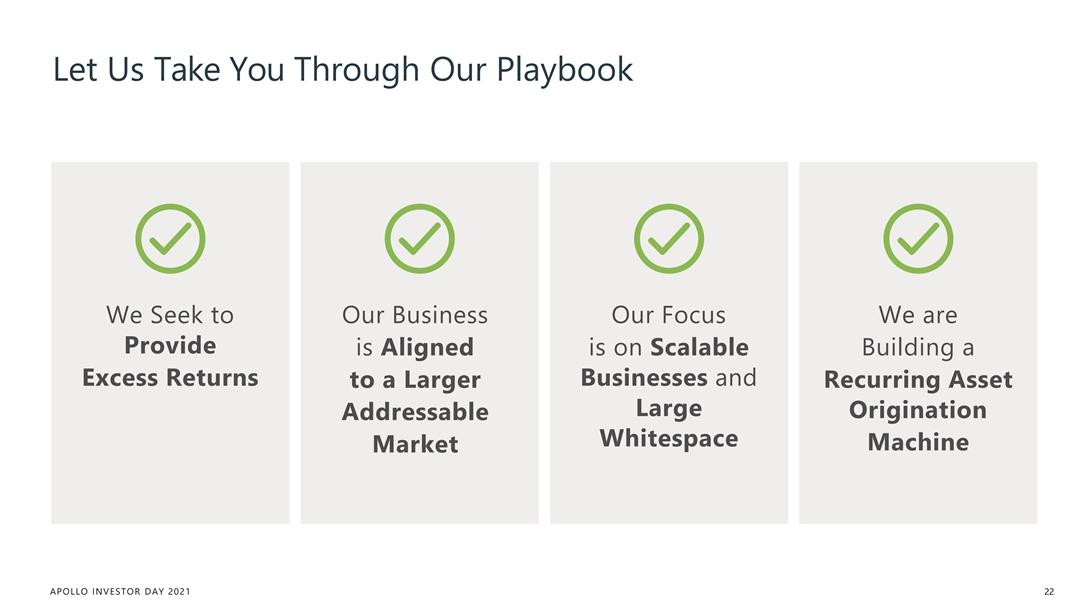
Let Us Take You Through Our Playbook We Seek to Our Business Our Focus We are Provide is Aligned is on Scalable Building a Excess Returns Businesses and to a Larger Recurring Asset Large Origination Addressable Whitespace Machine Market APOLLO INVESTOR DAY 2021 22Let Us Take You Through Our Playbook We Seek to Our Business Our Focus We are Provide is Aligned is on Scalable Building a Excess Returns Businesses and to a Larger Recurring Asset Large Origination Addressable Whitespace Machine Market APOLLO INVESTOR DAY 2021 22
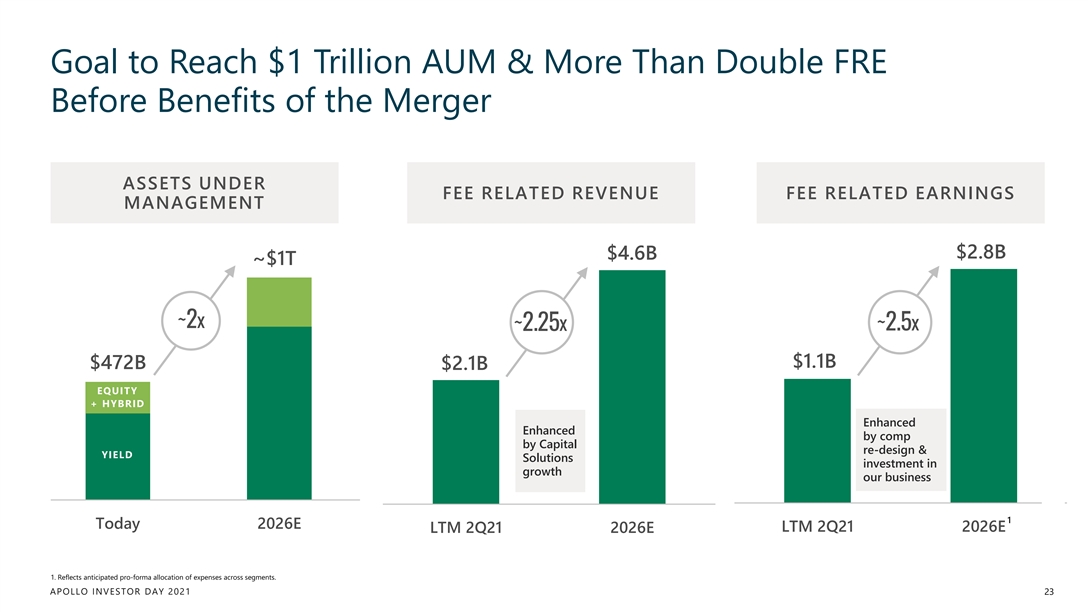
Goal to Reach $1 Trillion AUM & More Than Double FRE Before Benefits of the Merger ASSETS UNDER FEE RELATED REVENUE FEE RELATED EARNINGS MANAGEMENT $2.8B $4.6B ~$1T ~2x ~2.25x ~2.5x $1.1B $472B $2.1B EQUITY + HYBRID Enhanced Enhanced by comp by Capital re-design & YIELD Solutions investment in growth our business 1 Today 2026E LTM 2Q21 2026E LTM 2Q21 2026E 1. Reflects anticipated pro-forma allocation of expenses across segments. APOLLO INVESTOR DAY 2021 23
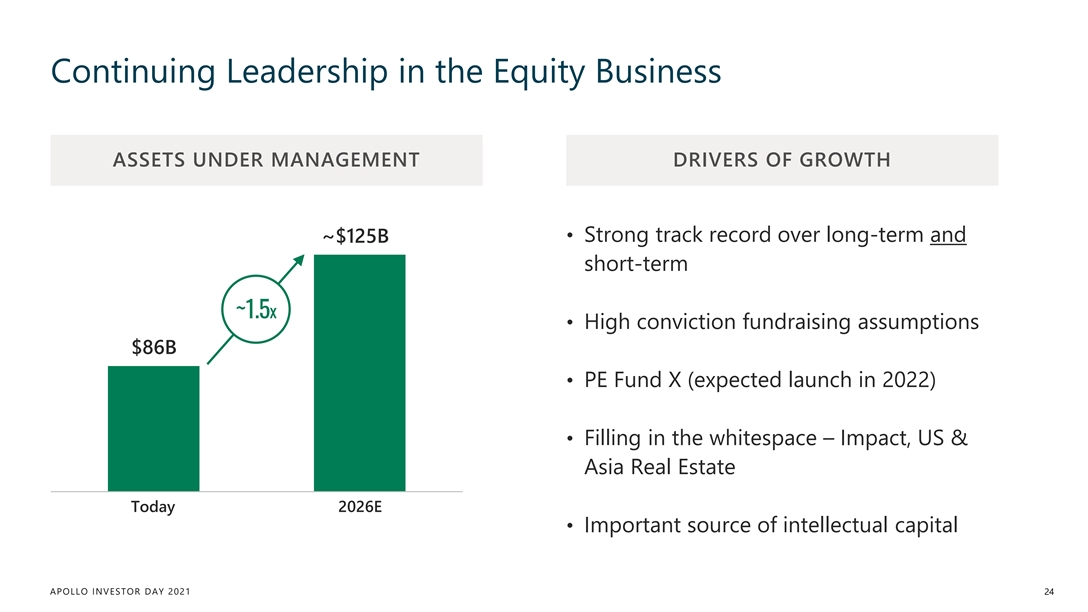
Continuing Leadership in the Equity Business ASSETS UNDER MANAGEMENT DRIVERS OF GROWTH • Strong track record over long-term and ~$125B short-term ~1.5x • High conviction fundraising assumptions $86B • PE Fund X (expected launch in 2022) • Filling in the whitespace – Impact, US & Asia Real Estate Today 2026E • Important source of intellectual capital APOLLO INVESTOR DAY 2021 24Continuing Leadership in the Equity Business ASSETS UNDER MANAGEMENT DRIVERS OF GROWTH • Strong track record over long-term and ~$125B short-term ~1.5x • High conviction fundraising assumptions $86B • PE Fund X (expected launch in 2022) • Filling in the whitespace – Impact, US & Asia Real Estate Today 2026E • Important source of intellectual capital APOLLO INVESTOR DAY 2021 24
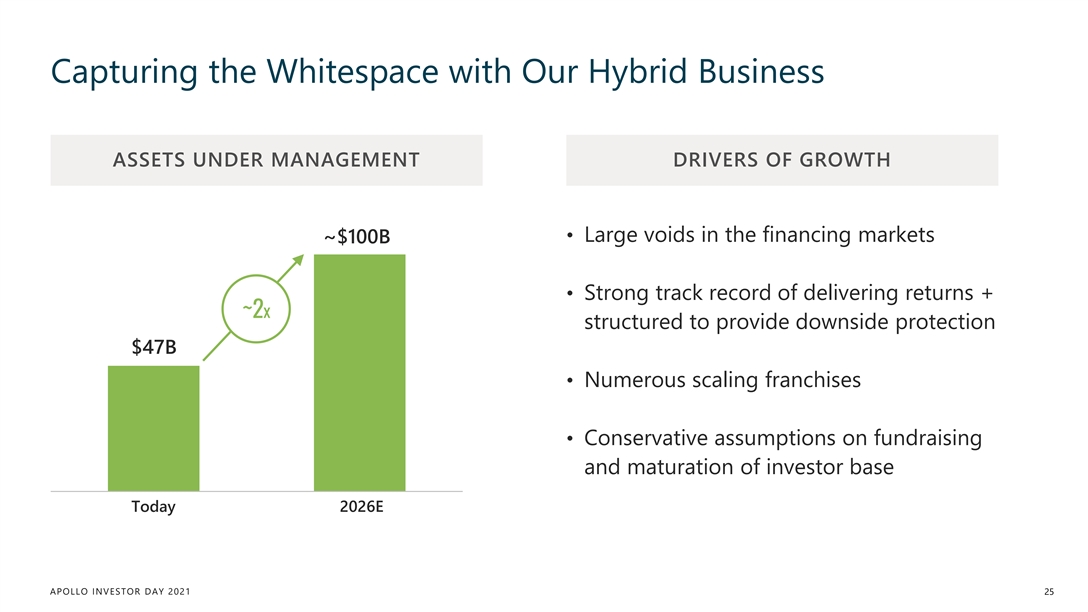
Capturing the Whitespace with Our Hybrid Business ASSETS UNDER MANAGEMENT DRIVERS OF GROWTH • Large voids in the financing markets ~$100B • Strong track record of delivering returns + ~2x structured to provide downside protection $47B • Numerous scaling franchises • Conservative assumptions on fundraising and maturation of investor base Today 2026E APOLLO INVESTOR DAY 2021 25Capturing the Whitespace with Our Hybrid Business ASSETS UNDER MANAGEMENT DRIVERS OF GROWTH • Large voids in the financing markets ~$100B • Strong track record of delivering returns + ~2x structured to provide downside protection $47B • Numerous scaling franchises • Conservative assumptions on fundraising and maturation of investor base Today 2026E APOLLO INVESTOR DAY 2021 25
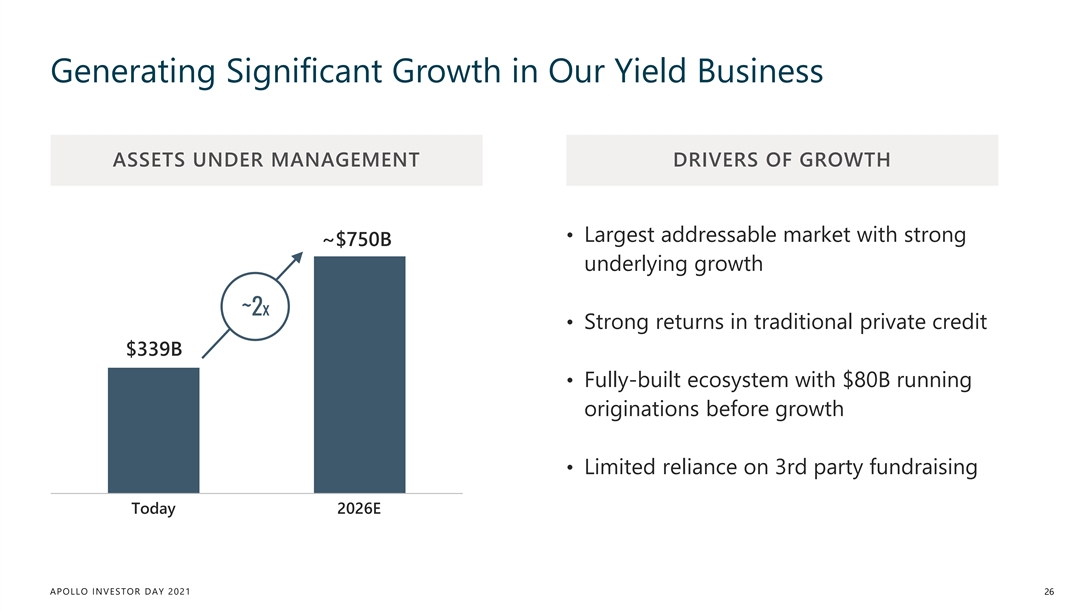
Generating Significant Growth in Our Yield Business ASSETS UNDER MANAGEMENT DRIVERS OF GROWTH • Largest addressable market with strong ~$750B underlying growth ~2x • Strong returns in traditional private credit $339B • Fully-built ecosystem with $80B running originations before growth • Limited reliance on 3rd party fundraising Today 2026E APOLLO INVESTOR DAY 2021 26Generating Significant Growth in Our Yield Business ASSETS UNDER MANAGEMENT DRIVERS OF GROWTH • Largest addressable market with strong ~$750B underlying growth ~2x • Strong returns in traditional private credit $339B • Fully-built ecosystem with $80B running originations before growth • Limited reliance on 3rd party fundraising Today 2026E APOLLO INVESTOR DAY 2021 26
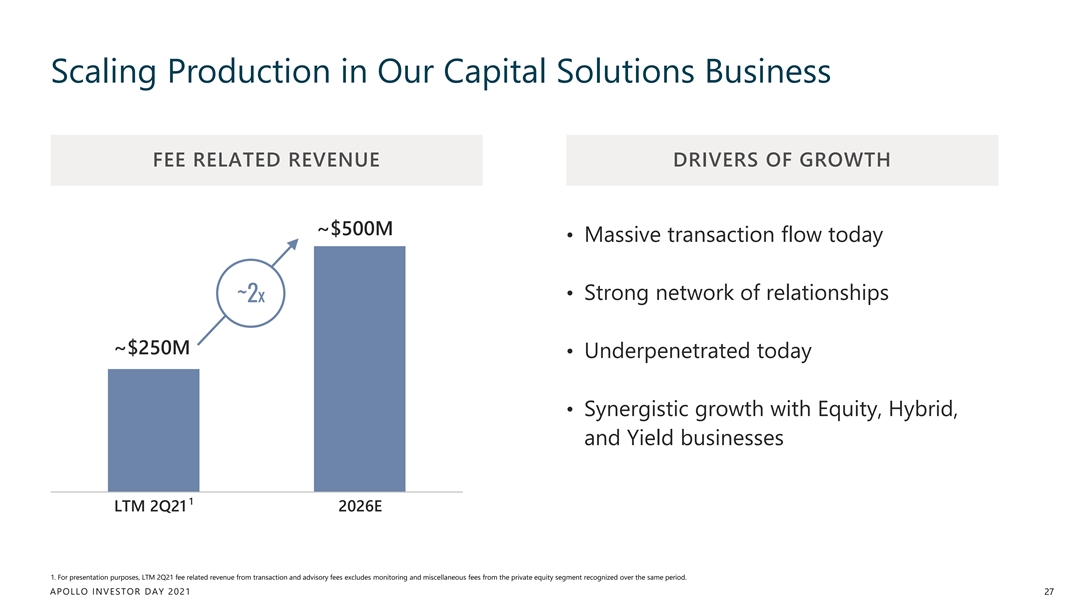
Scaling Production in Our Capital Solutions Business FEE RELATED REVENUE DRIVERS OF GROWTH ~$500M • Massive transaction flow today • Strong network of relationships ~2x ~$250M • Underpenetrated today • Synergistic growth with Equity, Hybrid, and Yield businesses 1 LTM 2Q21 2026E 1. For presentation purposes, LTM 2Q21 fee related revenue from transaction and advisory fees excludes monitoring and miscellaneous fees from the private equity segment recognized over the same period. APOLLO INVESTOR DAY 2021 27Scaling Production in Our Capital Solutions Business FEE RELATED REVENUE DRIVERS OF GROWTH ~$500M • Massive transaction flow today • Strong network of relationships ~2x ~$250M • Underpenetrated today • Synergistic growth with Equity, Hybrid, and Yield businesses 1 LTM 2Q21 2026E 1. For presentation purposes, LTM 2Q21 fee related revenue from transaction and advisory fees excludes monitoring and miscellaneous fees from the private equity segment recognized over the same period. APOLLO INVESTOR DAY 2021 27

Base Plan of 18% Compound Annual FRE Growth and Investment of ~$5B of Capital, Before Embedded Options EMBEDDED BASE PLAN OPTIONS FinTech Investment of 18% Fee Related + ~$5B of Capital for + Democratization of Finance Earnings Growth Over + Growth (5yr CAGR) Next 5 Years Asia + $10B Capital Returned via Dividends & Buybacks APOLLO INVESTOR DAY 2021 28

2 Largest Addressable Market Among Alternatives Peers APOLLO INVESTOR DAY 2021 292 Largest Addressable Market Among Alternatives Peers APOLLO INVESTOR DAY 2021 29
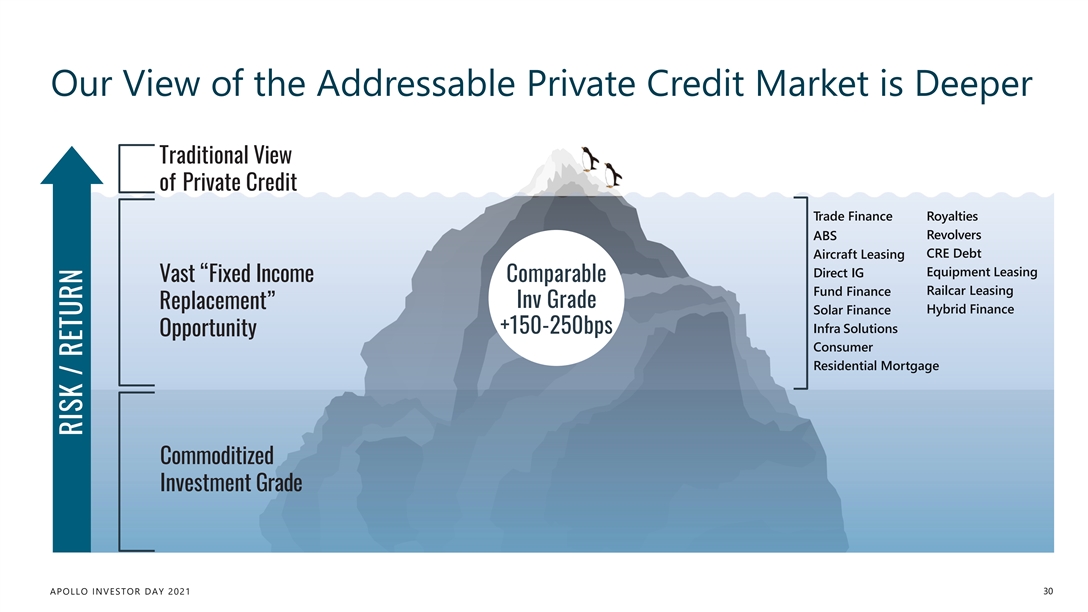
Our View of the Addressable Private Credit Market is Deeper Traditional View of Private Credit Trade Finance Royalties Revolvers ABS CRE Debt Aircraft Leasing Equipment Leasing Direct IG Vast “Fixed Income Comparable Railcar Leasing Fund Finance Inv Grade Replacement” Solar Finance Hybrid Finance Infra Solutions +150-250bps Opportunity Consumer Residential Mortgage Commoditized Investment Grade 30 APOLLO INVESTOR DAY 2021 RISK / RETURNOur View of the Addressable Private Credit Market is Deeper Traditional View of Private Credit Trade Finance Royalties Revolvers ABS CRE Debt Aircraft Leasing Equipment Leasing Direct IG Vast “Fixed Income Comparable Railcar Leasing Fund Finance Inv Grade Replacement” Solar Finance Hybrid Finance Infra Solutions +150-250bps Opportunity Consumer Residential Mortgage Commoditized Investment Grade 30 APOLLO INVESTOR DAY 2021 RISK / RETURN
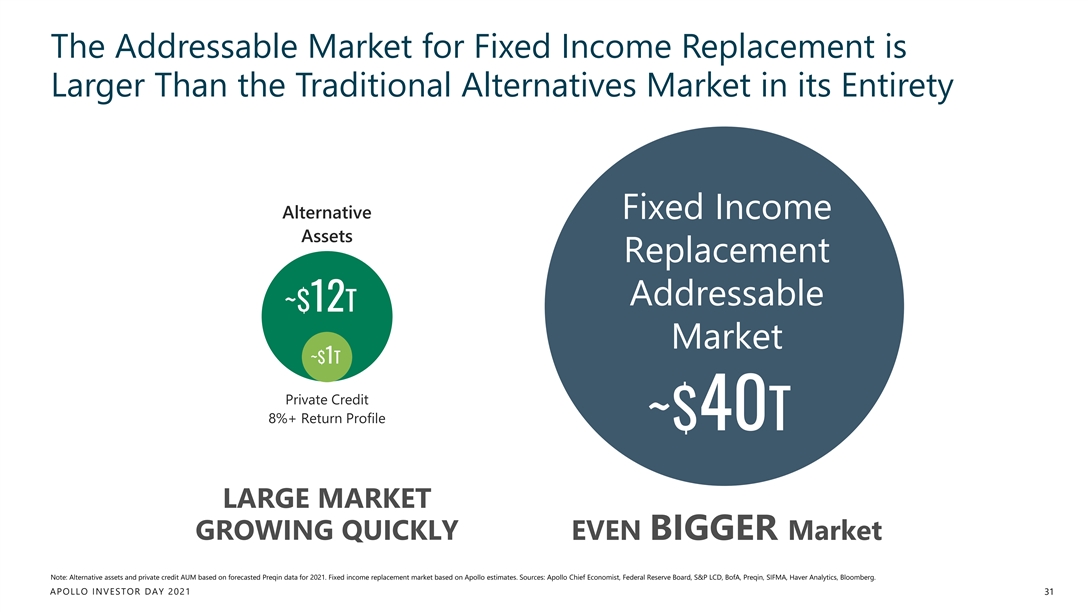
The Addressable Market for Fixed Income Replacement is Larger Than the Traditional Alternatives Market in its Entirety Alternative Fixed Income Assets Replacement Addressable ~$12T Market ~$1T Private Credit 8%+ Return Profile ~$40T LARGE MARKET GROWING QUICKLY EVEN BIGGER Market Note: Alternative assets and private credit AUM based on forecasted Preqin data for 2021. Fixed income replacement market based on Apollo estimates. Sources: Apollo Chief Economist, Federal Reserve Board, S&P LCD, BofA, Preqin, SIFMA, Haver Analytics, Bloomberg. APOLLO INVESTOR DAY 2021 31The Addressable Market for Fixed Income Replacement is Larger Than the Traditional Alternatives Market in its Entirety Alternative Fixed Income Assets Replacement Addressable ~$12T Market ~$1T Private Credit 8%+ Return Profile ~$40T LARGE MARKET GROWING QUICKLY EVEN BIGGER Market Note: Alternative assets and private credit AUM based on forecasted Preqin data for 2021. Fixed income replacement market based on Apollo estimates. Sources: Apollo Chief Economist, Federal Reserve Board, S&P LCD, BofA, Preqin, SIFMA, Haver Analytics, Bloomberg. APOLLO INVESTOR DAY 2021 31
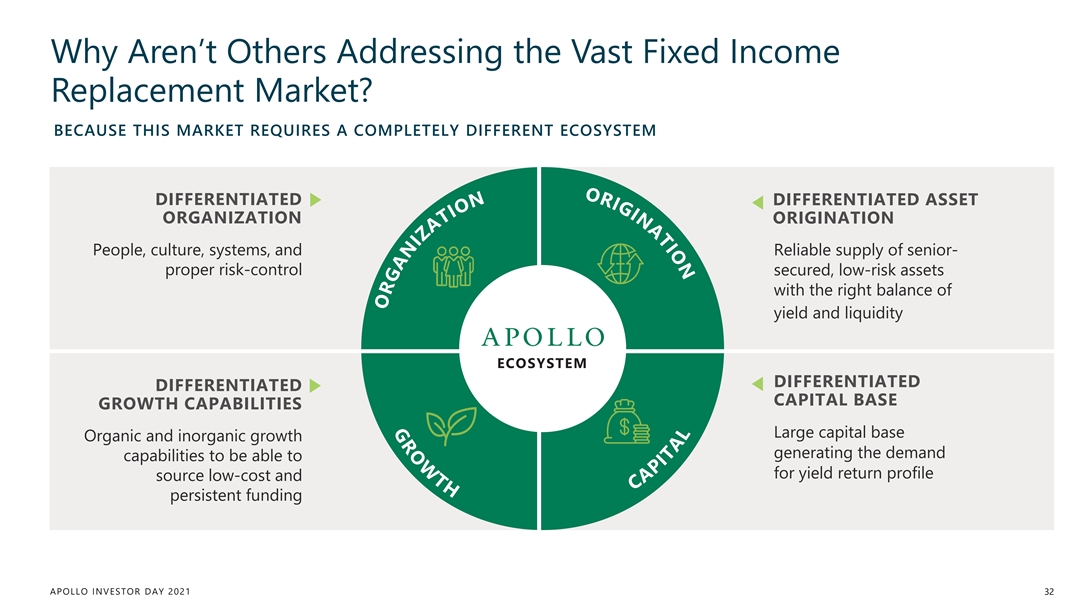
Why Aren’t Others Addressing the Vast Fixed Income Replacement Market? BECAUSE THIS MARKET REQUIRES A COMPLETELY DIFFERENT ECOSYSTEM DIFFERENTIATED DIFFERENTIATED ASSET ORGANIZATION ORIGINATION People, culture, systems, and Reliable supply of senior- proper risk-control secured, low-risk assets with the right balance of yield and liquidity ECOSYSTEM DIFFERENTIATED DIFFERENTIATED CAPITAL BASE GROWTH CAPABILITIES Large capital base Organic and inorganic growth generating the demand capabilities to be able to for yield return profile source low-cost and persistent funding APOLLO INVESTOR DAY 2021 32Why Aren’t Others Addressing the Vast Fixed Income Replacement Market? BECAUSE THIS MARKET REQUIRES A COMPLETELY DIFFERENT ECOSYSTEM DIFFERENTIATED DIFFERENTIATED ASSET ORGANIZATION ORIGINATION People, culture, systems, and Reliable supply of senior- proper risk-control secured, low-risk assets with the right balance of yield and liquidity ECOSYSTEM DIFFERENTIATED DIFFERENTIATED CAPITAL BASE GROWTH CAPABILITIES Large capital base Organic and inorganic growth generating the demand capabilities to be able to for yield return profile source low-cost and persistent funding APOLLO INVESTOR DAY 2021 32
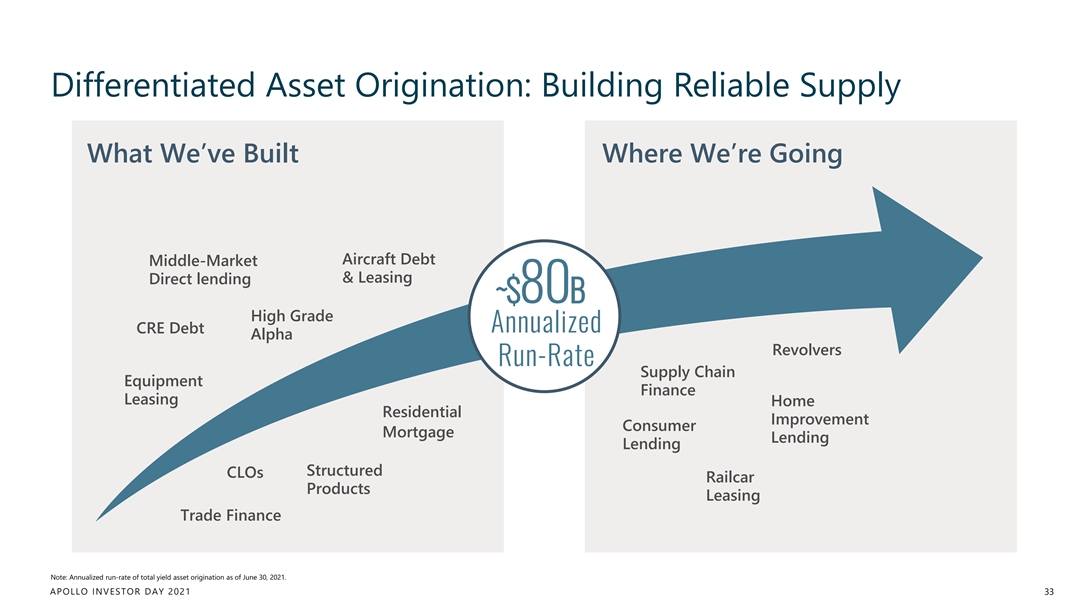
Differentiated Asset Origination: Building Reliable Supply What We’ve Built Where We’re Going Aircraft Debt Middle-Market & Leasing Direct lending ~$80B High Grade Annualized CRE Debt Alpha Revolvers Run-Rate Supply Chain Equipment Finance Leasing Home Residential Improvement Consumer Mortgage Lending Lending Structured CLOs Railcar Products Leasing Trade Finance Note: Annualized run-rate of total yield asset origination as of June 30, 2021. APOLLO INVESTOR DAY 2021 33
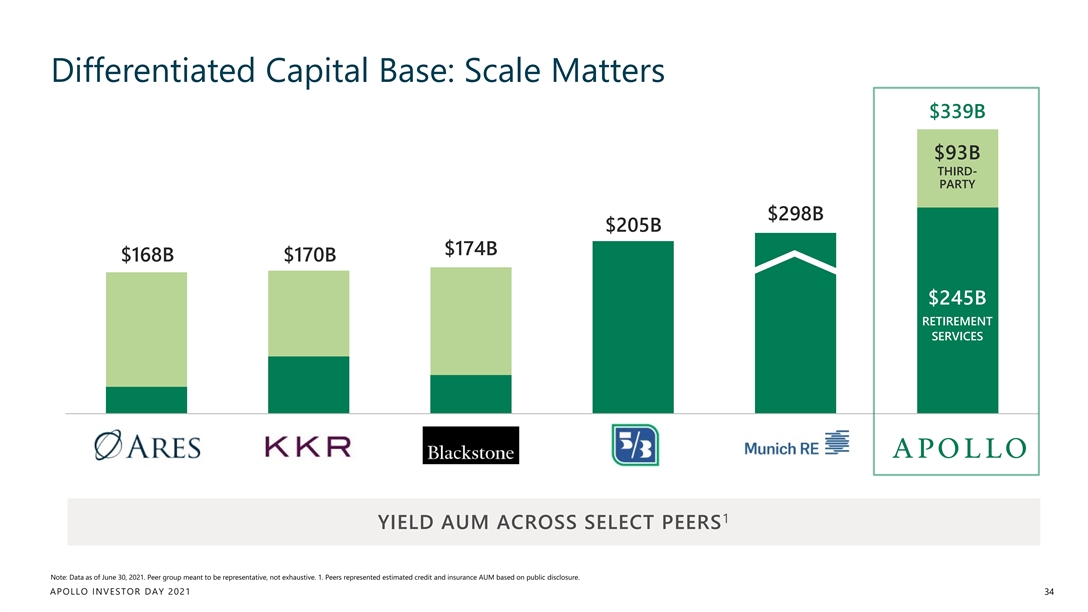
Differentiated Capital Base: Scale Matters $339B $93B THIRD- PARTY $298B $205B $174B $168B $170B $245B RETIREMENT SERVICES ALT PEER 1 ALT PEER 2 ALT PEER 3 REGIONAL BANK PEER LARGEST APOLLO YIELD AUM CREDIT & INSURANCE CREDIT & INSURANCE CREDIT & INSURANCE GLOBAL REINSURER AUM AUM AUM 1 YIELD AUM ACROSS SELECT PEERS Note: Data as of June 30, 2021. Peer group meant to be representative, not exhaustive. 1. Peers represented estimated credit and insurance AUM based on public disclosure. APOLLO INVESTOR DAY 2021 34Differentiated Capital Base: Scale Matters $339B $93B THIRD- PARTY $298B $205B $174B $168B $170B $245B RETIREMENT SERVICES ALT PEER 1 ALT PEER 2 ALT PEER 3 REGIONAL BANK PEER LARGEST APOLLO YIELD AUM CREDIT & INSURANCE CREDIT & INSURANCE CREDIT & INSURANCE GLOBAL REINSURER AUM AUM AUM 1 YIELD AUM ACROSS SELECT PEERS Note: Data as of June 30, 2021. Peer group meant to be representative, not exhaustive. 1. Peers represented estimated credit and insurance AUM based on public disclosure. APOLLO INVESTOR DAY 2021 34
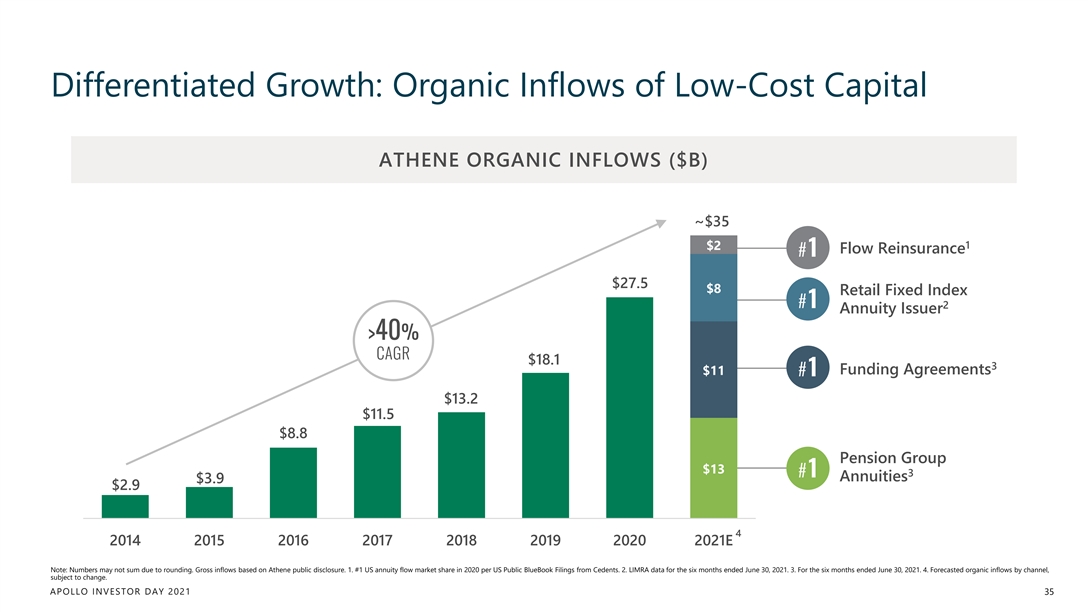
Differentiated Growth: Organic Inflows of Low-Cost Capital ATHENE ORGANIC INFLOWS ($B) ~$35 1 $2 Flow Reinsurance #1 $27.5 $8 Retail Fixed Index #1 2 Annuity Issuer >40% CAGR $18.1 3 Funding Agreements $11 #1 $13.2 $11.5 $8.8 Pension Group $13 3 #1 Annuities $3.9 $2.9 4 2014 2015 2016 2017 2018 2019 2020 2021E Note: Numbers may not sum due to rounding. Gross inflows based on Athene public disclosure. 1. #1 US annuity flow market share in 2020 per US Public BlueBook Filings from Cedents. 2. LIMRA data for the six months ended June 30, 2021. 3. For the six months ended June 30, 2021. 4. Forecasted organic inflows by channel, subject to change. APOLLO INVESTOR DAY 2021 35Differentiated Growth: Organic Inflows of Low-Cost Capital ATHENE ORGANIC INFLOWS ($B) ~$35 1 $2 Flow Reinsurance #1 $27.5 $8 Retail Fixed Index #1 2 Annuity Issuer >40% CAGR $18.1 3 Funding Agreements $11 #1 $13.2 $11.5 $8.8 Pension Group $13 3 #1 Annuities $3.9 $2.9 4 2014 2015 2016 2017 2018 2019 2020 2021E Note: Numbers may not sum due to rounding. Gross inflows based on Athene public disclosure. 1. #1 US annuity flow market share in 2020 per US Public BlueBook Filings from Cedents. 2. LIMRA data for the six months ended June 30, 2021. 3. For the six months ended June 30, 2021. 4. Forecasted organic inflows by channel, subject to change. APOLLO INVESTOR DAY 2021 35
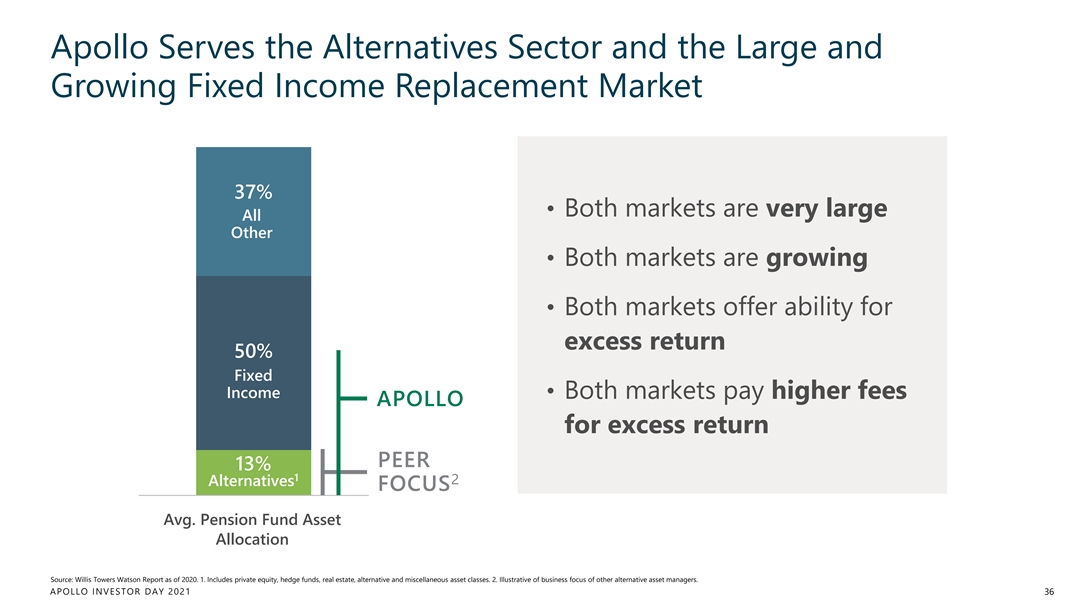
Apollo Serves the Alternatives Sector and the Large and Growing Fixed Income Replacement Market 37% • Both markets are very large All Other • Both markets are growing • Both markets offer ability for excess return 50% Fixed Income • Both markets pay higher fees APOLLO for excess return PEER 13% 1 2 Alternatives FOCUS Avg. Pension Fund Asset Avg. Pension Fund Asset Allocation Allocation (2020) Source: Willis Towers Watson Report as of 2020. 1. Includes private equity, hedge funds, real estate, alternative and miscellaneous asset classes. 2. Illustrative of business focus of other alternative asset managers. APOLLO INVESTOR DAY 2021 36Apollo Serves the Alternatives Sector and the Large and Growing Fixed Income Replacement Market 37% • Both markets are very large All Other • Both markets are growing • Both markets offer ability for excess return 50% Fixed Income • Both markets pay higher fees APOLLO for excess return PEER 13% 1 2 Alternatives FOCUS Avg. Pension Fund Asset Avg. Pension Fund Asset Allocation Allocation (2020) Source: Willis Towers Watson Report as of 2020. 1. Includes private equity, hedge funds, real estate, alternative and miscellaneous asset classes. 2. Illustrative of business focus of other alternative asset managers. APOLLO INVESTOR DAY 2021 36
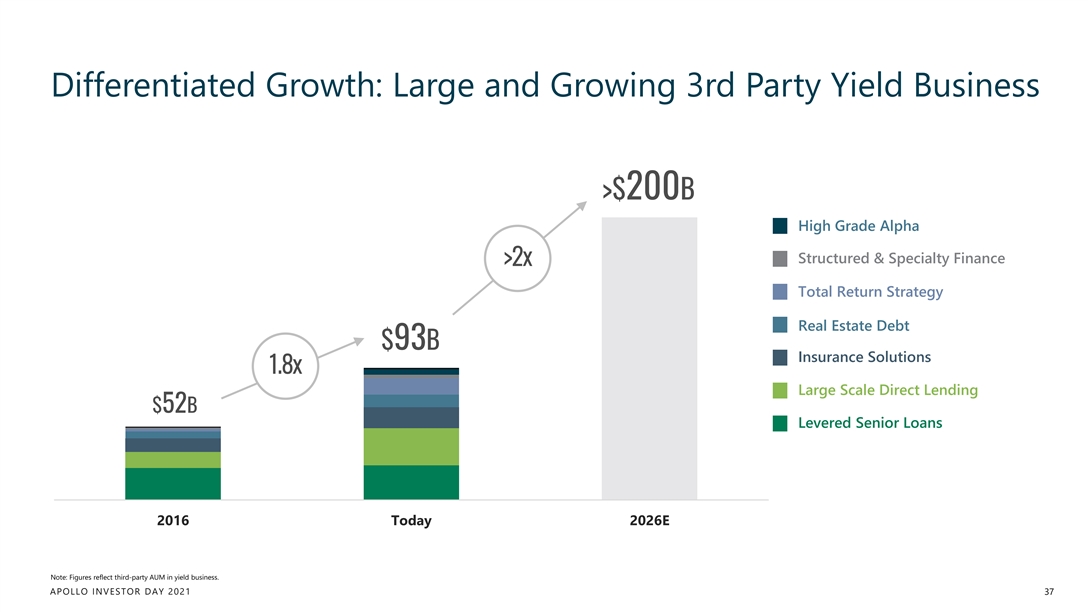
Differentiated Growth: Large and Growing 3rd Party Yield Business >$200B High Grade Alpha Structured & Specialty Finance >2x Total Return Strategy Real Estate Debt $93B Insurance Solutions 1.8x Large Scale Direct Lending $52B Levered Senior Loans 2016 Today 2026E Note: Figures reflect third-party AUM in yield business. APOLLO INVESTOR DAY 2021 37Differentiated Growth: Large and Growing 3rd Party Yield Business >$200B High Grade Alpha Structured & Specialty Finance >2x Total Return Strategy Real Estate Debt $93B Insurance Solutions 1.8x Large Scale Direct Lending $52B Levered Senior Loans 2016 Today 2026E Note: Figures reflect third-party AUM in yield business. APOLLO INVESTOR DAY 2021 37
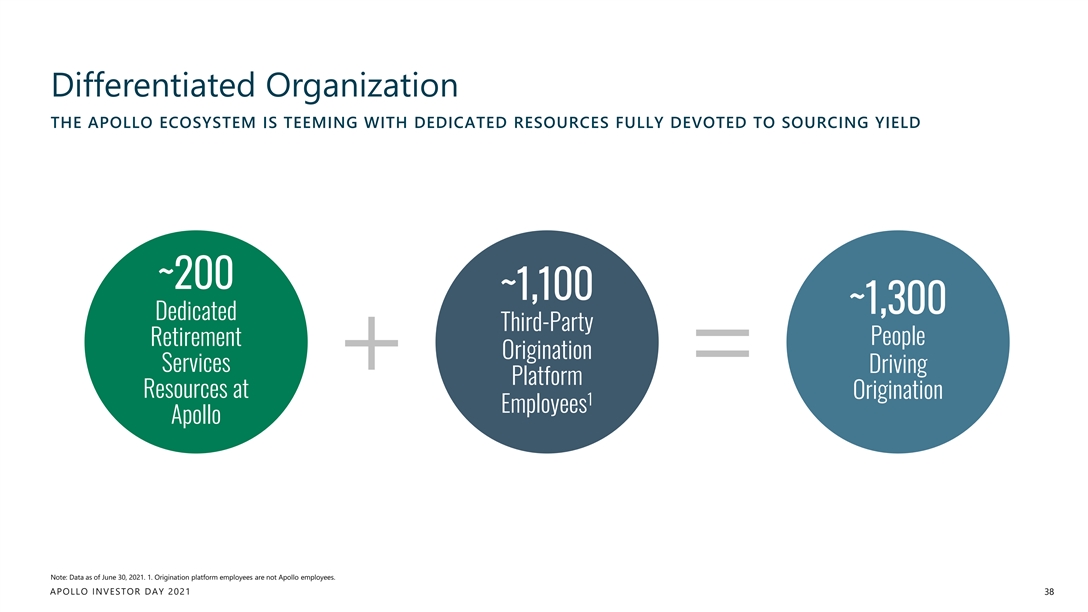
Differentiated Organization THE APOLLO ECOSYSTEM IS TEEMING WITH DEDICATED RESOURCES FULLY DEVOTED TO SOURCING YIELD ~200 ~1,100 ~1,300 Dedicated Third-Party People Retirement Origination Services Driving Platform Resources at Origination 1 Employees Apollo Note: Data as of June 30, 2021. 1. Origination platform employees are not Apollo employees. APOLLO INVESTOR DAY 2021 38Differentiated Organization THE APOLLO ECOSYSTEM IS TEEMING WITH DEDICATED RESOURCES FULLY DEVOTED TO SOURCING YIELD ~200 ~1,100 ~1,300 Dedicated Third-Party People Retirement Origination Services Driving Platform Resources at Origination 1 Employees Apollo Note: Data as of June 30, 2021. 1. Origination platform employees are not Apollo employees. APOLLO INVESTOR DAY 2021 38
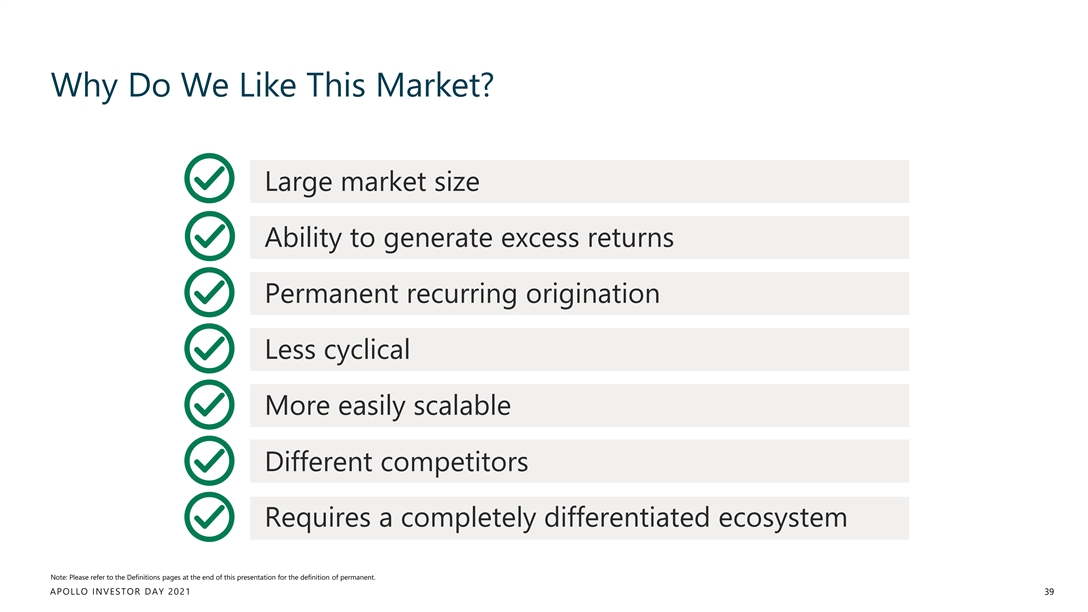
Why Do We Like This Market? Large market size Ability to generate excess returns Permanent recurring origination Less cyclical More easily scalable Different competitors Requires a completely differentiated ecosystem Note: Please refer to the Definitions pages at the end of this presentation for the definition of permanent. APOLLO INVESTOR DAY 2021 39
3 Athene is a Competitive Differentiator and Growth Accelerant APOLLO INVESTOR DAY 2021 40
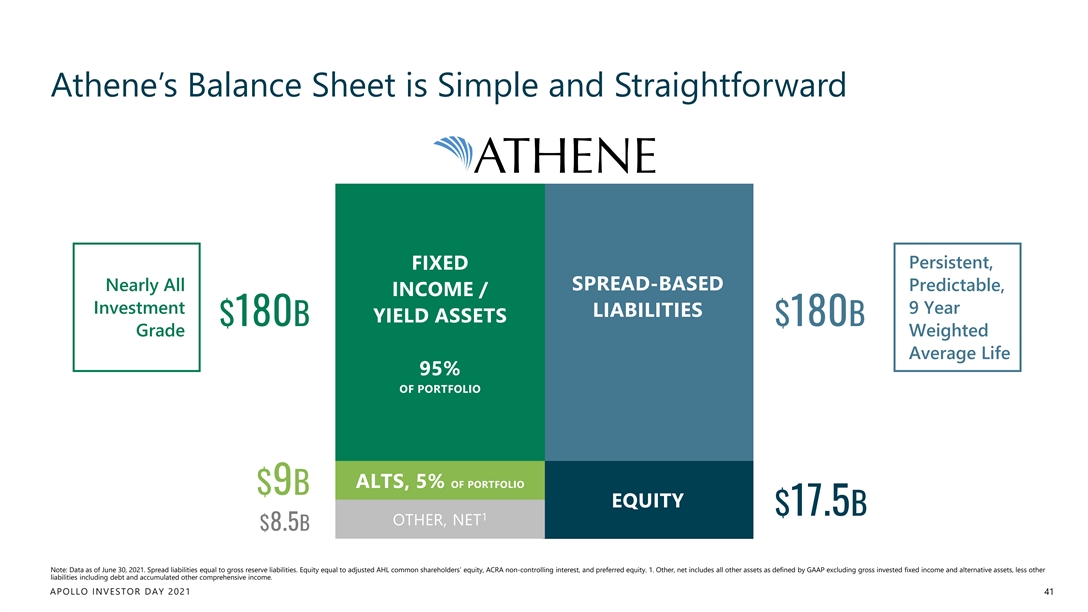
Athene’s Balance Sheet is Simple and Straightforward Persistent, FIXED SPREAD-BASED Nearly All Predictable, INCOME / Investment 9 Year LIABILITIES YIELD ASSETS $180B $180B Grade Weighted Average Life 95% OF PORTFOLIO ALTS, 5% OF PORTFOLIO $9B EQUITY $17.5B 1 OTHER, NET $8.5B Note: Data as of June 30, 2021. Spread liabilities equal to gross reserve liabilities. Equity equal to adjusted AHL common shareholders’ equity, ACRA non-controlling interest, and preferred equity. 1. Other, net includes all other assets as defined by GAAP excluding gross invested fixed income and alternative assets, less other liabilities including debt and accumulated other comprehensive income. APOLLO INVESTOR DAY 2021 41Athene’s Balance Sheet is Simple and Straightforward Persistent, FIXED SPREAD-BASED Nearly All Predictable, INCOME / Investment 9 Year LIABILITIES YIELD ASSETS $180B $180B Grade Weighted Average Life 95% OF PORTFOLIO ALTS, 5% OF PORTFOLIO $9B EQUITY $17.5B 1 OTHER, NET $8.5B Note: Data as of June 30, 2021. Spread liabilities equal to gross reserve liabilities. Equity equal to adjusted AHL common shareholders’ equity, ACRA non-controlling interest, and preferred equity. 1. Other, net includes all other assets as defined by GAAP excluding gross invested fixed income and alternative assets, less other liabilities including debt and accumulated other comprehensive income. APOLLO INVESTOR DAY 2021 41

Athene Has a Simple, Spread-Based Business Model STRONG TRACK RECORD OF PROFITABILITY & OUTPERFORMANCE TODAY TRAILING 3YR (Recent New Business, 1H21) (3Q18-2Q21) 1 ~30bps better vs others, net of fees Asset Yield 3.49% 4.38% Disciplined and dynamic pricing Cost of Funds 2.24% 2.77% 2 Opex & Taxes 0.22% 0.48% ~30bps more efficient OpEx vs others 3 Net Spread on Assets 1.03% 1.13% 4 5 ~300bps better vs others Implied ROE ~15% Note: Industry comparison noted as “others” represent a weighted average of AEL, AIG, AFG, FGL, LNC, MET, PRU, and PFG for the 5 years 2016 to 2020. Source: SNL Financial, Company Filings. Footnote explanations may be found in presentation endnotes. APOLLO INVESTOR DAY 2021 42Athene Has a Simple, Spread-Based Business Model STRONG TRACK RECORD OF PROFITABILITY & OUTPERFORMANCE TODAY TRAILING 3YR (Recent New Business, 1H21) (3Q18-2Q21) 1 ~30bps better vs others, net of fees Asset Yield 3.49% 4.38% Disciplined and dynamic pricing Cost of Funds 2.24% 2.77% 2 Opex & Taxes 0.22% 0.48% ~30bps more efficient OpEx vs others 3 Net Spread on Assets 1.03% 1.13% 4 5 ~300bps better vs others Implied ROE ~15% Note: Industry comparison noted as “others” represent a weighted average of AEL, AIG, AFG, FGL, LNC, MET, PRU, and PFG for the 5 years 2016 to 2020. Source: SNL Financial, Company Filings. Footnote explanations may be found in presentation endnotes. APOLLO INVESTOR DAY 2021 42
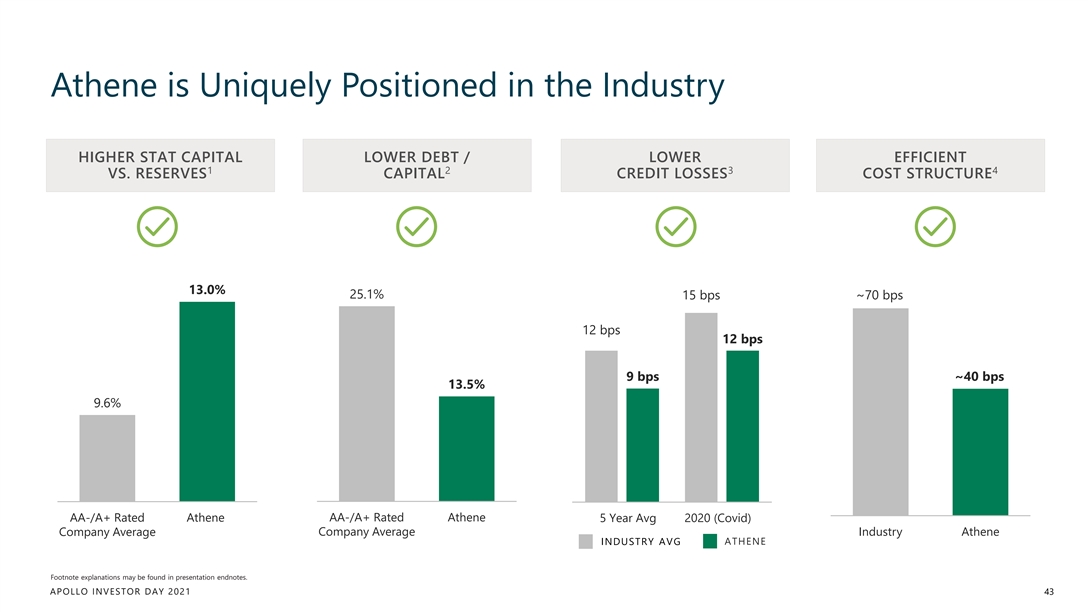
Athene is Uniquely Positioned in the Industry HIGHER STAT CAPITAL LOWER DEBT / LOWER EFFICIENT 1 2 3 4 VS. RESERVES CAPITAL CREDIT LOSSES COST STRUCTURE 13.0% 25.1% ~70 bps 15 bps 12 bps 12 bps 9 bps ~40 bps 13.5% 9.6% AA-/A+ Rated Athene AA-/A+ Rated Athene 5 Year Avg 2020 (Covid) Annuity Issuer Athene Company Average Company Average Industry Athene Peers INDUSTRY AVG ATHENE Footnote explanations may be found in presentation endnotes. APOLLO INVESTOR DAY 2021 43Athene is Uniquely Positioned in the Industry HIGHER STAT CAPITAL LOWER DEBT / LOWER EFFICIENT 1 2 3 4 VS. RESERVES CAPITAL CREDIT LOSSES COST STRUCTURE 13.0% 25.1% ~70 bps 15 bps 12 bps 12 bps 9 bps ~40 bps 13.5% 9.6% AA-/A+ Rated Athene AA-/A+ Rated Athene 5 Year Avg 2020 (Covid) Annuity Issuer Athene Company Average Company Average Industry Athene Peers INDUSTRY AVG ATHENE Footnote explanations may be found in presentation endnotes. APOLLO INVESTOR DAY 2021 43
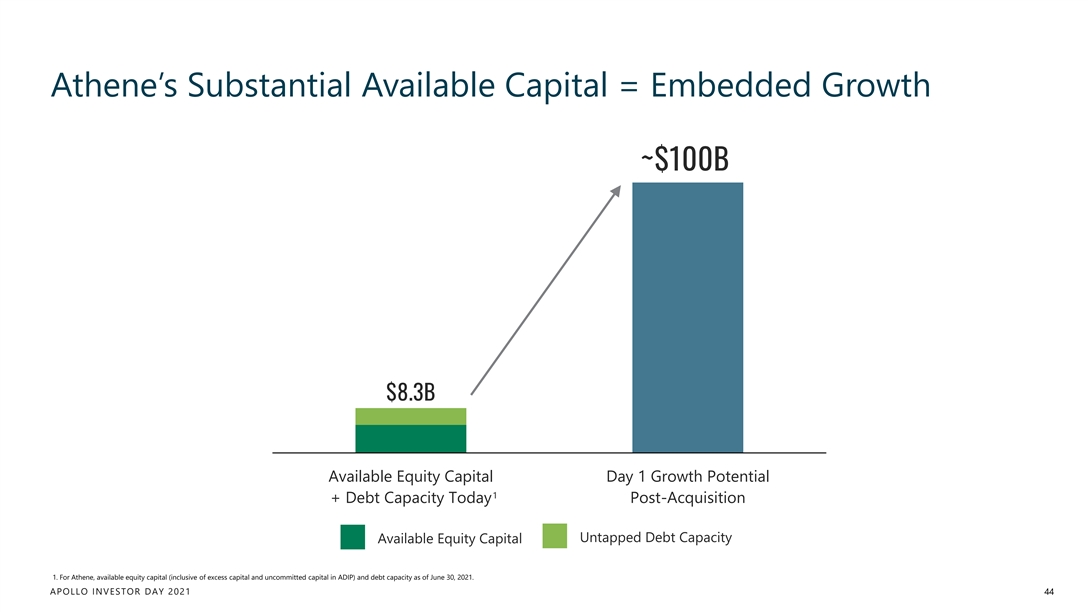
Athene’s Substantial Available Capital = Embedded Growth ~$100B $8.3B Available Equity Capital Day 1 Growth Potential 1 + Debt Capacity Today Post-Acquisition Untapped Debt Capacity Available Equity Capital 1. For Athene, available equity capital (inclusive of excess capital and uncommitted capital in ADIP) and debt capacity as of June 30, 2021. APOLLO INVESTOR DAY 2021 44Athene’s Substantial Available Capital = Embedded Growth ~$100B $8.3B Available Equity Capital Day 1 Growth Potential 1 + Debt Capacity Today Post-Acquisition Untapped Debt Capacity Available Equity Capital 1. For Athene, available equity capital (inclusive of excess capital and uncommitted capital in ADIP) and debt capacity as of June 30, 2021. APOLLO INVESTOR DAY 2021 44
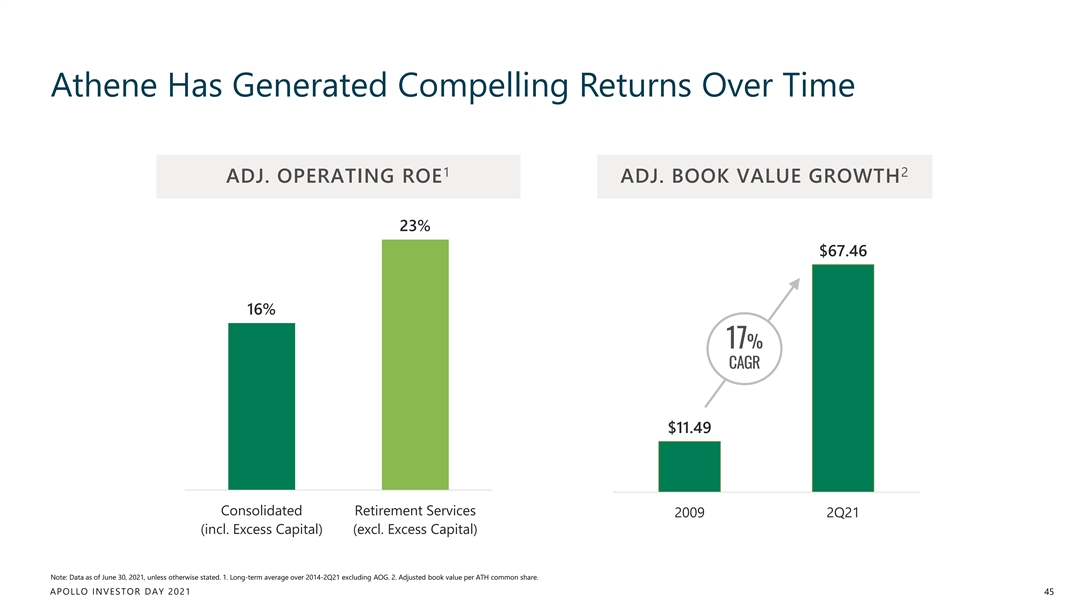
Athene Has Generated Compelling Returns Over Time 1 2 ADJ. OPERATING ROE ADJ. BOOK VALUE GROWTH 23% $67.46 16% 17% CAGR $11.49 Consolidated Retirement Services 2009 2Q21 (incl. Excess Capital) (excl. Excess Capital) Note: Data as of June 30, 2021, unless otherwise stated. 1. Long-term average over 2014-2Q21 excluding AOG. 2. Adjusted book value per ATH common share. APOLLO INVESTOR DAY 2021 45Athene Has Generated Compelling Returns Over Time 1 2 ADJ. OPERATING ROE ADJ. BOOK VALUE GROWTH 23% $67.46 16% 17% CAGR $11.49 Consolidated Retirement Services 2009 2Q21 (incl. Excess Capital) (excl. Excess Capital) Note: Data as of June 30, 2021, unless otherwise stated. 1. Long-term average over 2014-2Q21 excluding AOG. 2. Adjusted book value per ATH common share. APOLLO INVESTOR DAY 2021 45
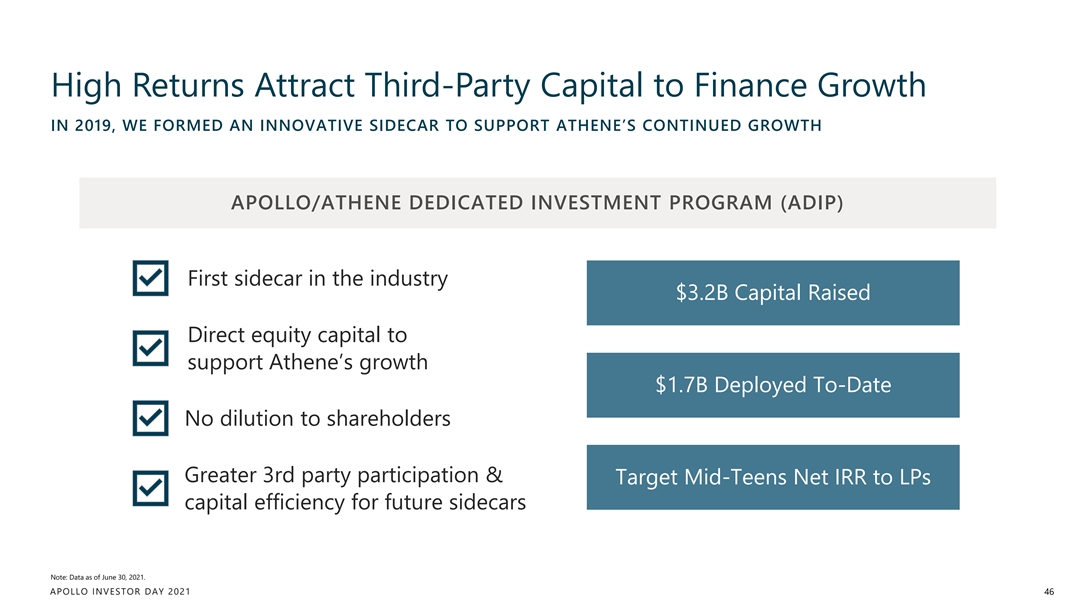
High Returns Attract Third-Party Capital to Finance Growth IN 2019, WE FORMED AN INNOVATIVE SIDECAR TO SUPPORT ATHENE’S CONTINUED GROWTH APOLLO/ATHENE DEDICATED INVESTMENT PROGRAM (ADIP) First sidecar in the industry $3.2B Capital Raised Direct equity capital to support Athene’s growth $1.7B Deployed To-Date No dilution to shareholders Greater 3rd party participation & Target Mid-Teens Net IRR to LPs capital efficiency for future sidecars Note: Data as of June 30, 2021. APOLLO INVESTOR DAY 2021 46High Returns Attract Third-Party Capital to Finance Growth IN 2019, WE FORMED AN INNOVATIVE SIDECAR TO SUPPORT ATHENE’S CONTINUED GROWTH APOLLO/ATHENE DEDICATED INVESTMENT PROGRAM (ADIP) First sidecar in the industry $3.2B Capital Raised Direct equity capital to support Athene’s growth $1.7B Deployed To-Date No dilution to shareholders Greater 3rd party participation & Target Mid-Teens Net IRR to LPs capital efficiency for future sidecars Note: Data as of June 30, 2021. APOLLO INVESTOR DAY 2021 46
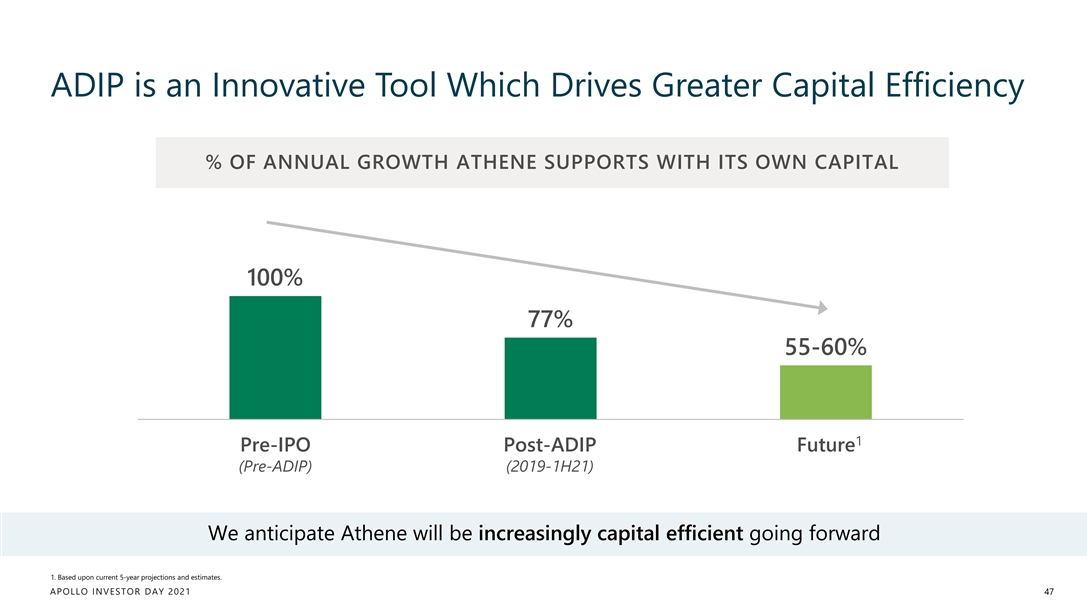
ADIP is an Innovative Tool Which Drives Greater Capital Efficiency % OF ANNUAL GROWTH ATHENE SUPPORTS WITH ITS OWN CAPITAL 100% 77% 55-60% 1 Pre-IPO Post-ADIP Future Pre-ADIP 2019-1H21 Next 5 Years (Pre-ADIP) (2019-1H21) We anticipate Athene will be increasingly capital efficient going forward 1. Based upon current 5-year projections and estimates. APOLLO INVESTOR DAY 2021 47ADIP is an Innovative Tool Which Drives Greater Capital Efficiency % OF ANNUAL GROWTH ATHENE SUPPORTS WITH ITS OWN CAPITAL 100% 77% 55-60% 1 Pre-IPO Post-ADIP Future Pre-ADIP 2019-1H21 Next 5 Years (Pre-ADIP) (2019-1H21) We anticipate Athene will be increasingly capital efficient going forward 1. Based upon current 5-year projections and estimates. APOLLO INVESTOR DAY 2021 47
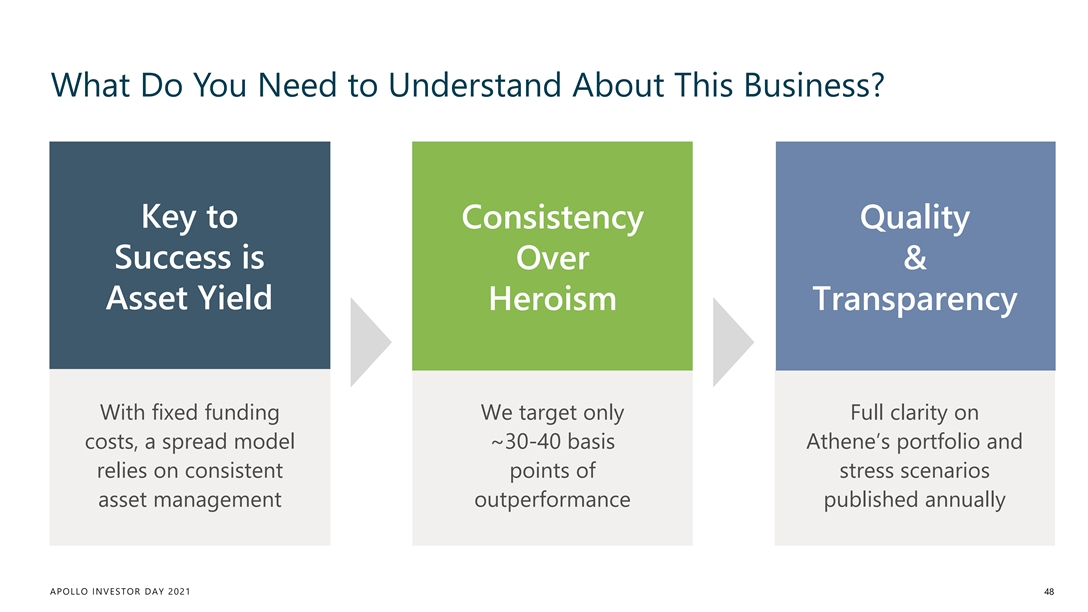
What Do You Need to Understand About This Business? Key to Consistency Quality Success is Over & Asset Yield Heroism Transparency With fixed funding We target only Full clarity on costs, a spread model ~30-40 basis Athene’s portfolio and relies on consistent points of stress scenarios asset management outperformance published annually APOLLO INVESTOR DAY 2021 48
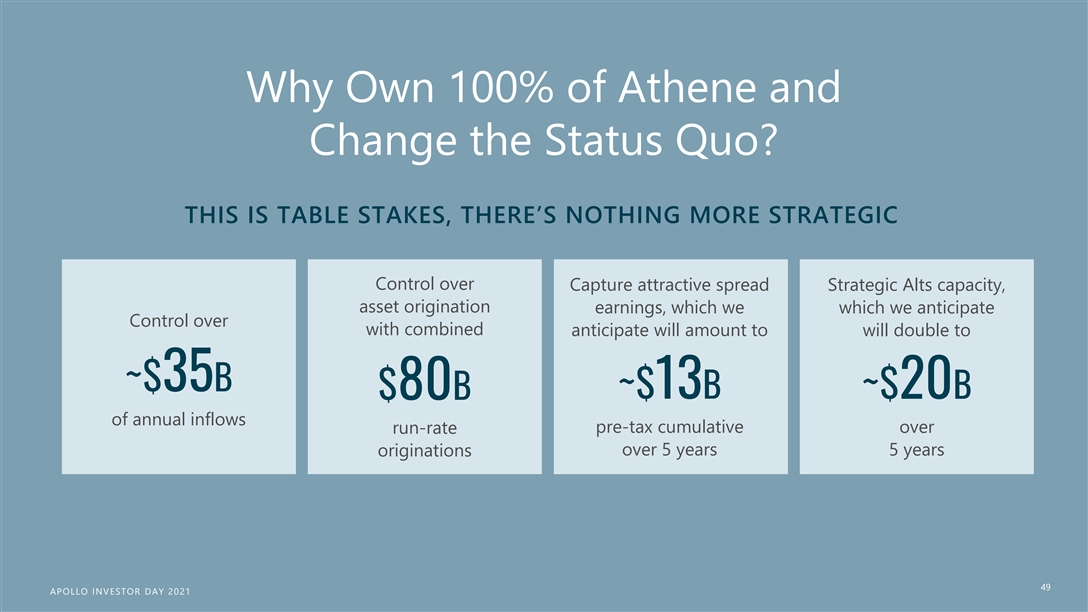
Why Own 100% of Athene and Change the Status Quo? THIS IS TABLE STAKES, THERE’S NOTHING MORE STRATEGIC Control over Capture attractive spread Strategic Alts capacity, asset origination earnings, which we which we anticipate Control over with combined anticipate will amount to will double to ~$35B ~$13B ~$20B $80B of annual inflows pre-tax cumulative over run-rate over 5 years 5 years originations 49 A AP PO OL LL LO O IIN NV VE ES ST TO OR R D DA AY Y 2021 2021Why Own 100% of Athene and Change the Status Quo? THIS IS TABLE STAKES, THERE’S NOTHING MORE STRATEGIC Control over Capture attractive spread Strategic Alts capacity, asset origination earnings, which we which we anticipate Control over with combined anticipate will amount to will double to ~$35B ~$13B ~$20B $80B of annual inflows pre-tax cumulative over run-rate over 5 years 5 years originations 49 A AP PO OL LL LO O IIN NV VE ES ST TO OR R D DA AY Y 2021 2021
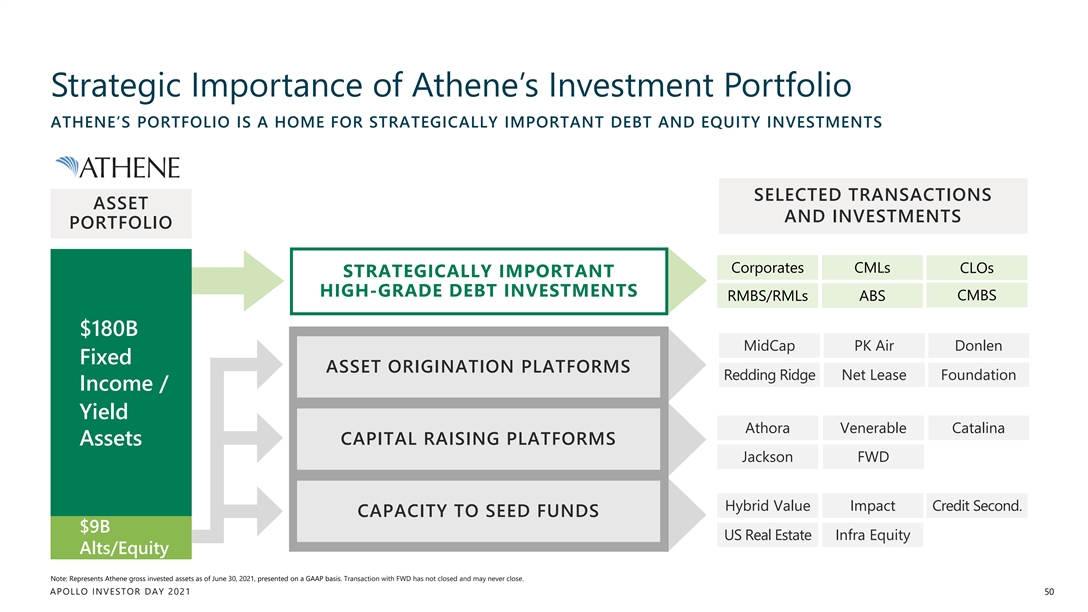
Strategic Importance of Athene’s Investment Portfolio ATHENE’S PORTFOLIO IS A HOME FOR STRATEGICALLY IMPORTANT DEBT AND EQUITY INVESTMENTS SELECTED TRANSACTIONS ASSET AND INVESTMENTS PORTFOLIO Corporates CMLs CLOs STRATEGICALLY IMPORTANT HIGH-GRADE DEBT INVESTMENTS CMBS RMBS/RMLs ABS $180B MidCap PK Air Donlen Fixed ASSET ORIGINATION PLATFORMS Redding Ridge Net Lease Foundation Income / Yield Athora Venerable Catalina CAPITAL RAISING PLATFORMS Assets Jackson FWD Hybrid Value Impact Credit Second. CAPACITY TO SEED FUNDS $9B US Real Estate Infra Equity Alts/Equity Note: Represents Athene gross invested assets as of June 30, 2021, presented on a GAAP basis. Transaction with FWD has not closed and may never close. APOLLO INVESTOR DAY 2021 50Strategic Importance of Athene’s Investment Portfolio ATHENE’S PORTFOLIO IS A HOME FOR STRATEGICALLY IMPORTANT DEBT AND EQUITY INVESTMENTS SELECTED TRANSACTIONS ASSET AND INVESTMENTS PORTFOLIO Corporates CMLs CLOs STRATEGICALLY IMPORTANT HIGH-GRADE DEBT INVESTMENTS CMBS RMBS/RMLs ABS $180B MidCap PK Air Donlen Fixed ASSET ORIGINATION PLATFORMS Redding Ridge Net Lease Foundation Income / Yield Athora Venerable Catalina CAPITAL RAISING PLATFORMS Assets Jackson FWD Hybrid Value Impact Credit Second. CAPACITY TO SEED FUNDS $9B US Real Estate Infra Equity Alts/Equity Note: Represents Athene gross invested assets as of June 30, 2021, presented on a GAAP basis. Transaction with FWD has not closed and may never close. APOLLO INVESTOR DAY 2021 50
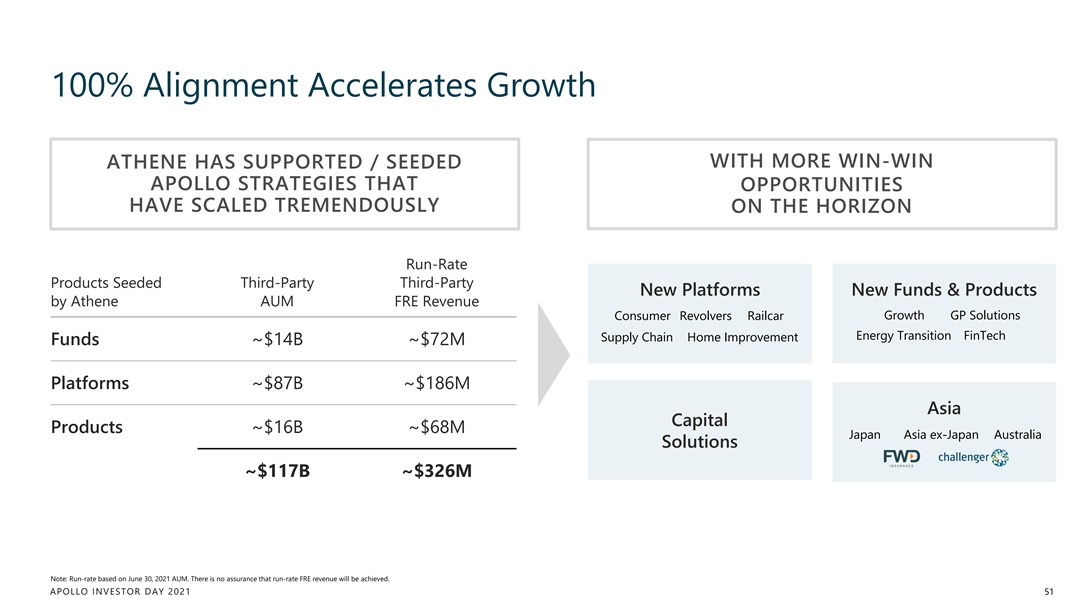
100% Alignment Accelerates Growth WITH MORE WIN-WIN ATHENE HAS SUPPORTED / SEEDED APOLLO STRATEGIES THAT OPPORTUNITIES HAVE SCALED TREMENDOUSLY ON THE HORIZON Run-Rate Products Seeded Third-Party Third-Party New Platforms New Funds & Products by Athene AUM FRE Revenue Consumer Revolvers Railcar Growth GP Solutions Energy Transition FinTech Supply Chain Home Improvement Funds ~$14B ~$72M Platforms ~$87B ~$186M Asia Capital Products ~$16B ~$68M Japan Asia ex-Japan Australia Solutions ~$117B ~$326M Note: Run-rate based on June 30, 2021 AUM. There is no assurance that run-rate FRE revenue will be achieved. APOLLO INVESTOR DAY 2021 51
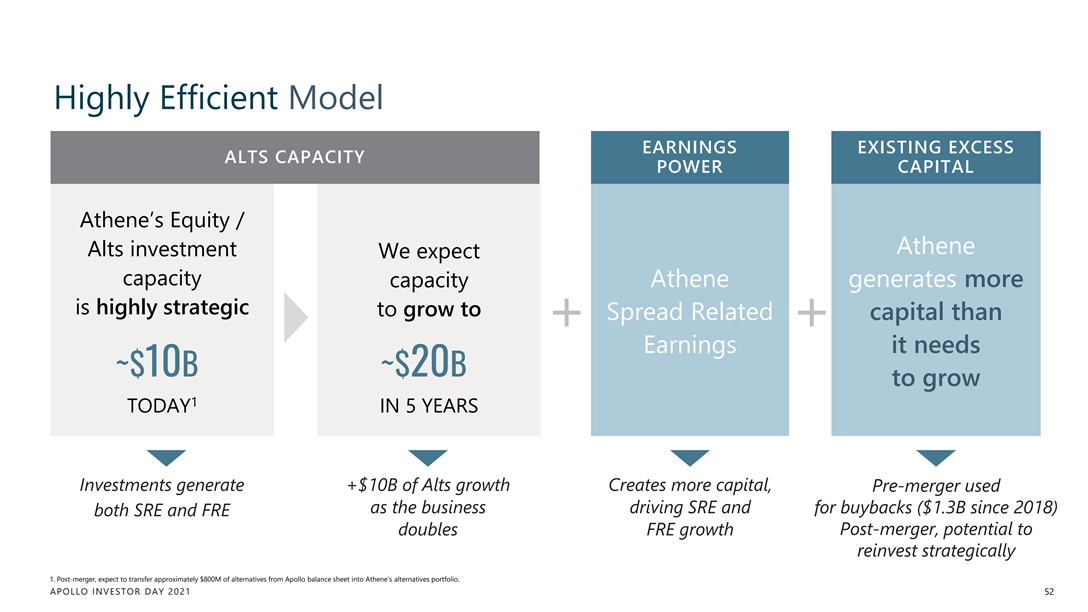
Highly Efficient Model EARNINGS EXISTING EXCESS ALTS CAPACITY POWER CAPITAL Athene’s Equity / Athene Alts investment We expect capacity capacity Athene generates more is highly strategic to grow to Spread Related capital than + + Earnings it needs ~$10B ~$20B to grow 1 TODAY IN 5 YEARS Investments generate +$10B of Alts growth Creates more capital, Pre-merger used as the business driving SRE and for buybacks ($1.3B since 2018) both SRE and FRE Post-merger, potential to doubles FRE growth reinvest strategically 1. Post-merger, expect to transfer approximately $800M of alternatives from Apollo balance sheet into Athene’s alternatives portfolio. APOLLO INVESTOR DAY 2021 52Highly Efficient Model EARNINGS EXISTING EXCESS ALTS CAPACITY POWER CAPITAL Athene’s Equity / Athene Alts investment We expect capacity capacity Athene generates more is highly strategic to grow to Spread Related capital than + + Earnings it needs ~$10B ~$20B to grow 1 TODAY IN 5 YEARS Investments generate +$10B of Alts growth Creates more capital, Pre-merger used as the business driving SRE and for buybacks ($1.3B since 2018) both SRE and FRE Post-merger, potential to doubles FRE growth reinvest strategically 1. Post-merger, expect to transfer approximately $800M of alternatives from Apollo balance sheet into Athene’s alternatives portfolio. APOLLO INVESTOR DAY 2021 52
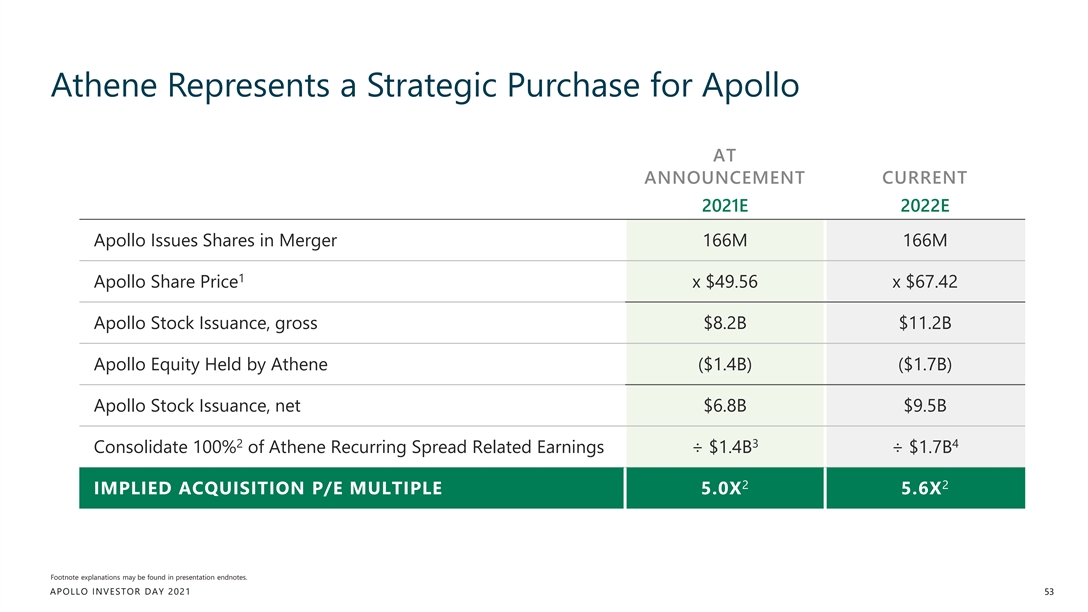
Athene Represents a Strategic Purchase for Apollo AT ANNOUNCEMENT CURRENT 2021E 2022E Apollo Issues Shares in Merger 166M 166M 1 Apollo Share Price x $49.56 x $67.42 Apollo Stock Issuance, gross $8.2B $11.2B Apollo Equity Held by Athene ($1.4B) ($1.7B) Apollo Stock Issuance, net $6.8B $9.5B 2 3 4 Consolidate 100% of Athene Recurring Spread Related Earnings ÷ $1.4B ÷ $1.7B 2 2 IMPLIED ACQUISITION P/E MULTIPLE 5.0X 5.6X Footnote explanations may be found in presentation endnotes. APOLLO INVESTOR DAY 2021 53Athene Represents a Strategic Purchase for Apollo AT ANNOUNCEMENT CURRENT 2021E 2022E Apollo Issues Shares in Merger 166M 166M 1 Apollo Share Price x $49.56 x $67.42 Apollo Stock Issuance, gross $8.2B $11.2B Apollo Equity Held by Athene ($1.4B) ($1.7B) Apollo Stock Issuance, net $6.8B $9.5B 2 3 4 Consolidate 100% of Athene Recurring Spread Related Earnings ÷ $1.4B ÷ $1.7B 2 2 IMPLIED ACQUISITION P/E MULTIPLE 5.0X 5.6X Footnote explanations may be found in presentation endnotes. APOLLO INVESTOR DAY 2021 53
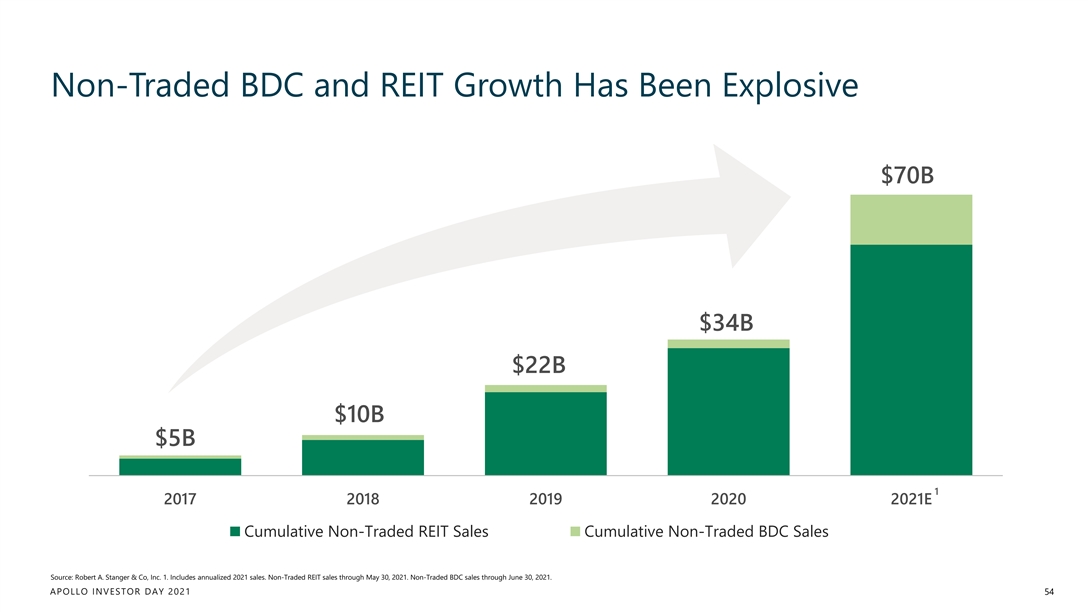
Non-Traded BDC and REIT Growth Has Been Explosive $70B 54 $34B $22B $10B $5B 1 2017 2018 2019 2020 2021E Cumulative Non-Traded REIT Sales Cumulative Non-Traded BDC Sales Source: Robert A. Stanger & Co, Inc. 1. Includes annualized 2021 sales. Non-Traded REIT sales through May 30, 2021. Non-Traded BDC sales through June 30, 2021. APOLLO INVESTOR DAY 2021 54Non-Traded BDC and REIT Growth Has Been Explosive $70B 54 $34B $22B $10B $5B 1 2017 2018 2019 2020 2021E Cumulative Non-Traded REIT Sales Cumulative Non-Traded BDC Sales Source: Robert A. Stanger & Co, Inc. 1. Includes annualized 2021 sales. Non-Traded REIT sales through May 30, 2021. Non-Traded BDC sales through June 30, 2021. APOLLO INVESTOR DAY 2021 54
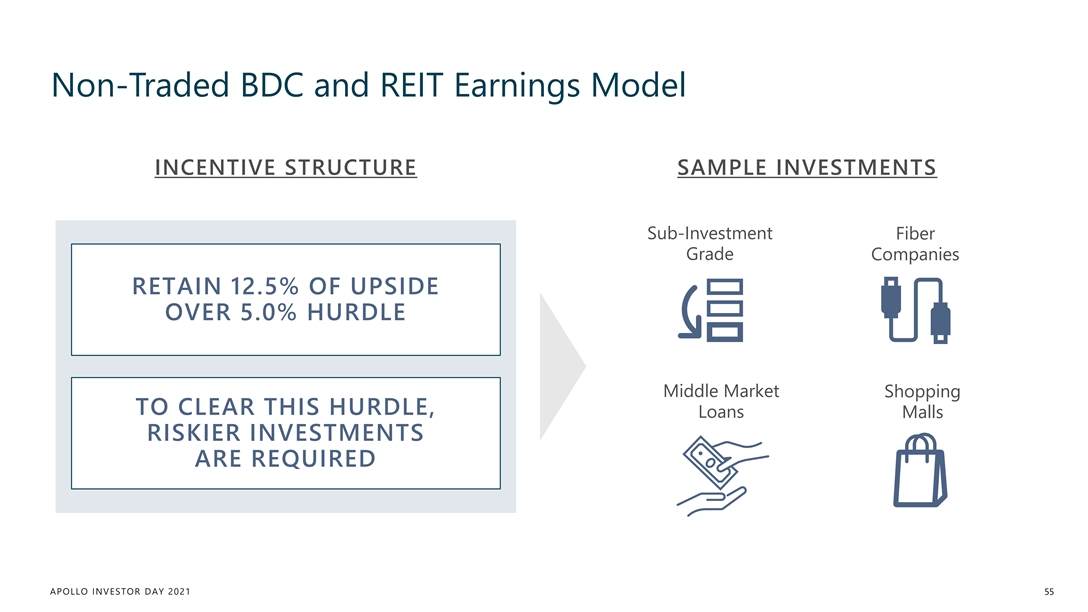
Non-Traded BDC and REIT Earnings Model INCENTIVE STRUCTURE SAMPLE INVESTMENTS Sub-Investment Fiber Grade Companies RETAIN 12.5% OF UPSIDE OVER 5.0% HURDLE Middle Market Shopping TO CLEAR THIS HURDLE, Loans Malls RISKIER INVESTMENTS ARE REQUIRED APOLLO INVESTOR DAY 2021 55Non-Traded BDC and REIT Earnings Model INCENTIVE STRUCTURE SAMPLE INVESTMENTS Sub-Investment Fiber Grade Companies RETAIN 12.5% OF UPSIDE OVER 5.0% HURDLE Middle Market Shopping TO CLEAR THIS HURDLE, Loans Malls RISKIER INVESTMENTS ARE REQUIRED APOLLO INVESTOR DAY 2021 55
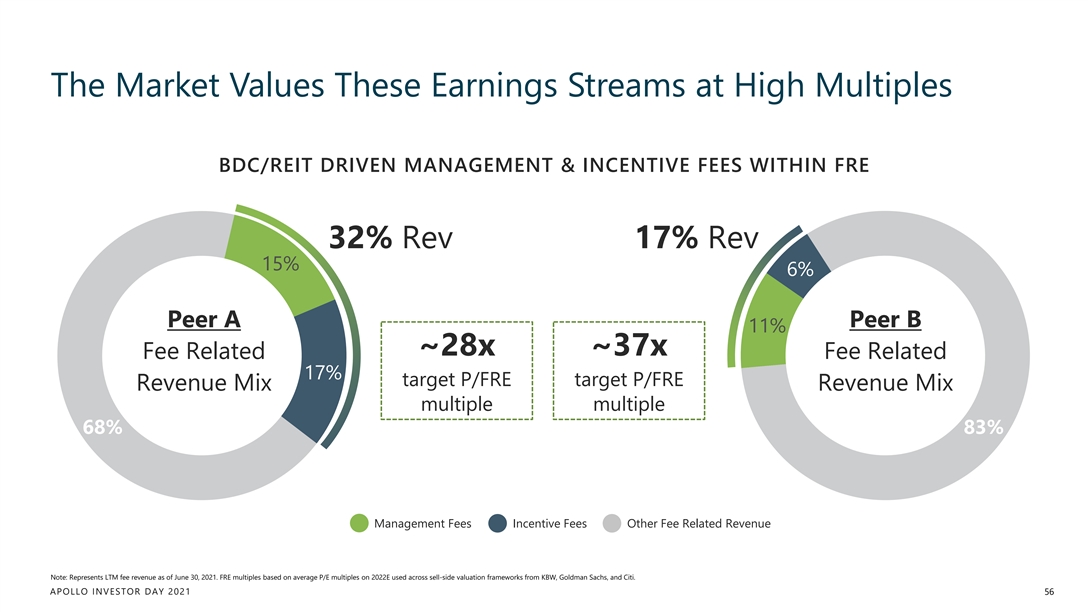
The Market Values These Earnings Streams at High Multiples BDC/REIT DRIVEN MANAGEMENT & INCENTIVE FEES WITHIN FRE 32% Rev 17% Rev 15% 6% Peer A Peer B 11% ~28x ~37x Fee Related Fee Related 17% target P/FRE target P/FRE Revenue Mix Revenue Mix multiple multiple 68% 83% Management Fees Incentive Fees Other Fee Related Revenue Note: Represents LTM fee revenue as of June 30, 2021. FRE multiples based on average P/E multiples on 2022E used across sell-side valuation frameworks from KBW, Goldman Sachs, and Citi. APOLLO INVESTOR DAY 2021 56
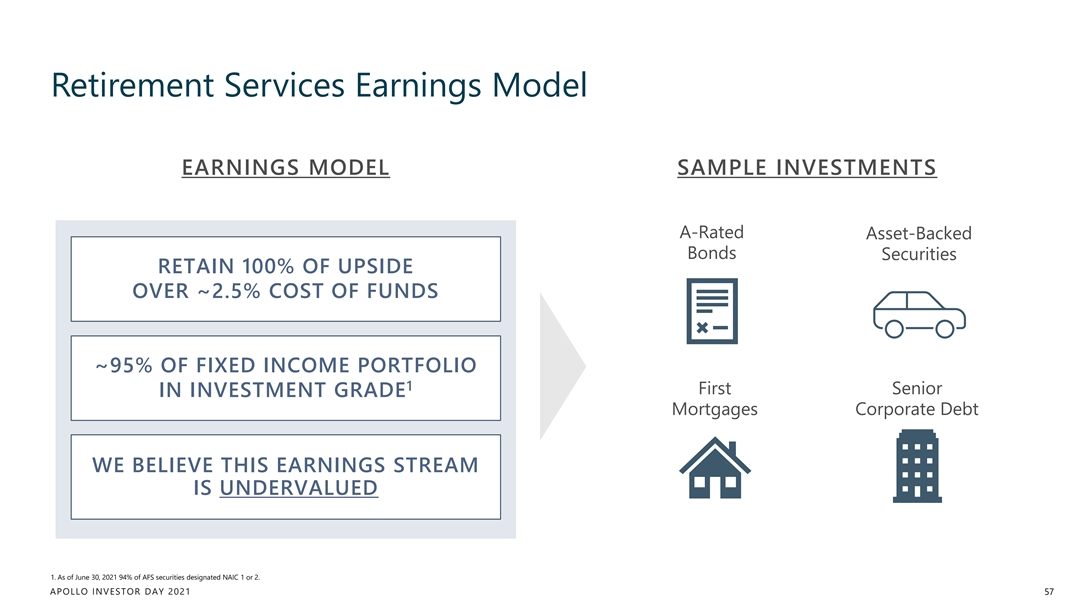
Retirement Services Earnings Model EARNINGS MODEL SAMPLE INVESTMENTS A-Rated Asset-Backed Bonds Securities RETAIN 100% OF UPSIDE OVER ~2.5% COST OF FUNDS ~95% OF FIXED INCOME PORTFOLIO 1 First Senior IN INVESTMENT GRADE Mortgages Corporate Debt WE BELIEVE THIS EARNINGS STREAM IS UNDERVALUED 1. As of June 30, 2021 94% of AFS securities designated NAIC 1 or 2. APOLLO INVESTOR DAY 2021 57Retirement Services Earnings Model EARNINGS MODEL SAMPLE INVESTMENTS A-Rated Asset-Backed Bonds Securities RETAIN 100% OF UPSIDE OVER ~2.5% COST OF FUNDS ~95% OF FIXED INCOME PORTFOLIO 1 First Senior IN INVESTMENT GRADE Mortgages Corporate Debt WE BELIEVE THIS EARNINGS STREAM IS UNDERVALUED 1. As of June 30, 2021 94% of AFS securities designated NAIC 1 or 2. APOLLO INVESTOR DAY 2021 57
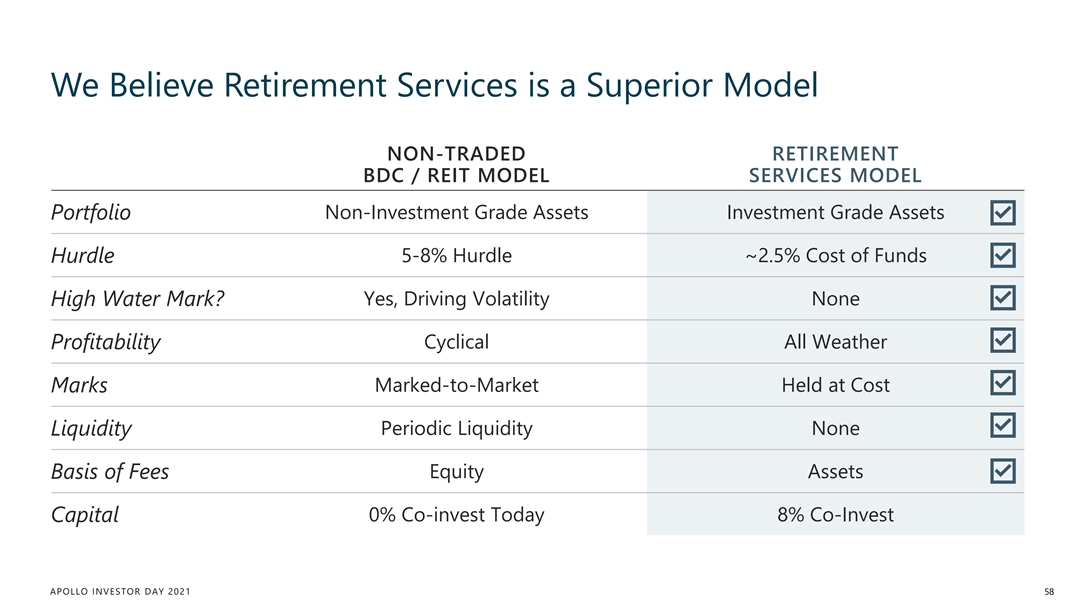
We Believe Retirement Services is a Superior Model NON-TRADED RETIREMENT BDC / REIT MODEL SERVICES MODEL Non-Investment Grade Assets Investment Grade Assets Portfolio 5-8% Hurdle ~2.5% Cost of Funds Hurdle Yes, Driving Volatility None High Water Mark? Profitability Cyclical All Weather Marked-to-Market Held at Cost Marks Periodic Liquidity None Liquidity Equity Assets Basis of Fees 0% Co-invest Today 8% Co-Invest Capital APOLLO INVESTOR DAY 2021 58We Believe Retirement Services is a Superior Model NON-TRADED RETIREMENT BDC / REIT MODEL SERVICES MODEL Non-Investment Grade Assets Investment Grade Assets Portfolio 5-8% Hurdle ~2.5% Cost of Funds Hurdle Yes, Driving Volatility None High Water Mark? Profitability Cyclical All Weather Marked-to-Market Held at Cost Marks Periodic Liquidity None Liquidity Equity Assets Basis of Fees 0% Co-invest Today 8% Co-Invest Capital APOLLO INVESTOR DAY 2021 58
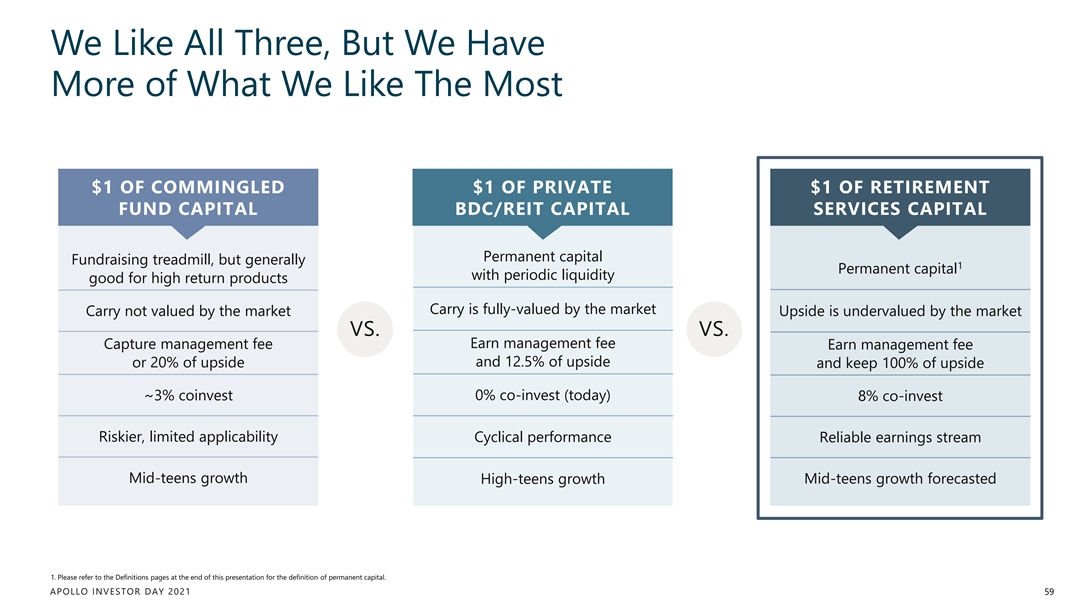
We Like All Three, But We Have More of What We Like The Most $1 OF COMMINGLED $1 OF PRIVATE $1 OF RETIREMENT FUND CAPITAL BDC/REIT CAPITAL SERVICES CAPITAL Permanent capital Fundraising treadmill, but generally 1 Permanent capital with periodic liquidity good for high return products Carry is fully-valued by the market Carry not valued by the market Upside is undervalued by the market VS. VS. Earn management fee Capture management fee Earn management fee or 20% of upside and 12.5% of upside and keep 100% of upside ~3% coinvest 0% co-invest (today) 8% co-invest Riskier, limited applicability Cyclical performance Reliable earnings stream Mid-teens growth High-teens growth Mid-teens growth forecasted 1. Please refer to the Definitions pages at the end of this presentation for the definition of permanent capital. APOLLO INVESTOR DAY 2021 59We Like All Three, But We Have More of What We Like The Most $1 OF COMMINGLED $1 OF PRIVATE $1 OF RETIREMENT FUND CAPITAL BDC/REIT CAPITAL SERVICES CAPITAL Permanent capital Fundraising treadmill, but generally 1 Permanent capital with periodic liquidity good for high return products Carry is fully-valued by the market Carry not valued by the market Upside is undervalued by the market VS. VS. Earn management fee Capture management fee Earn management fee or 20% of upside and 12.5% of upside and keep 100% of upside ~3% coinvest 0% co-invest (today) 8% co-invest Riskier, limited applicability Cyclical performance Reliable earnings stream Mid-teens growth High-teens growth Mid-teens growth forecasted 1. Please refer to the Definitions pages at the end of this presentation for the definition of permanent capital. APOLLO INVESTOR DAY 2021 59
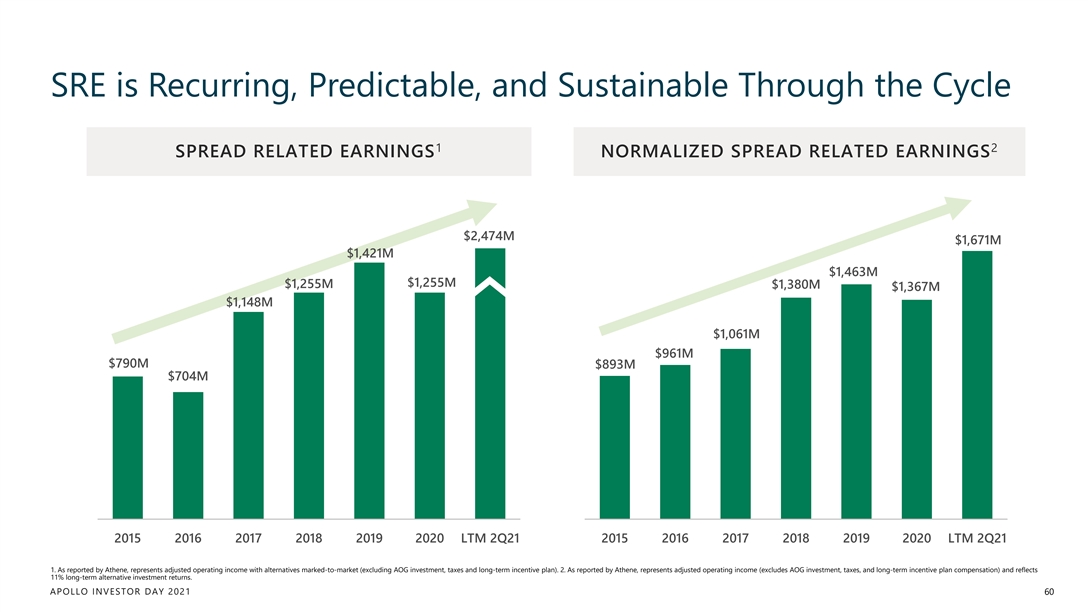
SRE is Recurring, Predictable, and Sustainable Through the Cycle 1 2 SPREAD RELATED EARNINGS NORMALIZED SPREAD RELATED EARNINGS $2,474M $1,671M $1,421M $1,463M $1,255M $1,255M $1,380M $1,367M $1,148M $1,061M $961M $790M $893M $704M 2015 2016 2017 2018 2019 2020 LTM 2Q21 2015 2016 2017 2018 2019 2020 LTM 2Q21 1. As reported by Athene, represents adjusted operating income with alternatives marked-to-market (excluding AOG investment, taxes and long-term incentive plan). 2. As reported by Athene, represents adjusted operating income (excludes AOG investment, taxes, and long-term incentive plan compensation) and reflects 11% long-term alternative investment returns. APOLLO INVESTOR DAY 2021 60SRE is Recurring, Predictable, and Sustainable Through the Cycle 1 2 SPREAD RELATED EARNINGS NORMALIZED SPREAD RELATED EARNINGS $2,474M $1,671M $1,421M $1,463M $1,255M $1,255M $1,380M $1,367M $1,148M $1,061M $961M $790M $893M $704M 2015 2016 2017 2018 2019 2020 LTM 2Q21 2015 2016 2017 2018 2019 2020 LTM 2Q21 1. As reported by Athene, represents adjusted operating income with alternatives marked-to-market (excluding AOG investment, taxes and long-term incentive plan). 2. As reported by Athene, represents adjusted operating income (excludes AOG investment, taxes, and long-term incentive plan compensation) and reflects 11% long-term alternative investment returns. APOLLO INVESTOR DAY 2021 60
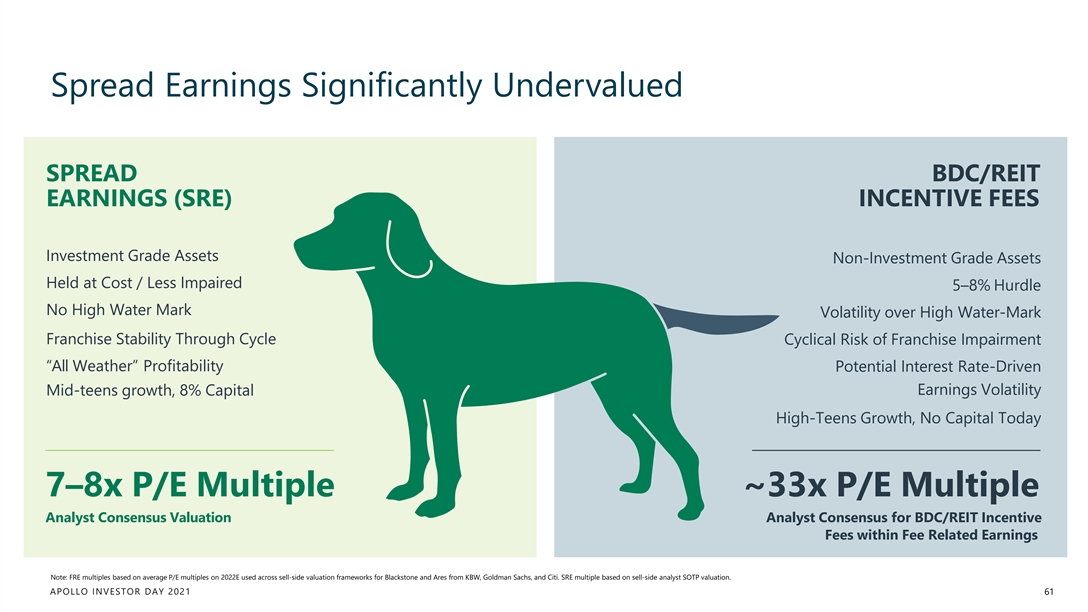
Spread Earnings Significantly Undervalued SPREAD BDC/REIT EARNINGS (SRE) INCENTIVE FEES Investment Grade Assets Non-Investment Grade Assets Held at Cost / Less Impaired 5–8% Hurdle No High Water Mark Volatility over High Water-Mark Franchise Stability Through Cycle Cyclical Risk of Franchise Impairment “All Weather” Profitability Potential Interest Rate-Driven Earnings Volatility Mid-teens growth, 8% Capital High-Teens Growth, No Capital Today 7–8x P/E Multiple ~33x P/E Multiple Analyst Consensus Valuation Analyst Consensus for BDC/REIT Incentive Fees within Fee Related Earnings Note: FRE multiples based on average P/E multiples on 2022E used across sell-side valuation frameworks for Blackstone and Ares from KBW, Goldman Sachs, and Citi. SRE multiple based on sell-side analyst SOTP valuation. APOLLO INVESTOR DAY 2021 61Spread Earnings Significantly Undervalued SPREAD BDC/REIT EARNINGS (SRE) INCENTIVE FEES Investment Grade Assets Non-Investment Grade Assets Held at Cost / Less Impaired 5–8% Hurdle No High Water Mark Volatility over High Water-Mark Franchise Stability Through Cycle Cyclical Risk of Franchise Impairment “All Weather” Profitability Potential Interest Rate-Driven Earnings Volatility Mid-teens growth, 8% Capital High-Teens Growth, No Capital Today 7–8x P/E Multiple ~33x P/E Multiple Analyst Consensus Valuation Analyst Consensus for BDC/REIT Incentive Fees within Fee Related Earnings Note: FRE multiples based on average P/E multiples on 2022E used across sell-side valuation frameworks for Blackstone and Ares from KBW, Goldman Sachs, and Citi. SRE multiple based on sell-side analyst SOTP valuation. APOLLO INVESTOR DAY 2021 61
4 Our Model Is Highly Capital Efficient APOLLO INVESTOR DAY 2021 624 Our Model Is Highly Capital Efficient APOLLO INVESTOR DAY 2021 62
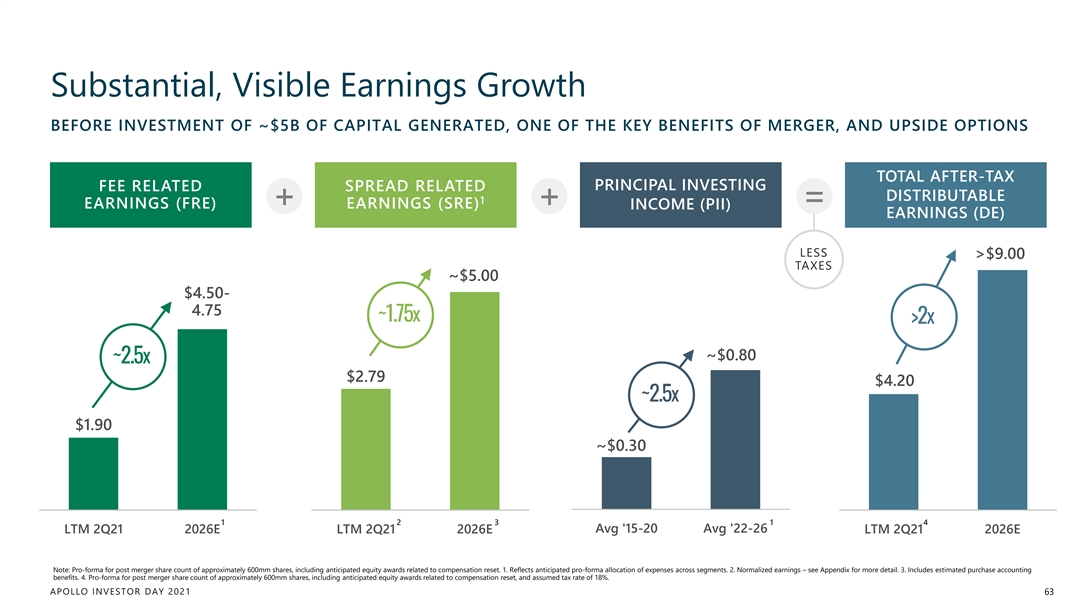
Substantial, Visible Earnings Growth BEFORE INVESTMENT OF ~$5B OF CAPITAL GENERATED, ONE OF THE KEY BENEFITS OF MERGER, AND UPSIDE OPTIONS TOTAL AFTER-TAX PRINCIPAL INVESTING FEE RELATED SPREAD RELATED DISTRIBUTABLE 1 + + = EARNINGS (FRE) EARNINGS (SRE) INCOME (PII) EARNINGS (DE) LESS >$9.00 TAXES ~$5.00 $4.50- 4.75 ~1.75x >2x ~$0.80 ~2.5x $2.79 $4.20 ~2.5x $1.90 ~$0.30 1 2 3 1 4 LTM 2Q21 2026E Avg '15-20 Avg '22-26 LTM 2Q21 2026E LTM 2Q21 2026E Note: Pro-forma for post merger share count of approximately 600mm shares, including anticipated equity awards related to compensation reset. 1. Reflects anticipated pro-forma allocation of expenses across segments. 2. Normalized earnings – see Appendix for more detail. 3. Includes estimated purchase accounting benefits. 4. Pro-forma for post merger share count of approximately 600mm shares, including anticipated equity awards related to compensation reset, and assumed tax rate of 18%. APOLLO INVESTOR DAY 2021 63Substantial, Visible Earnings Growth BEFORE INVESTMENT OF ~$5B OF CAPITAL GENERATED, ONE OF THE KEY BENEFITS OF MERGER, AND UPSIDE OPTIONS TOTAL AFTER-TAX PRINCIPAL INVESTING FEE RELATED SPREAD RELATED DISTRIBUTABLE 1 + + = EARNINGS (FRE) EARNINGS (SRE) INCOME (PII) EARNINGS (DE) LESS >$9.00 TAXES ~$5.00 $4.50- 4.75 ~1.75x >2x ~$0.80 ~2.5x $2.79 $4.20 ~2.5x $1.90 ~$0.30 1 2 3 1 4 LTM 2Q21 2026E Avg '15-20 Avg '22-26 LTM 2Q21 2026E LTM 2Q21 2026E Note: Pro-forma for post merger share count of approximately 600mm shares, including anticipated equity awards related to compensation reset. 1. Reflects anticipated pro-forma allocation of expenses across segments. 2. Normalized earnings – see Appendix for more detail. 3. Includes estimated purchase accounting benefits. 4. Pro-forma for post merger share count of approximately 600mm shares, including anticipated equity awards related to compensation reset, and assumed tax rate of 18%. APOLLO INVESTOR DAY 2021 63
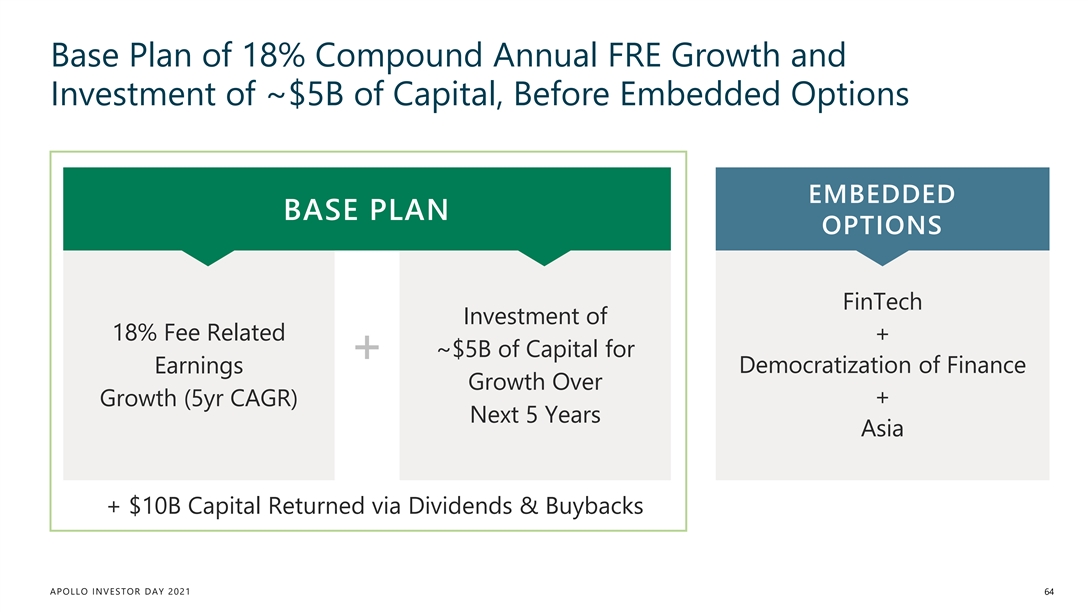
Base Plan of 18% Compound Annual FRE Growth and Investment of ~$5B of Capital, Before Embedded Options EMBEDDED BASE PLAN OPTIONS FinTech Investment of 18% Fee Related + ~$5B of Capital for + Democratization of Finance Earnings Growth Over + Growth (5yr CAGR) Next 5 Years Asia + $10B Capital Returned via Dividends & Buybacks APOLLO INVESTOR DAY 2021 64
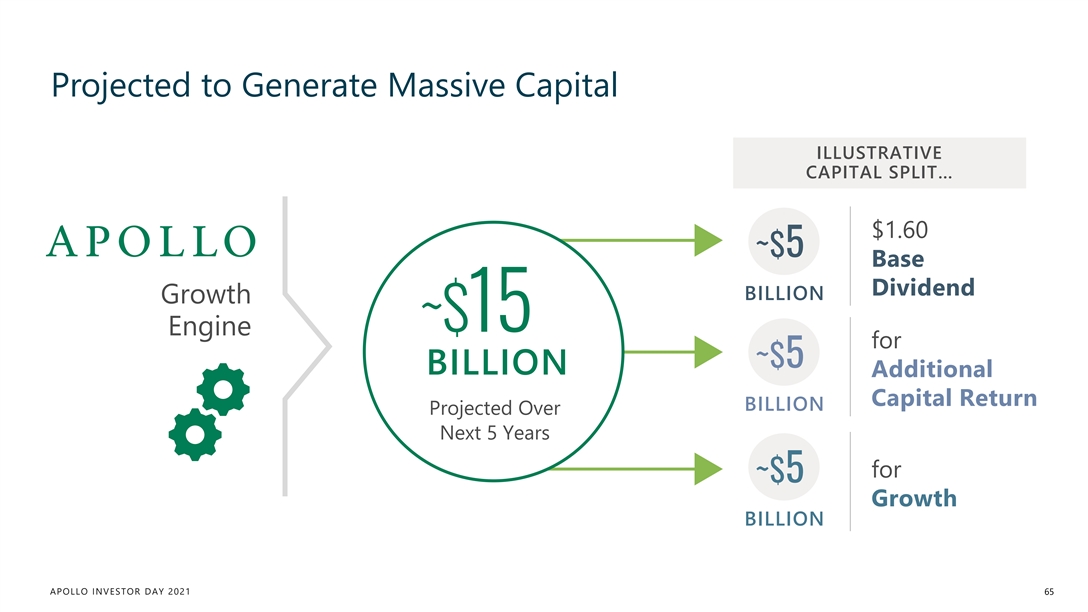
Projected to Generate Massive Capital ILLUSTRATIVE CAPITAL SPLIT… $1.60 ~$5 Base Dividend BILLION Growth ~$15 Engine for ~$5 BILLION Additional Capital Return BILLION Projected Over Next 5 Years for ~$5 Growth BILLION APOLLO INVESTOR DAY 2021 65Projected to Generate Massive Capital ILLUSTRATIVE CAPITAL SPLIT… $1.60 ~$5 Base Dividend BILLION Growth ~$15 Engine for ~$5 BILLION Additional Capital Return BILLION Projected Over Next 5 Years for ~$5 Growth BILLION APOLLO INVESTOR DAY 2021 65
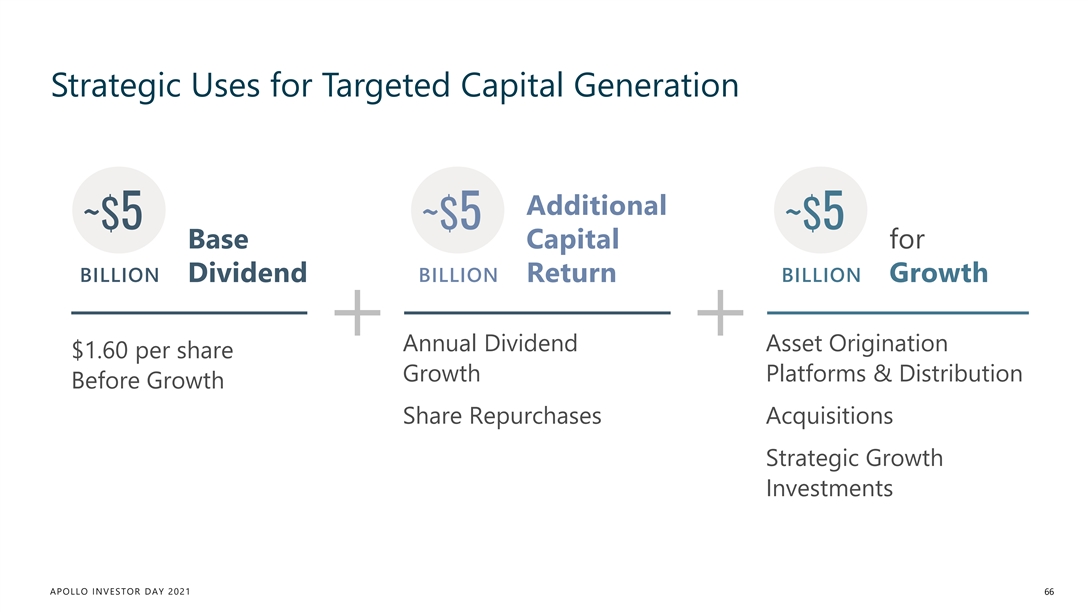
Strategic Uses for Targeted Capital Generation Additional ~$5 ~$5 ~$5 Base Capital for BILLION Dividend BILLION Return BILLION Growth Annual Dividend Asset Origination $1.60 per share Growth Platforms & Distribution Before Growth Share Repurchases Acquisitions Strategic Growth Investments APOLLO INVESTOR DAY 2021 66
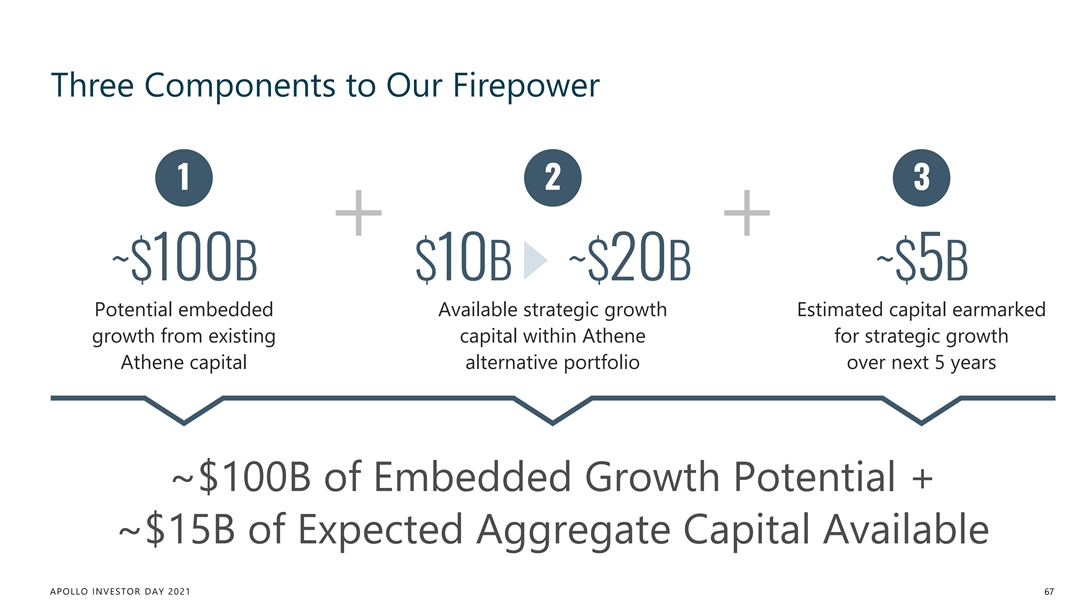
Three Components to Our Firepower 1 2 3 ~$100B $10B ~$20B ~$5B Potential embedded Available strategic growth Estimated capital earmarked growth from existing capital within Athene for strategic growth Athene capital alternative portfolio over next 5 years ~$100B of Embedded Growth Potential + ~$15B of Expected Aggregate Capital Available APOLLO INVESTOR DAY 2021 67Three Components to Our Firepower 1 2 3 ~$100B $10B ~$20B ~$5B Potential embedded Available strategic growth Estimated capital earmarked growth from existing capital within Athene for strategic growth Athene capital alternative portfolio over next 5 years ~$100B of Embedded Growth Potential + ~$15B of Expected Aggregate Capital Available APOLLO INVESTOR DAY 2021 67

5 Strong Momentum Behind Aligned Team APOLLO INVESTOR DAY 2021 685 Strong Momentum Behind Aligned Team APOLLO INVESTOR DAY 2021 68
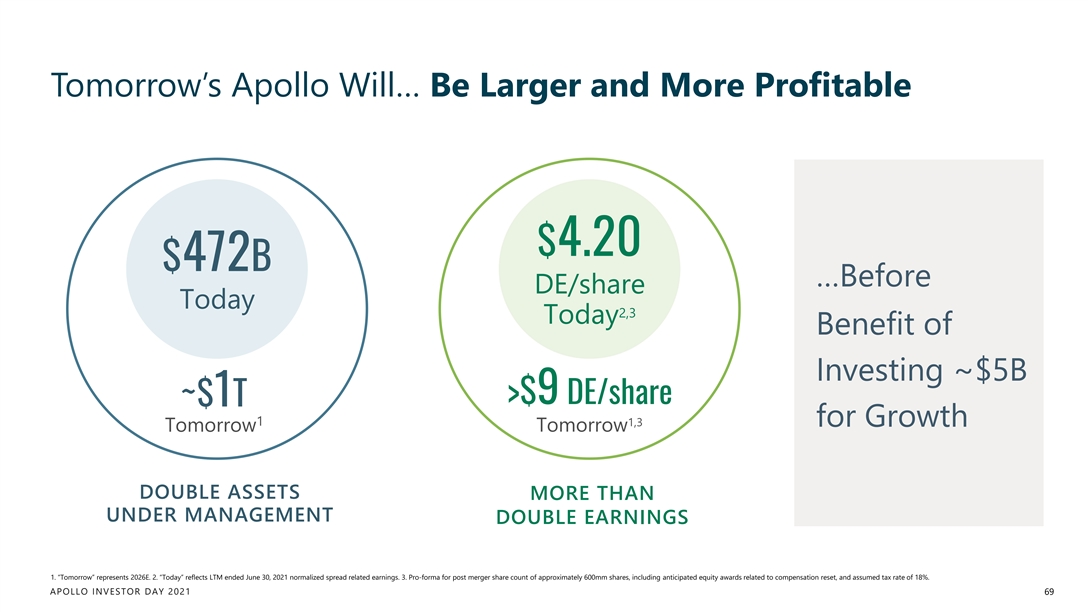
Tomorrow’s Apollo Will… Be Larger and More Profitable $4.20 $472B …Before DE/share Today 2,3 Today Benefit of Investing ~$5B >$9 DE/share ~$1T 1 1,3 for Growth Tomorrow Tomorrow DOUBLE ASSETS MORE THAN UNDER MANAGEMENT DOUBLE EARNINGS 1. “Tomorrow” represents 2026E. 2. “Today” reflects LTM ended June 30, 2021 normalized spread related earnings. 3. Pro-forma for post merger share count of approximately 600mm shares, including anticipated equity awards related to compensation reset, and assumed tax rate of 18%. APOLLO INVESTOR DAY 2021 69Tomorrow’s Apollo Will… Be Larger and More Profitable $4.20 $472B …Before DE/share Today 2,3 Today Benefit of Investing ~$5B >$9 DE/share ~$1T 1 1,3 for Growth Tomorrow Tomorrow DOUBLE ASSETS MORE THAN UNDER MANAGEMENT DOUBLE EARNINGS 1. “Tomorrow” represents 2026E. 2. “Today” reflects LTM ended June 30, 2021 normalized spread related earnings. 3. Pro-forma for post merger share count of approximately 600mm shares, including anticipated equity awards related to compensation reset, and assumed tax rate of 18%. APOLLO INVESTOR DAY 2021 69
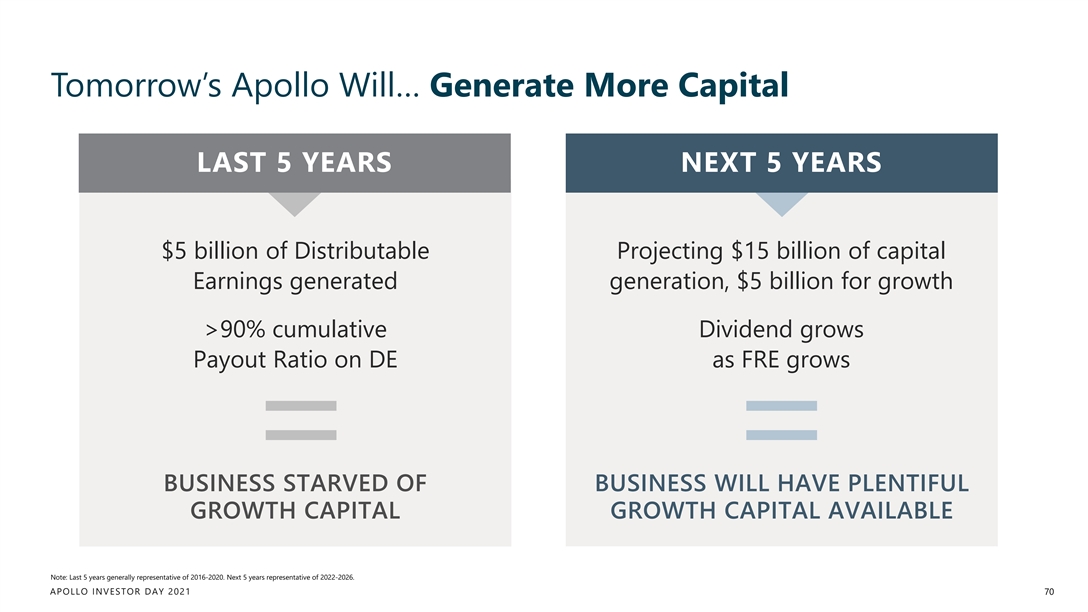
Tomorrow’s Apollo Will… Generate More Capital LAST 5 YEARS NEXT 5 YEARS $5 billion of Distributable Projecting $15 billion of capital Earnings generated generation, $5 billion for growth >90% cumulative Dividend grows Payout Ratio on DE as FRE grows BUSINESS STARVED OF BUSINESS WILL HAVE PLENTIFUL GROWTH CAPITAL GROWTH CAPITAL AVAILABLE Note: Last 5 years generally representative of 2016-2020. Next 5 years representative of 2022-2026. APOLLO INVESTOR DAY 2021 70Tomorrow’s Apollo Will… Generate More Capital LAST 5 YEARS NEXT 5 YEARS $5 billion of Distributable Projecting $15 billion of capital Earnings generated generation, $5 billion for growth >90% cumulative Dividend grows Payout Ratio on DE as FRE grows BUSINESS STARVED OF BUSINESS WILL HAVE PLENTIFUL GROWTH CAPITAL GROWTH CAPITAL AVAILABLE Note: Last 5 years generally representative of 2016-2020. Next 5 years representative of 2022-2026. APOLLO INVESTOR DAY 2021 70
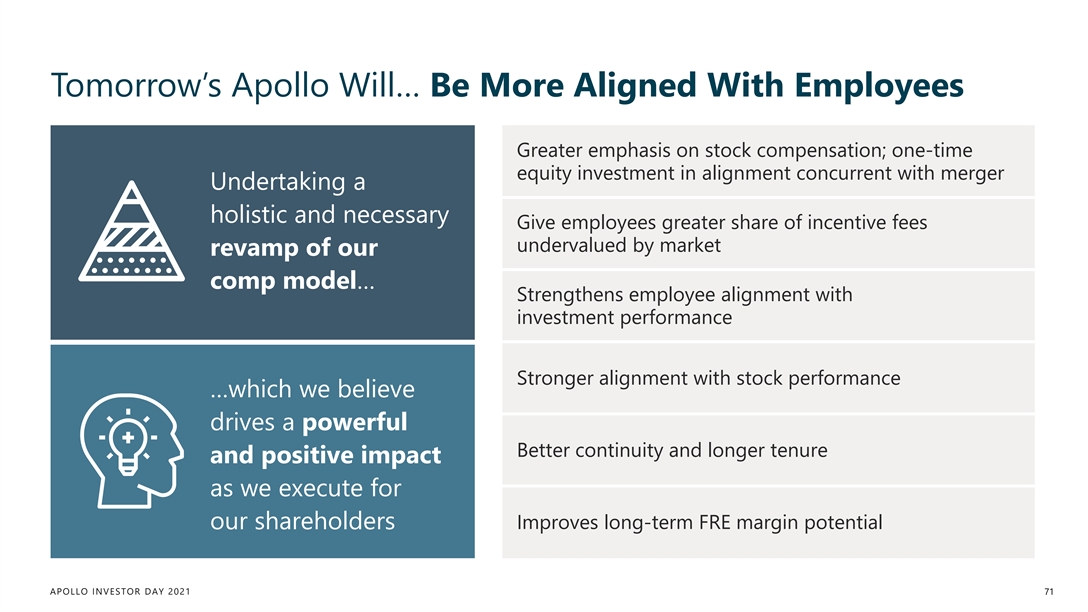
Tomorrow’s Apollo Will… Be More Aligned With Employees Greater emphasis on stock compensation; one-time equity investment in alignment concurrent with merger Undertaking a holistic and necessary Give employees greater share of incentive fees undervalued by market revamp of our comp model… Strengthens employee alignment with investment performance Stronger alignment with stock performance …which we believe drives a powerful Better continuity and longer tenure and positive impact as we execute for our shareholders Improves long-term FRE margin potential APOLLO INVESTOR DAY 2021 71Tomorrow’s Apollo Will… Be More Aligned With Employees Greater emphasis on stock compensation; one-time equity investment in alignment concurrent with merger Undertaking a holistic and necessary Give employees greater share of incentive fees undervalued by market revamp of our comp model… Strengthens employee alignment with investment performance Stronger alignment with stock performance …which we believe drives a powerful Better continuity and longer tenure and positive impact as we execute for our shareholders Improves long-term FRE margin potential APOLLO INVESTOR DAY 2021 71
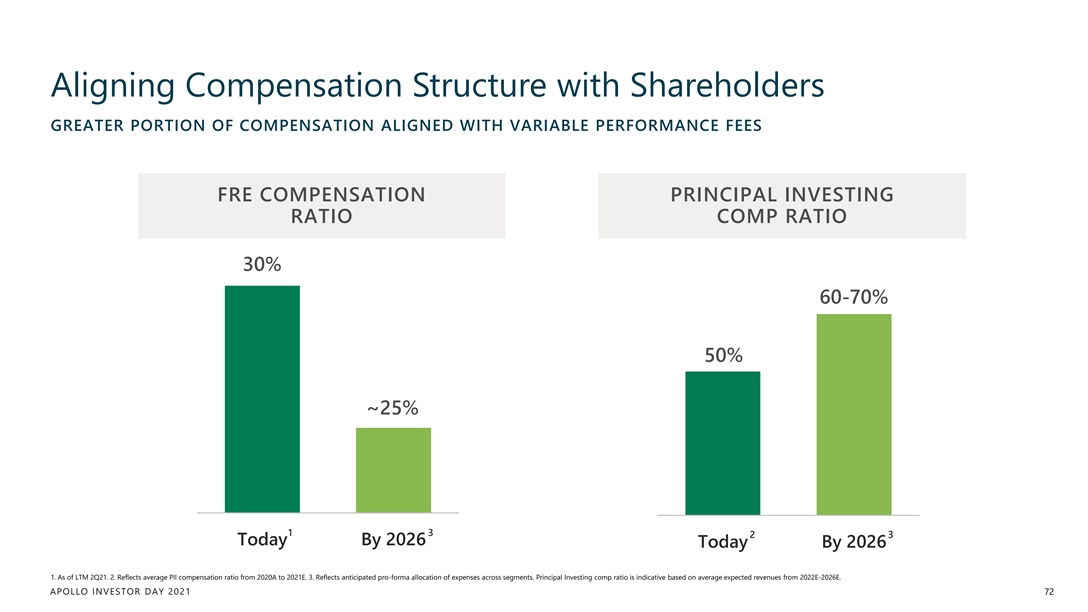
Aligning Compensation Structure with Shareholders GREATER PORTION OF COMPENSATION ALIGNED WITH VARIABLE PERFORMANCE FEES FRE COMPENSATION PRINCIPAL INVESTING RATIO COMP RATIO 30% 60-70% 50% ~25% 1 3 2 3 Today By 2026 Today By 2026 1. As of LTM 2Q21. 2. Reflects average PII compensation ratio from 2020A to 2021E. 3. Reflects anticipated pro-forma allocation of expenses across segments. Principal Investing comp ratio is indicative based on average expected revenues from 2022E-2026E. APOLLO INVESTOR DAY 2021 72Aligning Compensation Structure with Shareholders GREATER PORTION OF COMPENSATION ALIGNED WITH VARIABLE PERFORMANCE FEES FRE COMPENSATION PRINCIPAL INVESTING RATIO COMP RATIO 30% 60-70% 50% ~25% 1 3 2 3 Today By 2026 Today By 2026 1. As of LTM 2Q21. 2. Reflects average PII compensation ratio from 2020A to 2021E. 3. Reflects anticipated pro-forma allocation of expenses across segments. Principal Investing comp ratio is indicative based on average expected revenues from 2022E-2026E. APOLLO INVESTOR DAY 2021 72

It’s All About Talent BRINGING WORLD CLASS SENIOR TALENT TO APOLLO Renee Anderson Ian Bell Jason D’Silva Craig Farr Roger W. Ferguson Jr. Courtney Garcia Gemma Gucci MD, Chief Operating Partner, Head of Asia Sales MD, Investment Technology Senior Partner, Capital Vice Chairman MD, Head of Market Risk MD, Global Head of Officer, Technology and Innovation Solutions Talent Acquisition Noah Gunn Earl Hunt Susan Kendall Olga Kosters David Krone David Lang Yael Levy MD, Global Head of Partner, CEO of Apollo MD, Global Head of MD, Credit Secondaries Senior Partner, Global MD, Chief Operating Officer, Chief Compliance Officer Investor Relations Enterprise Solutions Debt Solutions & Co-Head Strategic Finance Head of Public Policy of Credit LP Secondaries Bill Lewis Vikram Mahidhar Howard Nifoussi Ria Nova Jason Ourman Jeff Sayers David Stangis Senior Partner, Private Equity Operating Partner, Data, Advanced MD, Head of U.S. Wealth Partner, Client & Partner Partner, Apollo Global Real Senior Partner, Senior Partner, Chief Analytics & Digital Transformation Management Solutions Estate Head of Insurance Solutions Sustainability Officer APOLLO INVESTOR DAY 2021 73 Group InternationalIt’s All About Talent BRINGING WORLD CLASS SENIOR TALENT TO APOLLO Renee Anderson Ian Bell Jason D’Silva Craig Farr Roger W. Ferguson Jr. Courtney Garcia Gemma Gucci MD, Chief Operating Partner, Head of Asia Sales MD, Investment Technology Senior Partner, Capital Vice Chairman MD, Head of Market Risk MD, Global Head of Officer, Technology and Innovation Solutions Talent Acquisition Noah Gunn Earl Hunt Susan Kendall Olga Kosters David Krone David Lang Yael Levy MD, Global Head of Partner, CEO of Apollo MD, Global Head of MD, Credit Secondaries Senior Partner, Global MD, Chief Operating Officer, Chief Compliance Officer Investor Relations Enterprise Solutions Debt Solutions & Co-Head Strategic Finance Head of Public Policy of Credit LP Secondaries Bill Lewis Vikram Mahidhar Howard Nifoussi Ria Nova Jason Ourman Jeff Sayers David Stangis Senior Partner, Private Equity Operating Partner, Data, Advanced MD, Head of U.S. Wealth Partner, Client & Partner Partner, Apollo Global Real Senior Partner, Senior Partner, Chief Analytics & Digital Transformation Management Solutions Estate Head of Insurance Solutions Sustainability Officer APOLLO INVESTOR DAY 2021 73 Group International
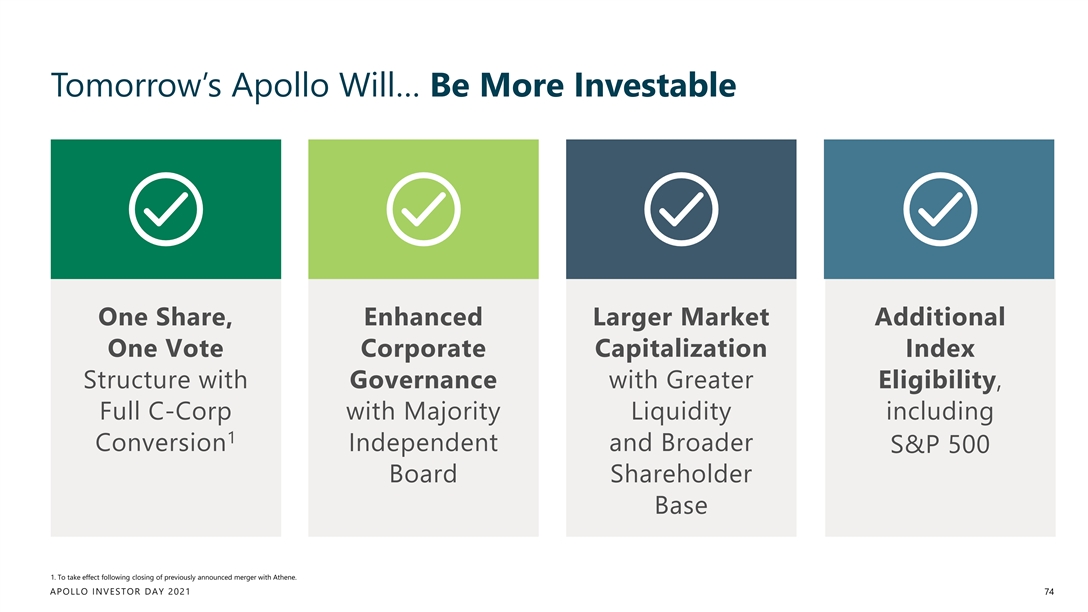
Tomorrow’s Apollo Will… Be More Investable One Share, Enhanced Larger Market Additional One Vote Corporate Capitalization Index Structure with Governance with Greater Eligibility, Full C-Corp with Majority Liquidity including 1 Conversion Independent and Broader S&P 500 Board Shareholder Base 1. To take effect following closing of previously announced merger with Athene. APOLLO INVESTOR DAY 2021 74Tomorrow’s Apollo Will… Be More Investable One Share, Enhanced Larger Market Additional One Vote Corporate Capitalization Index Structure with Governance with Greater Eligibility, Full C-Corp with Majority Liquidity including 1 Conversion Independent and Broader S&P 500 Board Shareholder Base 1. To take effect following closing of previously announced merger with Athene. APOLLO INVESTOR DAY 2021 74
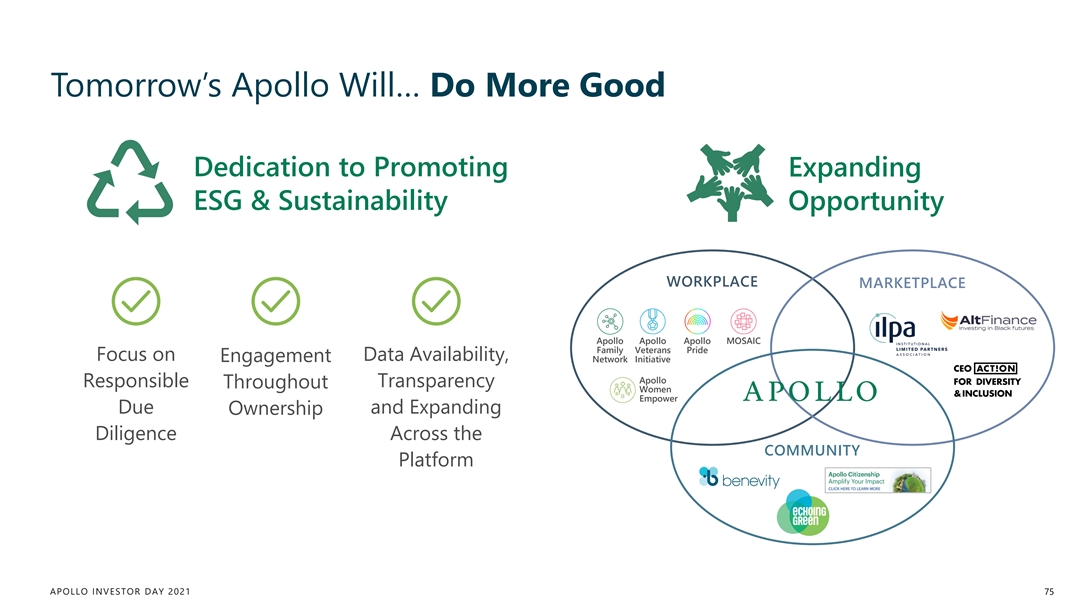
Tomorrow’s Apollo Will… Do More Good Dedication to Promoting Expanding ESG & Sustainability Opportunity WORKPLACE MARKETPLACE Apollo Apollo Apollo MOSAIC Family Veterans Pride Focus on Data Availability, Engagement Network Initiative Apollo Responsible Transparency Throughout Women Empower Due and Expanding Ownership Diligence Across the COMMUNITY Platform APOLLO INVESTOR DAY 2021 75Tomorrow’s Apollo Will… Do More Good Dedication to Promoting Expanding ESG & Sustainability Opportunity WORKPLACE MARKETPLACE Apollo Apollo Apollo MOSAIC Family Veterans Pride Focus on Data Availability, Engagement Network Initiative Apollo Responsible Transparency Throughout Women Empower Due and Expanding Ownership Diligence Across the COMMUNITY Platform APOLLO INVESTOR DAY 2021 75

Culture at Apollo VIDEO MODULE APOLLO INVESTOR DAY 2021

Yield Overview JIM ZELTER Co-President APOLLO INVESTOR DAY 2021Yield Overview JIM ZELTER Co-President APOLLO INVESTOR DAY 2021
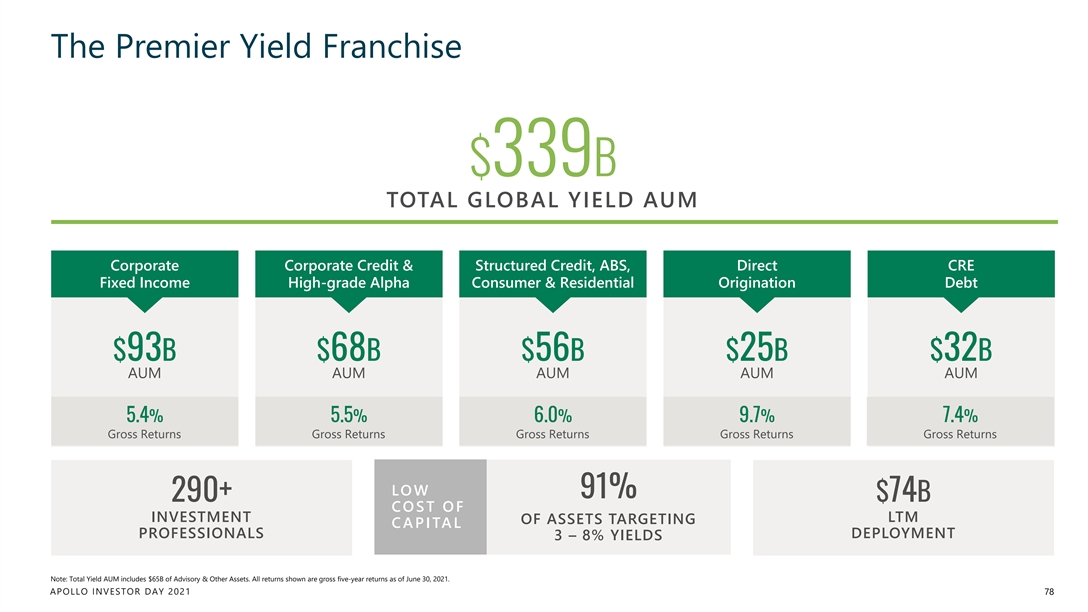
The Premier Yield Franchise $339B TOTAL GLOBAL YIELD AUM Corporate Corporate Credit & Structured Credit, ABS, Direct CRE Fixed Income High-grade Alpha Consumer & Residential Origination Debt $93B $68B $56B $25B $32B AUM AUM AUM AUM AUM 5.4% 5.5% 6.0% 9.7% 7.4% Gross Returns Gross Returns Gross Returns Gross Returns Gross Returns LOW 91% 290+ $74B COST OF INVESTMENT LTM OF ASSETS TARGETING C APITAL PROFESSIONALS DEPLOYMENT 3 – 8% YIELDS Note: Total Yield AUM includes $65B of Advisory & Other Assets. All returns shown are gross five-year returns as of June 30, 2021. APOLLO INVESTOR DAY 2021 78The Premier Yield Franchise $339B TOTAL GLOBAL YIELD AUM Corporate Corporate Credit & Structured Credit, ABS, Direct CRE Fixed Income High-grade Alpha Consumer & Residential Origination Debt $93B $68B $56B $25B $32B AUM AUM AUM AUM AUM 5.4% 5.5% 6.0% 9.7% 7.4% Gross Returns Gross Returns Gross Returns Gross Returns Gross Returns LOW 91% 290+ $74B COST OF INVESTMENT LTM OF ASSETS TARGETING C APITAL PROFESSIONALS DEPLOYMENT 3 – 8% YIELDS Note: Total Yield AUM includes $65B of Advisory & Other Assets. All returns shown are gross five-year returns as of June 30, 2021. APOLLO INVESTOR DAY 2021 78
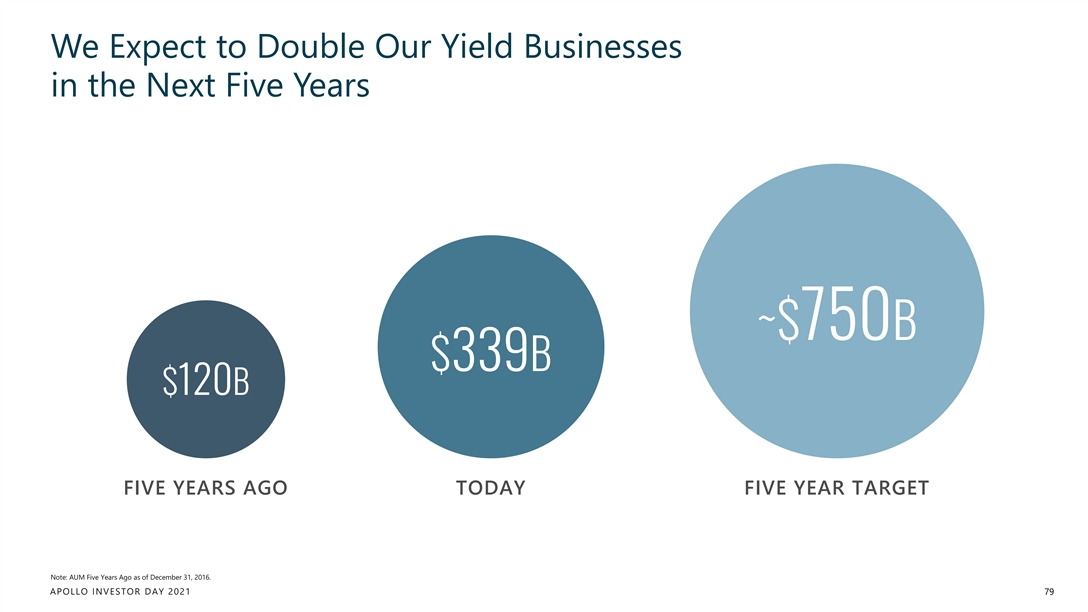
We Expect to Double Our Yield Businesses in the Next Five Years ~$750B $339B $120B FIVE YEARS AGO TODAY FIVE YEAR TARGET Note: AUM Five Years Ago as of December 31, 2016. APOLLO INVESTOR DAY 2021 79We Expect to Double Our Yield Businesses in the Next Five Years ~$750B $339B $120B FIVE YEARS AGO TODAY FIVE YEAR TARGET Note: AUM Five Years Ago as of December 31, 2016. APOLLO INVESTOR DAY 2021 79
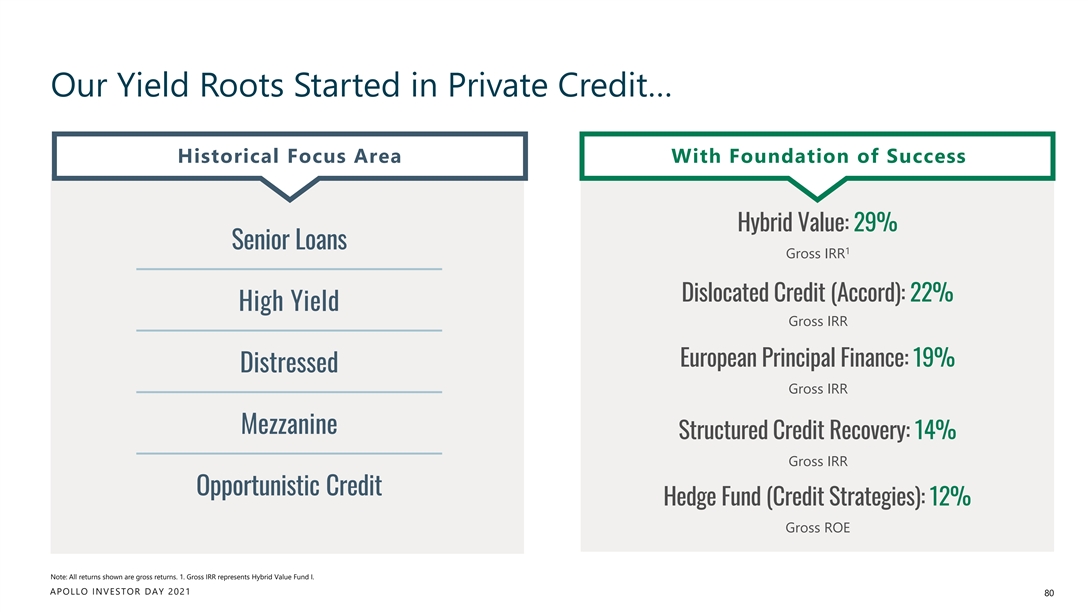
Our Yield Roots Started in Private Credit… Historical Focus Area With Foundation of Success Hybrid Value: 29% Senior Loans 1 Gross IRR Dislocated Credit (Accord): 22% High Yield Gross IRR European Principal Finance: 19% Distressed Gross IRR Mezzanine Structured Credit Recovery: 14% Gross IRR Opportunistic Credit Hedge Fund (Credit Strategies): 12% Gross ROE Note: All returns shown are gross returns. 1. Gross IRR represents Hybrid Value Fund I. APOLLO INVESTOR DAY 2021 80Our Yield Roots Started in Private Credit… Historical Focus Area With Foundation of Success Hybrid Value: 29% Senior Loans 1 Gross IRR Dislocated Credit (Accord): 22% High Yield Gross IRR European Principal Finance: 19% Distressed Gross IRR Mezzanine Structured Credit Recovery: 14% Gross IRR Opportunistic Credit Hedge Fund (Credit Strategies): 12% Gross ROE Note: All returns shown are gross returns. 1. Gross IRR represents Hybrid Value Fund I. APOLLO INVESTOR DAY 2021 80
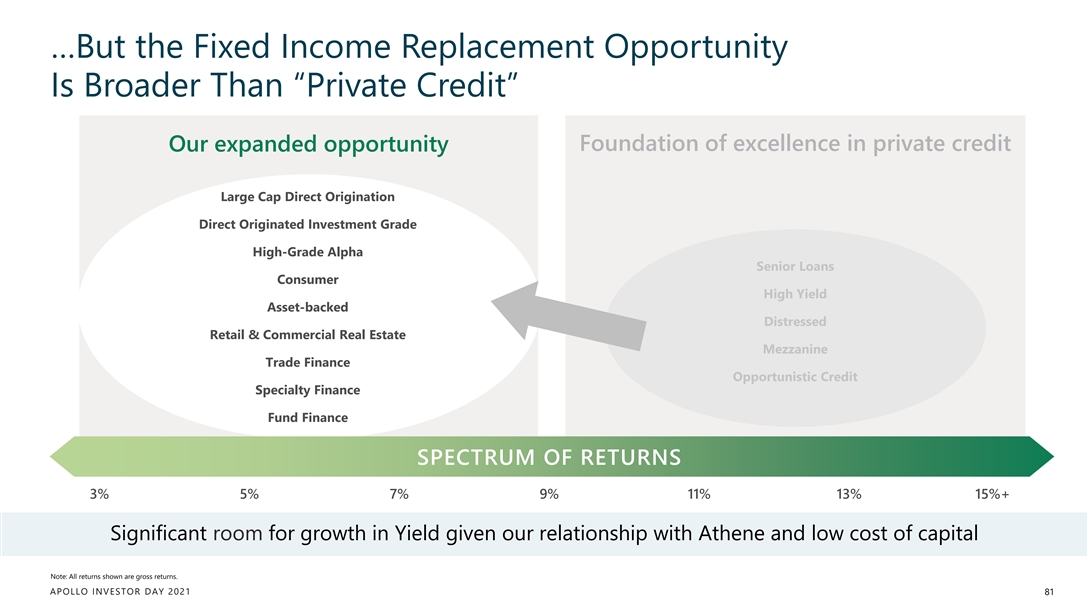
…But the Fixed Income Replacement Opportunity Is Broader Than “Private Credit” Foundation of excellence in private credit Our expanded opportunity Large Cap Direct Origination Direct Originated Investment Grade High-Grade Alpha Senior Loans Consumer High Yield Asset-backed Distressed Retail & Commercial Real Estate Mezzanine Trade Finance Opportunistic Credit Specialty Finance Fund Finance S SPE PEC CTRU TRUM M O OF F RE RETU TURN RNS S 3% 5% 7% 9% 11% 13% 15%+ Significant room for growth in Yield given our relationship with Athene and low cost of capital Note: All returns shown are gross returns. APOLLO INVESTOR DAY 2021 81…But the Fixed Income Replacement Opportunity Is Broader Than “Private Credit” Foundation of excellence in private credit Our expanded opportunity Large Cap Direct Origination Direct Originated Investment Grade High-Grade Alpha Senior Loans Consumer High Yield Asset-backed Distressed Retail & Commercial Real Estate Mezzanine Trade Finance Opportunistic Credit Specialty Finance Fund Finance S SPE PEC CTRU TRUM M O OF F RE RETU TURN RNS S 3% 5% 7% 9% 11% 13% 15%+ Significant room for growth in Yield given our relationship with Athene and low cost of capital Note: All returns shown are gross returns. APOLLO INVESTOR DAY 2021 81
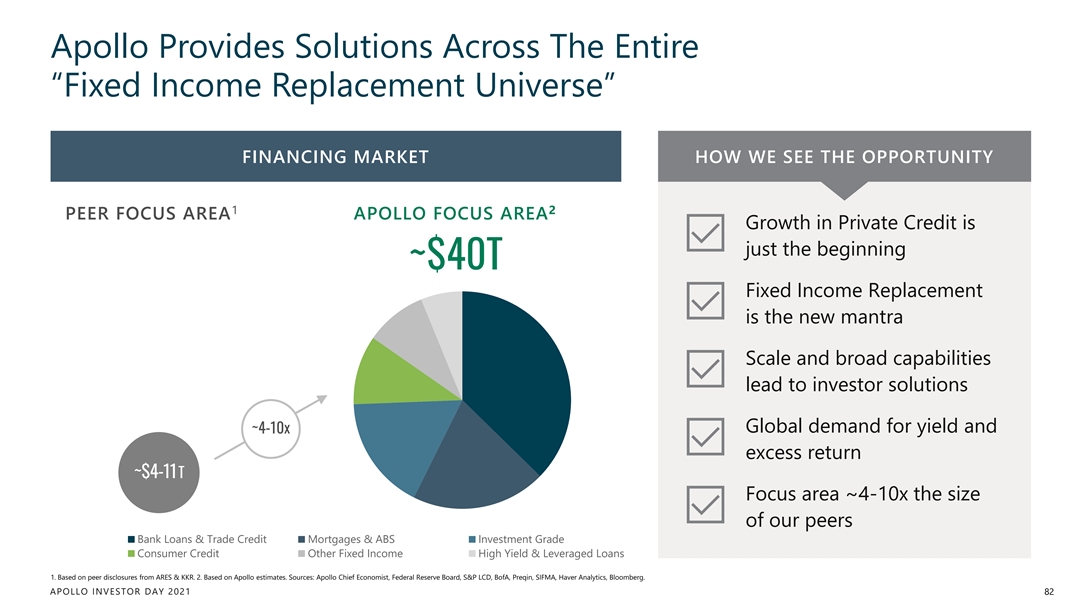
Apollo Provides Solutions Across The Entire “Fixed Income Replacement Universe” FINANCING MARKET HOW WE SEE THE OPPORTUNITY 1 2 PEER FOCUS AREA APOLLO FOCUS AREA Growth in Private Credit is just the beginning ~$40T Fixed Income Replacement is the new mantra Scale and broad capabilities lead to investor solutions ~$40T Global demand for yield and ~4-10x excess return ~$4-11T Focus area ~4-10x the size of our peers Bank Loans & Trade Credit Mortgages & ABS Investment Grade Consumer Credit Other Fixed Income High Yield & Leveraged Loans 1. Based on peer disclosures from ARES & KKR. 2. Based on Apollo estimates. Sources: Apollo Chief Economist, Federal Reserve Board, S&P LCD, BofA, Preqin, SIFMA, Haver Analytics, Bloomberg. APOLLO INVESTOR DAY 2021 82Apollo Provides Solutions Across The Entire “Fixed Income Replacement Universe” FINANCING MARKET HOW WE SEE THE OPPORTUNITY 1 2 PEER FOCUS AREA APOLLO FOCUS AREA Growth in Private Credit is just the beginning ~$40T Fixed Income Replacement is the new mantra Scale and broad capabilities lead to investor solutions ~$40T Global demand for yield and ~4-10x excess return ~$4-11T Focus area ~4-10x the size of our peers Bank Loans & Trade Credit Mortgages & ABS Investment Grade Consumer Credit Other Fixed Income High Yield & Leveraged Loans 1. Based on peer disclosures from ARES & KKR. 2. Based on Apollo estimates. Sources: Apollo Chief Economist, Federal Reserve Board, S&P LCD, BofA, Preqin, SIFMA, Haver Analytics, Bloomberg. APOLLO INVESTOR DAY 2021 82
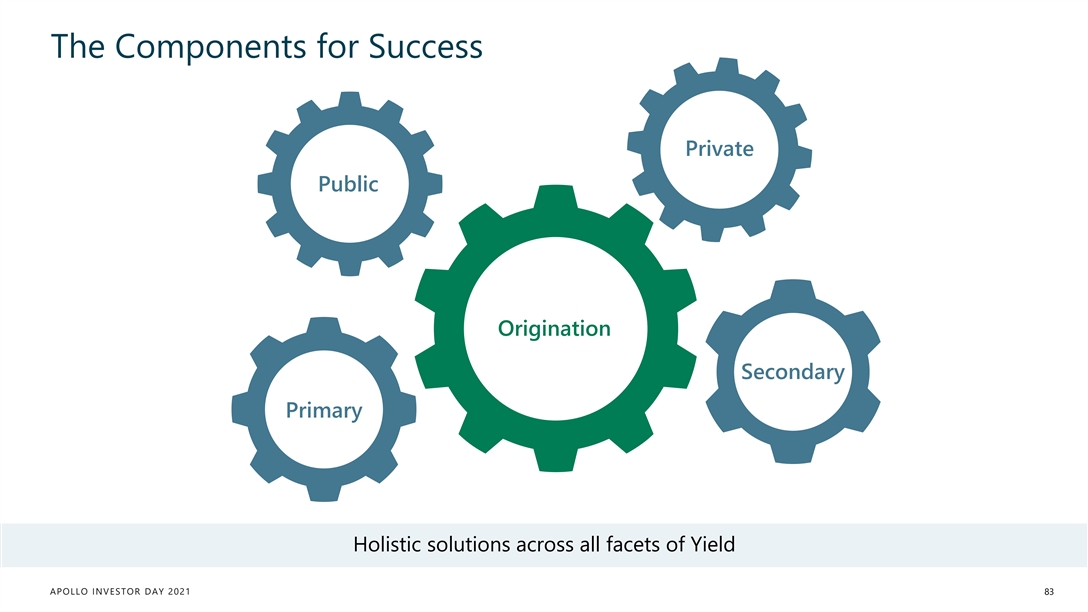
The Components for Success Private Public Origination Secondary Primary Holistic solutions across all facets of Yield Holistic solutions across all facets of Yield APOLLO INVESTOR DAY 2021 83The Components for Success Private Public Origination Secondary Primary Holistic solutions across all facets of Yield Holistic solutions across all facets of Yield APOLLO INVESTOR DAY 2021 83
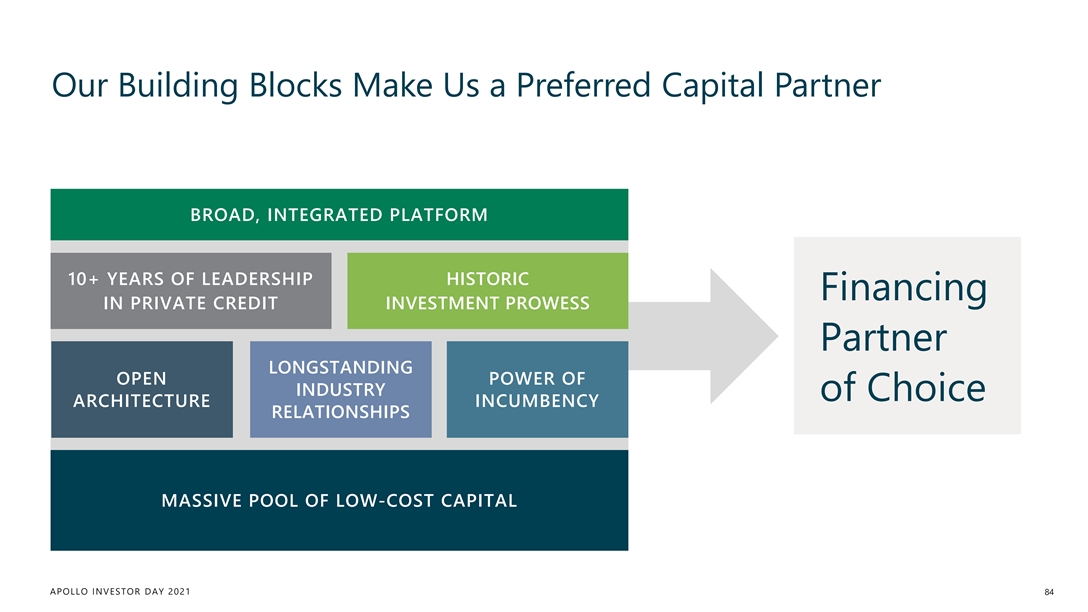
Our Building Blocks Make Us a Preferred Capital Partner BROAD, INTEGRATED PLATFORM 10+ YEARS OF LEADERSHIP HISTORIC Financing IN PRIVATE CREDIT INVESTMENT PROWESS Partner LONGSTvANDING OPEN POWER OF INDUSTRY of Choice ARCHITECTURE INCUMBENCY RELATIONSHIPS MASSIVE POOL OF LOW-COST CAPITAL APOLLO INVESTOR DAY 2021 84Our Building Blocks Make Us a Preferred Capital Partner BROAD, INTEGRATED PLATFORM 10+ YEARS OF LEADERSHIP HISTORIC Financing IN PRIVATE CREDIT INVESTMENT PROWESS Partner LONGSTvANDING OPEN POWER OF INDUSTRY of Choice ARCHITECTURE INCUMBENCY RELATIONSHIPS MASSIVE POOL OF LOW-COST CAPITAL APOLLO INVESTOR DAY 2021 84
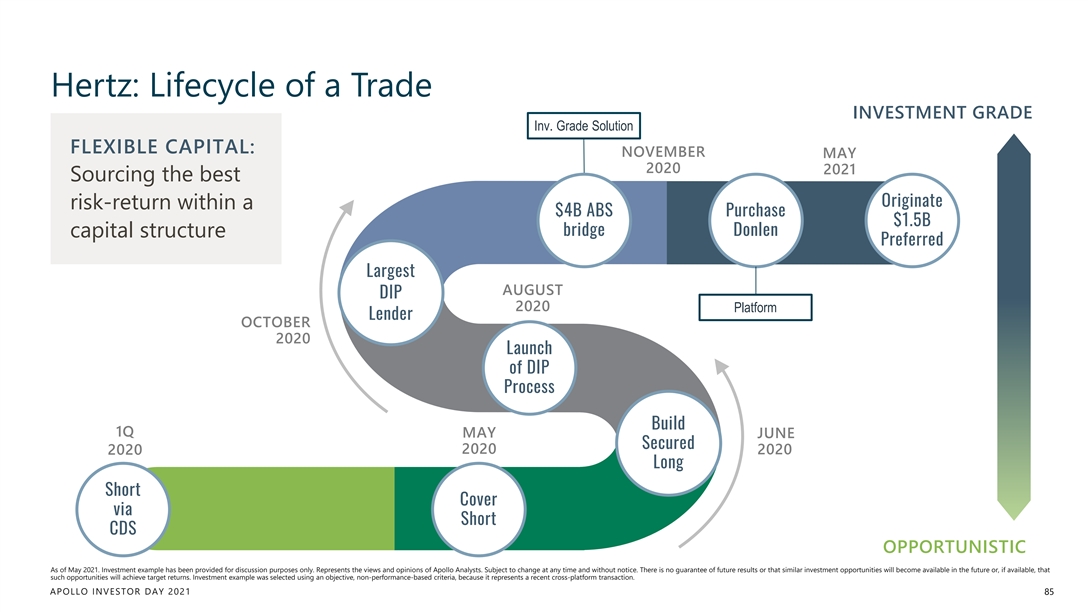
Hertz: Lifecycle of a Trade INVESTMENT GRADE Inv. Grade Solution FLEXIBLE CAPITAL: NOVEMBER MAY 2020 2021 Sourcing the best Originate risk-return within a $4B ABS Purchase $1.5B bridge Donlen capital structure Preferred Largest AUGUST DIP 2020 Platform Lender OCTOBER 2020 Launch of DIP Process Build 1Q MAY JUNE Secured 2020 2020 2020 Long Short Cover via Short CDS OPPORTUNISTIC As of May 2021. Investment example has been provided for discussion purposes only. Represents the views and opinions of Apollo Analysts. Subject to change at any time and without notice. There is no guarantee of future results or that similar investment opportunities will become available in the future or, if available, that such opportunities will achieve target returns. Investment example was selected using an objective, non-performance-based criteria, because it represents a recent cross-platform transaction. APOLLO INVESTOR DAY 2021 85
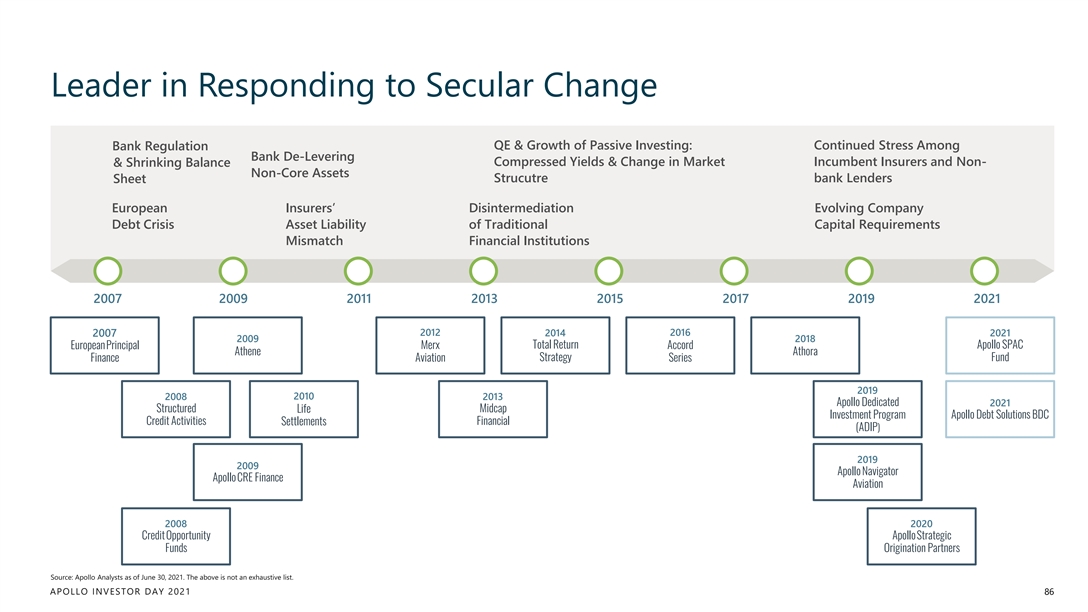
Leader in Responding to Secular Change Bank Regulation QE & Growth of Passive Investing: Continued Stress Among Bank De-Levering Compressed Yields & Change in Market Incumbent Insurers and Non- & Shrinking Balance Non-Core Assets Strucutre bank Lenders Sheet European Insurers’ Disintermediation Evolving Company Debt Crisis Asset Liability of Traditional Capital Requirements Mismatch Financial Institutions 2007 2009 2011 2013 2015 2017 2019 2021 2012 2014 2016 2021 2007 2009 2018 European Principal Merx Total Return Accord Apollo SPAC Athene Athora Strategy Fund Finance Aviation Series 2019 2008 2010 2013 Apollo Dedicated 2021 Structured Midcap Life Investment Program Apollo Debt Solutions BDC Credit Activities Settlements Financial (ADIP) 2019 2009 Apollo Navigator Apollo CRE Finance Aviation 2008 2020 Credit Opportunity ApolloStrategic Funds Origination Partners Source: Apollo Analysts as of June 30, 2021. The above is not an exhaustive list. APOLLO INVESTOR DAY 2021 86Leader in Responding to Secular Change Bank Regulation QE & Growth of Passive Investing: Continued Stress Among Bank De-Levering Compressed Yields & Change in Market Incumbent Insurers and Non- & Shrinking Balance Non-Core Assets Strucutre bank Lenders Sheet European Insurers’ Disintermediation Evolving Company Debt Crisis Asset Liability of Traditional Capital Requirements Mismatch Financial Institutions 2007 2009 2011 2013 2015 2017 2019 2021 2012 2014 2016 2021 2007 2009 2018 European Principal Merx Total Return Accord Apollo SPAC Athene Athora Strategy Fund Finance Aviation Series 2019 2008 2010 2013 Apollo Dedicated 2021 Structured Midcap Life Investment Program Apollo Debt Solutions BDC Credit Activities Settlements Financial (ADIP) 2019 2009 Apollo Navigator Apollo CRE Finance Aviation 2008 2020 Credit Opportunity ApolloStrategic Funds Origination Partners Source: Apollo Analysts as of June 30, 2021. The above is not an exhaustive list. APOLLO INVESTOR DAY 2021 86
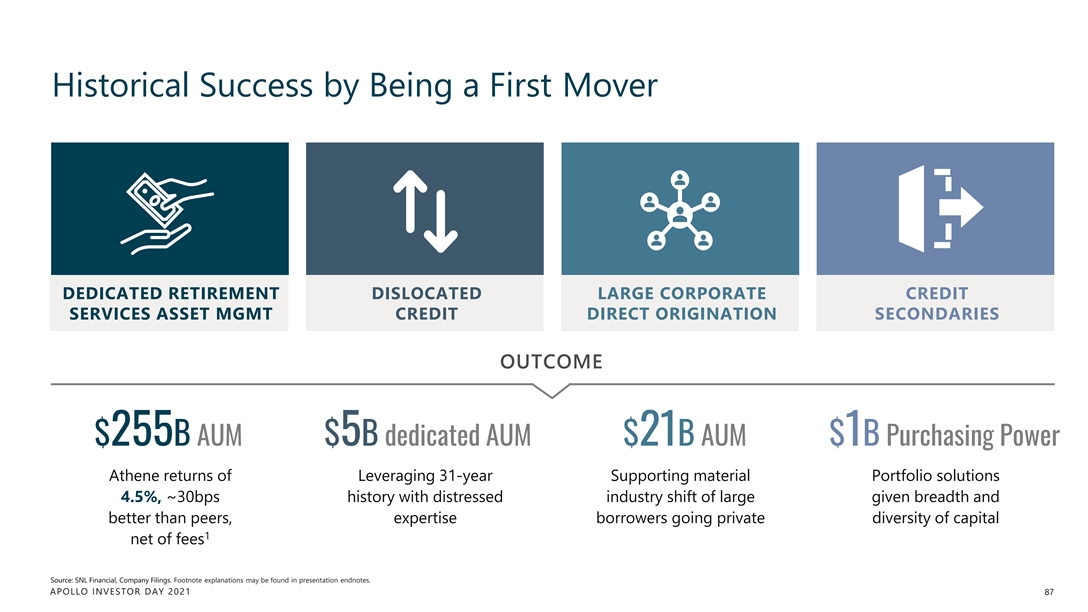
Historical Success by Being a First Mover DEDICATED RETIREMENT DISLOCATED LARGE CORPORATE CREDIT SERVICES ASSET MGMT CREDIT DIRECT ORIGINATION SECONDARIES OUTCOME $255B AUM $5B dedicated AUM $21B AUM $1B Purchasing Power Athene returns of Leveraging 31-year Supporting material Portfolio solutions 4.5%, ~30bps history with distressed industry shift of large given breadth and better than peers, expertise borrowers going private diversity of capital 1 net of fees Source: SNL Financial, Company Filings. Footnote explanations may be found in presentation endnotes. APOLLO INVESTOR DAY 2021 87
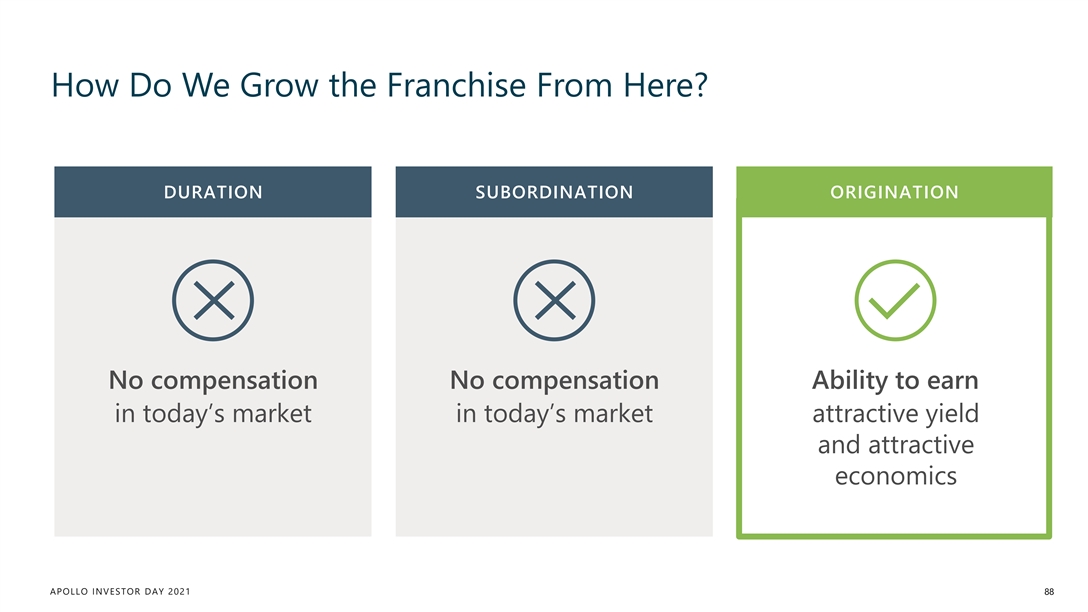
How Do We Grow the Franchise From Here? DURATION SUBORDINATION ORIGINATION No compensation No compensation Ability to earn in today’s market in today’s market attractive yield and attractive economics APOLLO INVESTOR DAY 2021 88How Do We Grow the Franchise From Here? DURATION SUBORDINATION ORIGINATION No compensation No compensation Ability to earn in today’s market in today’s market attractive yield and attractive economics APOLLO INVESTOR DAY 2021 88
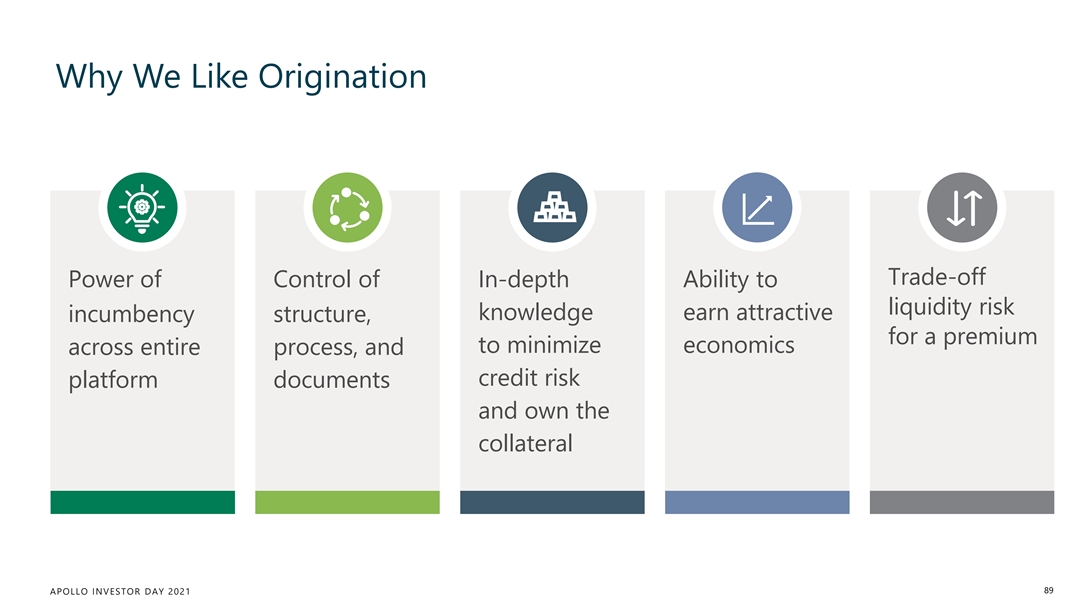
Why We Like Origination Trade-off Power of Control of In-depth Ability to liquidity risk knowledge earn attractive incumbency structure, for a premium to minimize economics across entire process, and credit risk platform documents and own the collateral 89 APOLLO INVESTOR DAY 2021Why We Like Origination Trade-off Power of Control of In-depth Ability to liquidity risk knowledge earn attractive incumbency structure, for a premium to minimize economics across entire process, and credit risk platform documents and own the collateral 89 APOLLO INVESTOR DAY 2021
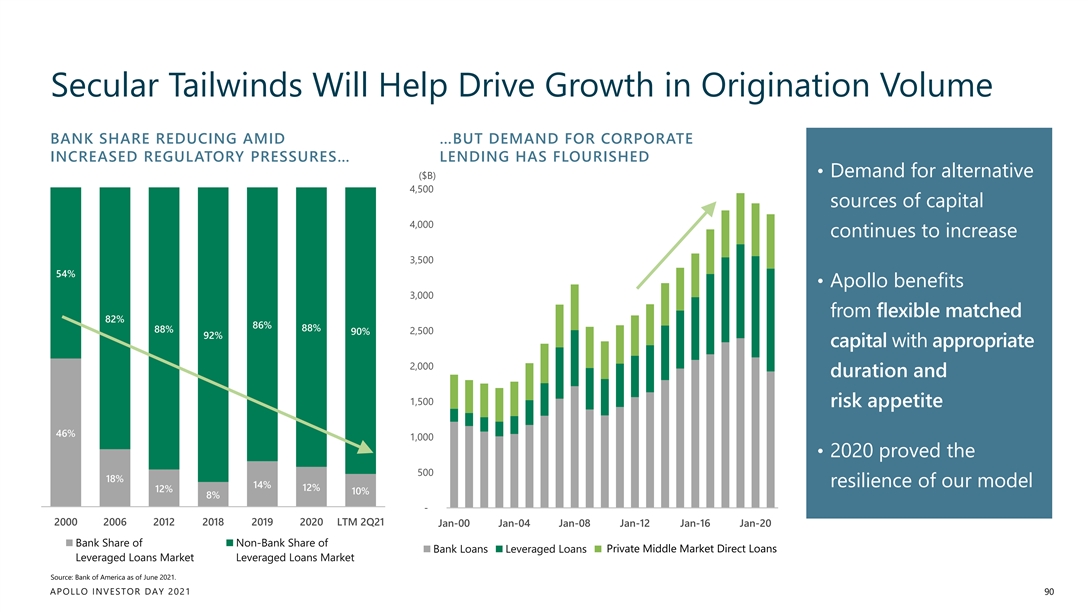
Secular Tailwinds Will Help Drive Growth in Origination Volume BANK SHARE REDUCING AMID …BUT DEMAND FOR CORPORATE INCREASED REGULATORY PRESSURES… LENDING HAS FLOURISHED • Demand for alternative ($B) 4,500 sources of capital 4,000 continues to increase 3,500 54% • Apollo benefits 3,000 from flexible matched 82% 86% 88% 88% 2,500 90% 92% capital with appropriate 2,000 duration and 1,500 risk appetite 46% 1,000 • 2020 proved the 500 18% resilience of our model 14% 12% 12% 10% 8% - 2000 2006 2012 2018 2019 2020 LTM 2Q21 Jan-00 Jan-04 Jan-08 Jan-12 Jan-16 Jan-20 Bank Share of Non-Bank Share of Private Middle Market Direct Loans Bank Loans Leveraged Loans Private MM Direct Loans Leveraged Loans Market Leveraged Loans Market Source: Bank of America as of June 2021. APOLLO INVESTOR DAY 2021 90Secular Tailwinds Will Help Drive Growth in Origination Volume BANK SHARE REDUCING AMID …BUT DEMAND FOR CORPORATE INCREASED REGULATORY PRESSURES… LENDING HAS FLOURISHED • Demand for alternative ($B) 4,500 sources of capital 4,000 continues to increase 3,500 54% • Apollo benefits 3,000 from flexible matched 82% 86% 88% 88% 2,500 90% 92% capital with appropriate 2,000 duration and 1,500 risk appetite 46% 1,000 • 2020 proved the 500 18% resilience of our model 14% 12% 12% 10% 8% - 2000 2006 2012 2018 2019 2020 LTM 2Q21 Jan-00 Jan-04 Jan-08 Jan-12 Jan-16 Jan-20 Bank Share of Non-Bank Share of Private Middle Market Direct Loans Bank Loans Leveraged Loans Private MM Direct Loans Leveraged Loans Market Leveraged Loans Market Source: Bank of America as of June 2021. APOLLO INVESTOR DAY 2021 90
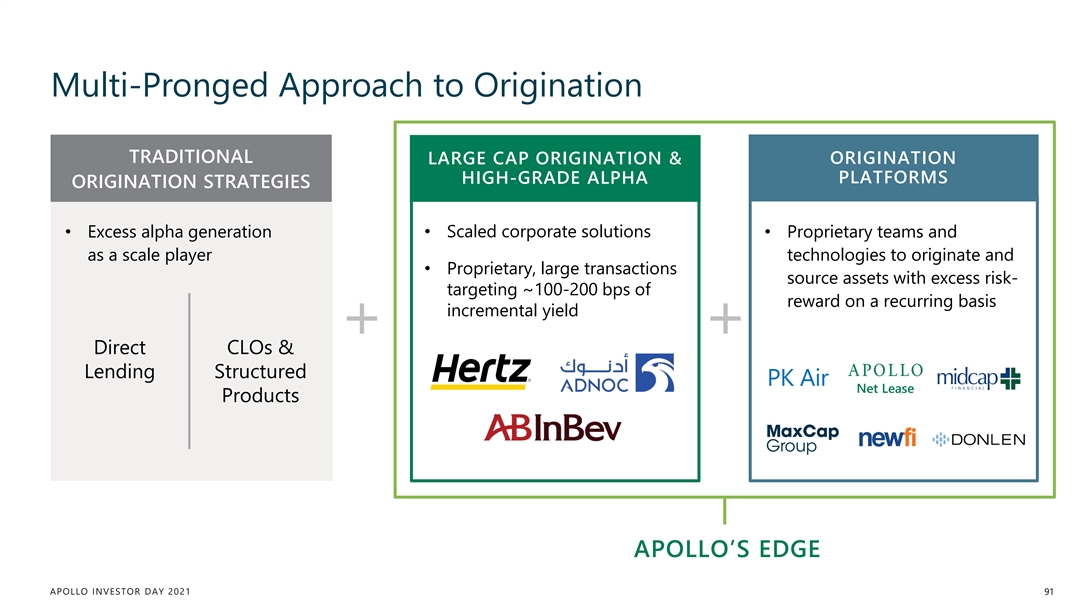
Multi-Pronged Approach to Origination TRADITIONAL LARGE CAP ORIGINATION & ORIGINATION PLATFORMS HIGH-GRADE ALPHA ORIGINATION STRATEGIES • Scaled corporate solutions • Excess alpha generation • Proprietary teams and as a scale player technologies to originate and • Proprietary, large transactions source assets with excess risk- targeting ~100-200 bps of reward on a recurring basis incremental yield + + Direct CLOs & Lending Structured PK Air Net Lease Products APOLLO’S EDGE APOLLO INVESTOR DAY 2021 91Multi-Pronged Approach to Origination TRADITIONAL LARGE CAP ORIGINATION & ORIGINATION PLATFORMS HIGH-GRADE ALPHA ORIGINATION STRATEGIES • Scaled corporate solutions • Excess alpha generation • Proprietary teams and as a scale player technologies to originate and • Proprietary, large transactions source assets with excess risk- targeting ~100-200 bps of reward on a recurring basis incremental yield + + Direct CLOs & Lending Structured PK Air Net Lease Products APOLLO’S EDGE APOLLO INVESTOR DAY 2021 91
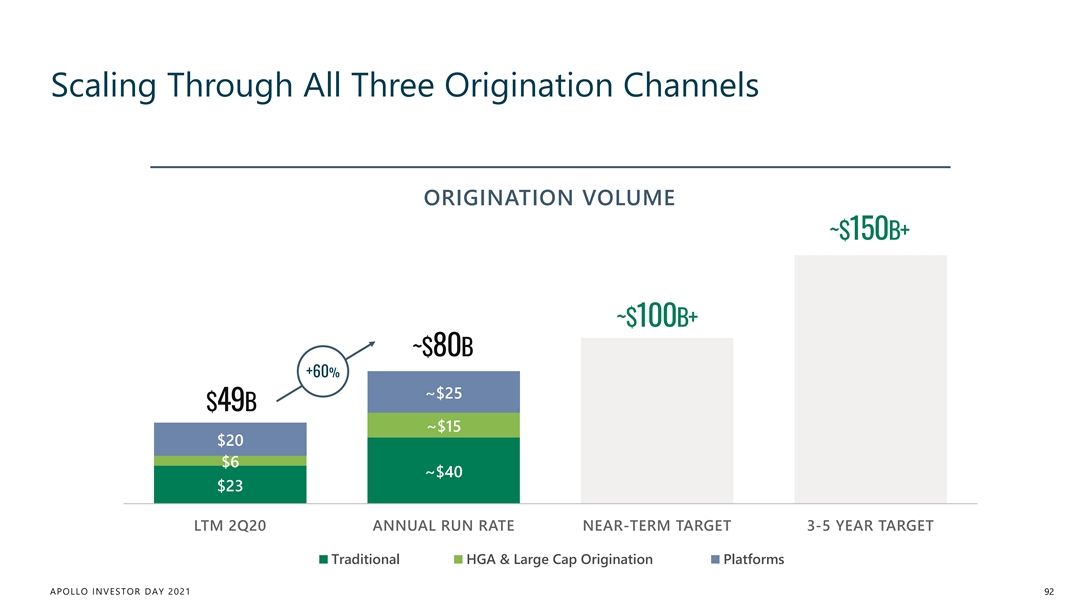
Scaling Through All Three Origination Channels ORIGINATION VOLUME ~$150B+ ~$100B+ ~$80B +60% ~$25 $49B ~$15 $20 $6 ~$40 $23 LTM 2Q20 ANNUAL RUN RATE NEAR-TERM TARGET 3-5 YEAR TARGET Traditional HGA & Large Cap Origination Platforms APOLLO INVESTOR DAY 2021 92Scaling Through All Three Origination Channels ORIGINATION VOLUME ~$150B+ ~$100B+ ~$80B +60% ~$25 $49B ~$15 $20 $6 ~$40 $23 LTM 2Q20 ANNUAL RUN RATE NEAR-TERM TARGET 3-5 YEAR TARGET Traditional HGA & Large Cap Origination Platforms APOLLO INVESTOR DAY 2021 92
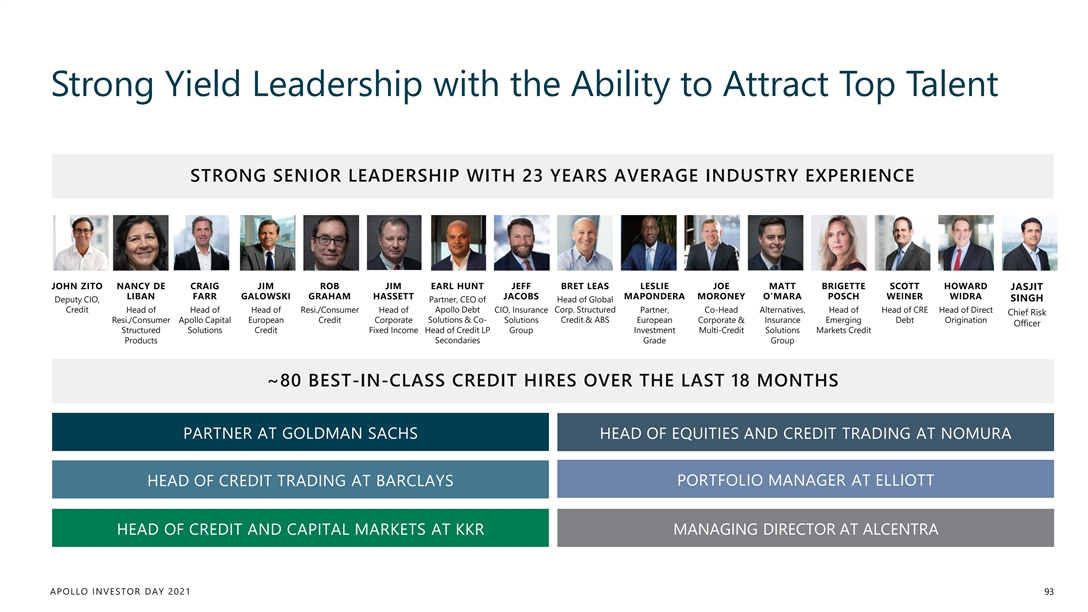
Strong Yield Leadership with the Ability to Attract Top Talent STRONG SENIOR LEADERSHIP WITH 23 YEARS AVERAGE INDUSTRY EXPERIENCE JOHN ZITO NANCY DE CRAIG JIM ROB JIM EARL HUNT JEFF BRET LEAS LESLIE JOE MATT BRIGETTE SCOTT HOWARD JASJIT LIBAN FARR GALOWSKI GRAHAM HASSETT JACOBS MAPONDERA MORONEY O’MARA POSCH WEINER WIDRA Deputy CIO, Partner, CEO of Head of Global SINGH Credit Head of Head of Head of Resi./Consumer Head of Apollo Debt CIO, Insurance Corp. Structured Partner, Co-Head Alternatives, Head of Head of CRE Head of Direct Chief Risk Resi./Consumer Apollo Capital European Credit Corporate Solutions & Co- Solutions Credit & ABS European Corporate & Insurance Emerging Debt Origination Officer Structured Solutions Credit Fixed Income Head of Credit LP Group Investment Multi-Credit Solutions Markets Credit Products Secondaries Grade Group ~80 BEST-IN-CLASS CREDIT HIRES OVER THE LAST 18 MONTHS PARTNER AT GOLDMAN SACHS HEAD OF EQUITIES AND CREDIT TRADING AT NOMURA HEAD OF CREDIT TRADING AT BARCLAYS PORTFOLIO MANAGER AT ELLIOTT HEAD OF CREDIT AND CAPITAL MARKETS AT KKR MANAGING DIRECTOR AT ALCENTRA APOLLO INVESTOR DAY 2021 93Strong Yield Leadership with the Ability to Attract Top Talent STRONG SENIOR LEADERSHIP WITH 23 YEARS AVERAGE INDUSTRY EXPERIENCE JOHN ZITO NANCY DE CRAIG JIM ROB JIM EARL HUNT JEFF BRET LEAS LESLIE JOE MATT BRIGETTE SCOTT HOWARD JASJIT LIBAN FARR GALOWSKI GRAHAM HASSETT JACOBS MAPONDERA MORONEY O’MARA POSCH WEINER WIDRA Deputy CIO, Partner, CEO of Head of Global SINGH Credit Head of Head of Head of Resi./Consumer Head of Apollo Debt CIO, Insurance Corp. Structured Partner, Co-Head Alternatives, Head of Head of CRE Head of Direct Chief Risk Resi./Consumer Apollo Capital European Credit Corporate Solutions & Co- Solutions Credit & ABS European Corporate & Insurance Emerging Debt Origination Officer Structured Solutions Credit Fixed Income Head of Credit LP Group Investment Multi-Credit Solutions Markets Credit Products Secondaries Grade Group ~80 BEST-IN-CLASS CREDIT HIRES OVER THE LAST 18 MONTHS PARTNER AT GOLDMAN SACHS HEAD OF EQUITIES AND CREDIT TRADING AT NOMURA HEAD OF CREDIT TRADING AT BARCLAYS PORTFOLIO MANAGER AT ELLIOTT HEAD OF CREDIT AND CAPITAL MARKETS AT KKR MANAGING DIRECTOR AT ALCENTRA APOLLO INVESTOR DAY 2021 93
CAPITAL SOLUTIONS BROADENS OUR DISTRIBUTION FUNNEL A AP PO OL LL LO O IIN NV VE ES ST TO OR R D DA AY Y 2021 2021 94
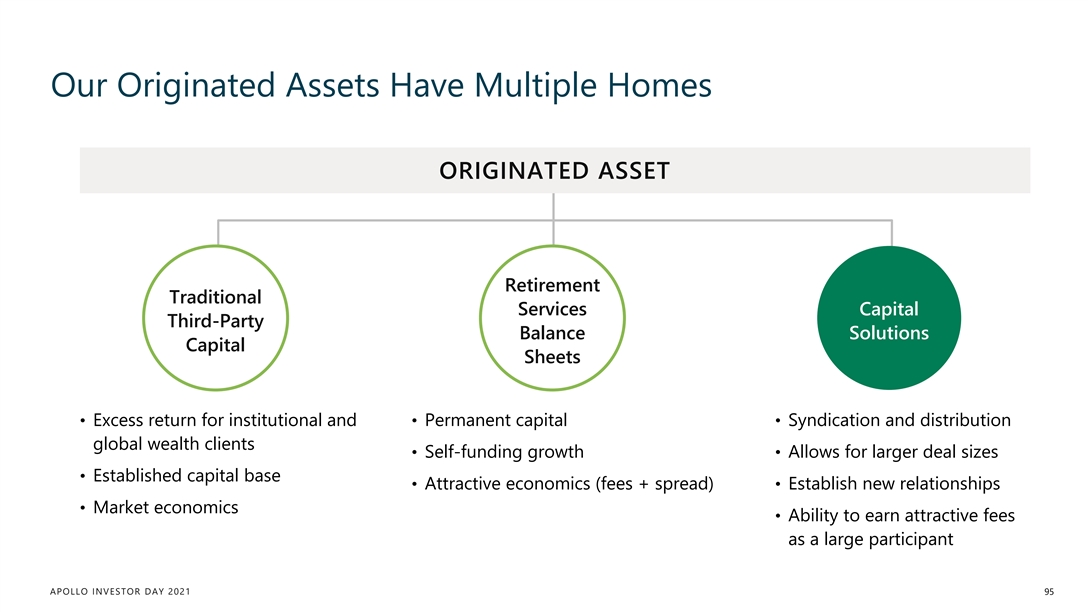
Our Originated Assets Have Multiple Homes ORIGINATED ASSET Retirement Traditional Services Capital Third-Party Balance Solutions Capital Sheets • Excess return for institutional and • Permanent capital • Syndication and distribution global wealth clients • Self-funding growth • Allows for larger deal sizes • Established capital base • Attractive economics (fees + spread) • Establish new relationships • Market economics • Ability to earn attractive fees as a large participant APOLLO INVESTOR DAY 2021 95Our Originated Assets Have Multiple Homes ORIGINATED ASSET Retirement Traditional Services Capital Third-Party Balance Solutions Capital Sheets • Excess return for institutional and • Permanent capital • Syndication and distribution global wealth clients • Self-funding growth • Allows for larger deal sizes • Established capital base • Attractive economics (fees + spread) • Establish new relationships • Market economics • Ability to earn attractive fees as a large participant APOLLO INVESTOR DAY 2021 95
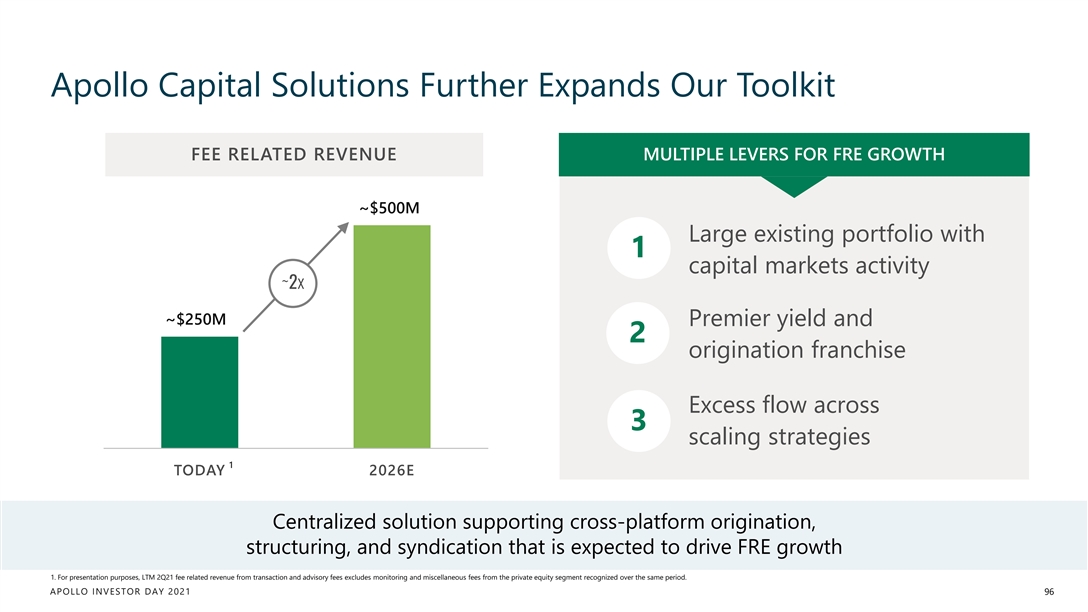
Apollo Capital Solutions Further Expands Our Toolkit FEE RELATED REVENUE MULTIPLE LEVERS FOR FRE GROWTH ~$500M Large existing portfolio with 1 capital markets activity ~2x ~$250M Premier yield and 2 origination franchise Excess flow across 3 scaling strategies 1 TODAY 2026E Centralized solution supporting cross-platform origination, structuring, and syndication that is expected to drive FRE growth 1. For presentation purposes, LTM 2Q21 fee related revenue from transaction and advisory fees excludes monitoring and miscellaneous fees from the private equity segment recognized over the same period. APOLLO INVESTOR DAY 2021 96Apollo Capital Solutions Further Expands Our Toolkit FEE RELATED REVENUE MULTIPLE LEVERS FOR FRE GROWTH ~$500M Large existing portfolio with 1 capital markets activity ~2x ~$250M Premier yield and 2 origination franchise Excess flow across 3 scaling strategies 1 TODAY 2026E Centralized solution supporting cross-platform origination, structuring, and syndication that is expected to drive FRE growth 1. For presentation purposes, LTM 2Q21 fee related revenue from transaction and advisory fees excludes monitoring and miscellaneous fees from the private equity segment recognized over the same period. APOLLO INVESTOR DAY 2021 96
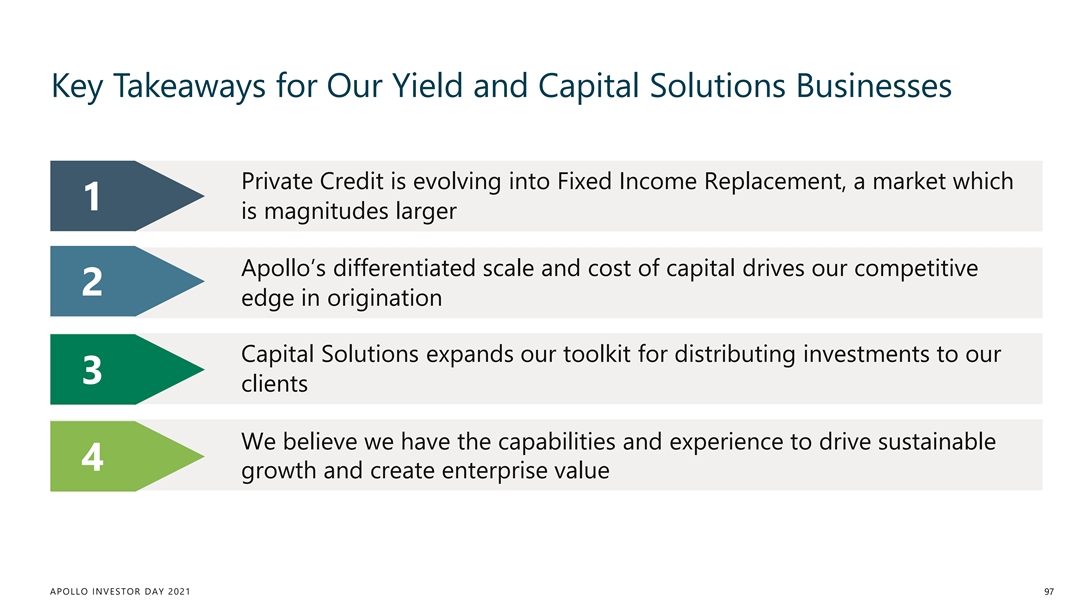
Key Takeaways for Our Yield and Capital Solutions Businesses Private Credit is evolving into Fixed Income Replacement, a market which 1 is magnitudes larger Apollo’s differentiated scale and cost of capital drives our competitive 2 edge in origination Capital Solutions expands our toolkit for distributing investments to our 3 clients We believe we have the capabilities and experience to drive sustainable 4 growth and create enterprise value APOLLO INVESTOR DAY 2021 97Key Takeaways for Our Yield and Capital Solutions Businesses Private Credit is evolving into Fixed Income Replacement, a market which 1 is magnitudes larger Apollo’s differentiated scale and cost of capital drives our competitive 2 edge in origination Capital Solutions expands our toolkit for distributing investments to our 3 clients We believe we have the capabilities and experience to drive sustainable 4 growth and create enterprise value APOLLO INVESTOR DAY 2021 97
Origination Platforms CHRIS EDSON Senior Partner, Co-Head of US FIG APOLLO INVESTOR DAY 2021Origination Platforms CHRIS EDSON Senior Partner, Co-Head of US FIG APOLLO INVESTOR DAY 2021
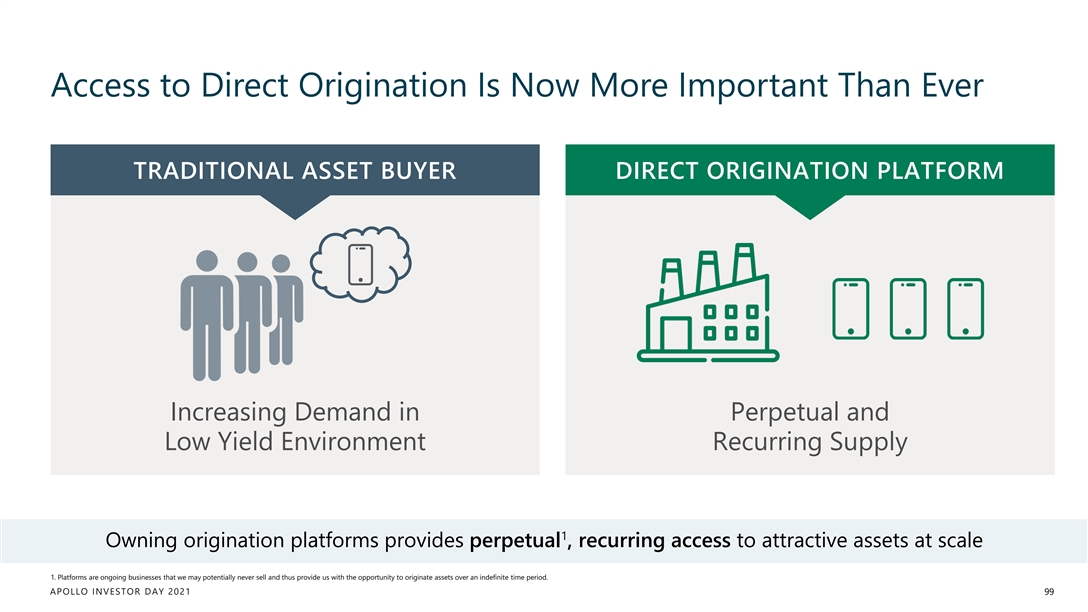
Access to Direct Origination Is Now More Important Than Ever TRADITIONAL ASSET BUYER DIRECT ORIGINATION PLATFORM Increasing Demand in Perpetual and Low Yield Environment Recurring Supply 1 Owning origination platforms provides perpetual , recurring access to attractive assets at scale 1. Platforms are ongoing businesses that we may potentially never sell and thus provide us with the opportunity to originate assets over an indefinite time period. APOLLO INVESTOR DAY 2021 99Access to Direct Origination Is Now More Important Than Ever TRADITIONAL ASSET BUYER DIRECT ORIGINATION PLATFORM Increasing Demand in Perpetual and Low Yield Environment Recurring Supply 1 Owning origination platforms provides perpetual , recurring access to attractive assets at scale 1. Platforms are ongoing businesses that we may potentially never sell and thus provide us with the opportunity to originate assets over an indefinite time period. APOLLO INVESTOR DAY 2021 99
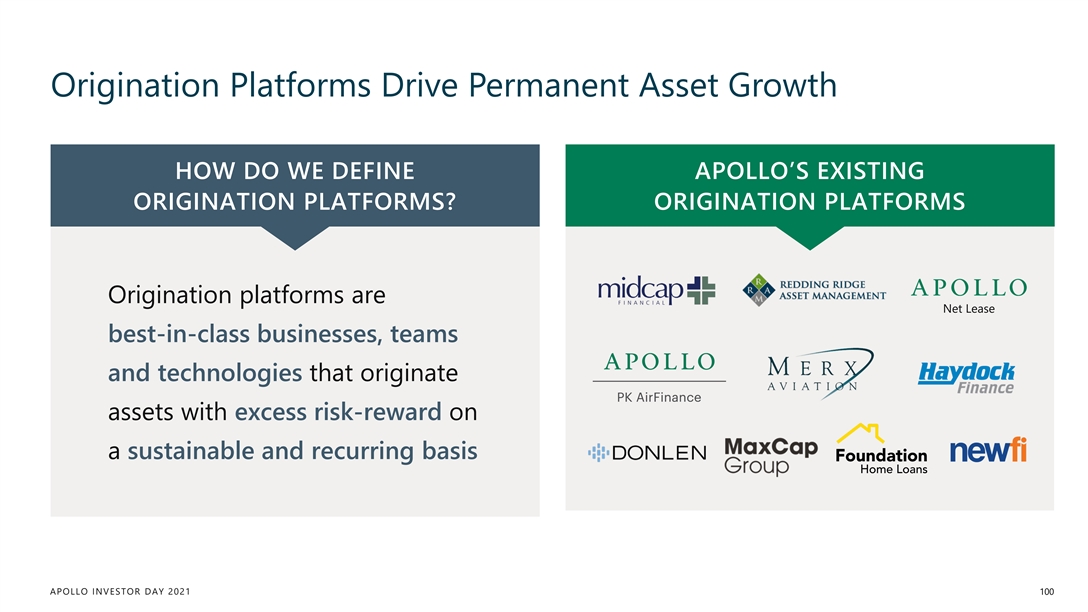
Origination Platforms Drive Permanent Asset Growth HOW DO WE DEFINE APOLLO’S EXISTING ORIGINATION PLATFORMS? ORIGINATION PLATFORMS Origination platforms are Net Lease best-in-class businesses, teams and technologies that originate assets with excess risk-reward on a sustainable and recurring basis APOLLO INVESTOR DAY 2021 100Origination Platforms Drive Permanent Asset Growth HOW DO WE DEFINE APOLLO’S EXISTING ORIGINATION PLATFORMS? ORIGINATION PLATFORMS Origination platforms are Net Lease best-in-class businesses, teams and technologies that originate assets with excess risk-reward on a sustainable and recurring basis APOLLO INVESTOR DAY 2021 100
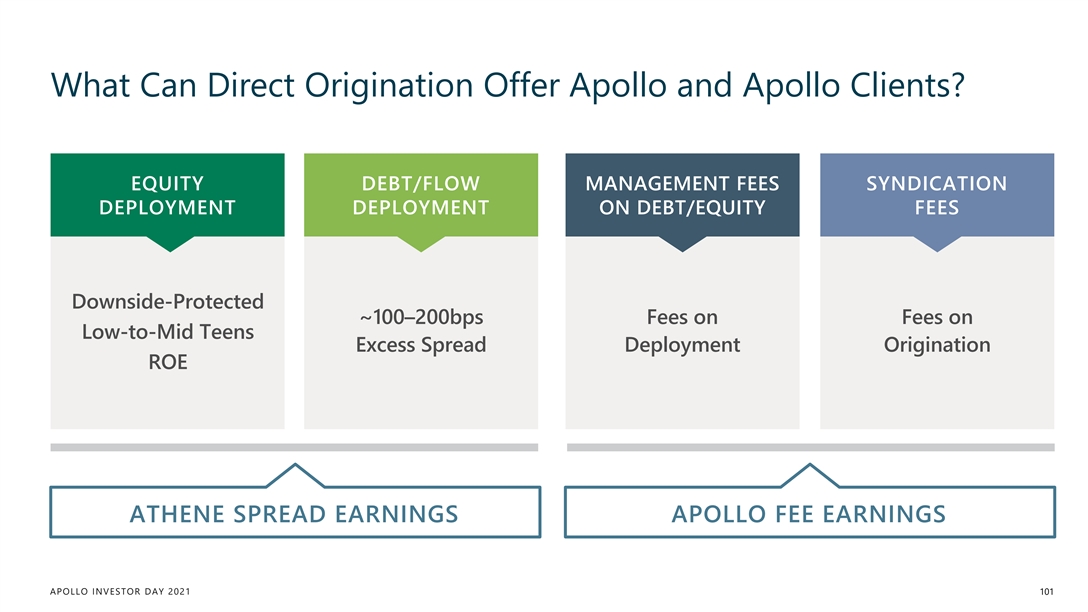
What Can Direct Origination Offer Apollo and Apollo Clients? EQUITY DEBT/FLOW MANAGEMENT FEES SYNDICATION DEPLOYMENT DEPLOYMENT ON DEBT/EQUITY FEES Downside-Protected ~100–200bps Fees on Fees on Low-to-Mid Teens Excess Spread Deployment Origination ROE ATHENE SPREAD EARNINGS APOLLO FEE EARNINGS APOLLO INVESTOR DAY 2021 101
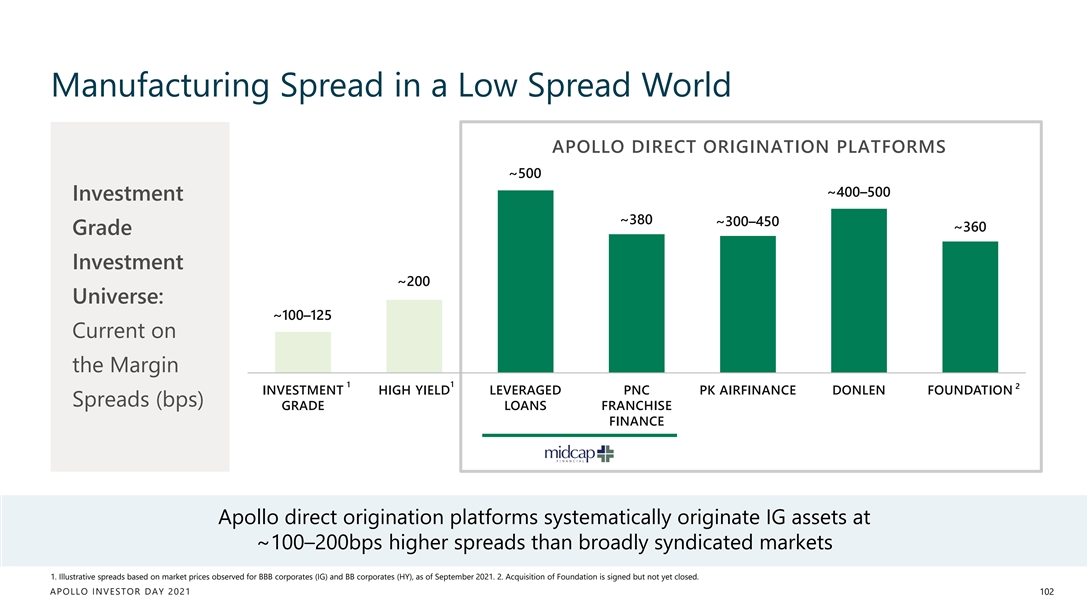
Manufacturing Spread in a Low Spread World APOLLO DIRECT ORIGINATION PLATFORMS ~500 ~400–500 Investment ~380 ~300–450 ~360 Grade Investment ~200 Universe: ~100–125 Current on the Margin 1 1 2 INVESTMENT HIGH YIELD LEVERAGED PNC PK AIRFINANCE DONLEN FOUNDATION Spreads (bps) GRADE LOANS FRANCHISE FINANCE Apollo direct origination platforms systematically originate IG assets at ~100–200bps higher spreads than broadly syndicated markets 1. Illustrative spreads based on market prices observed for BBB corporates (IG) and BB corporates (HY), as of September 2021. 2. Acquisition of Foundation is signed but not yet closed. APOLLO INVESTOR DAY 2021 102Manufacturing Spread in a Low Spread World APOLLO DIRECT ORIGINATION PLATFORMS ~500 ~400–500 Investment ~380 ~300–450 ~360 Grade Investment ~200 Universe: ~100–125 Current on the Margin 1 1 2 INVESTMENT HIGH YIELD LEVERAGED PNC PK AIRFINANCE DONLEN FOUNDATION Spreads (bps) GRADE LOANS FRANCHISE FINANCE Apollo direct origination platforms systematically originate IG assets at ~100–200bps higher spreads than broadly syndicated markets 1. Illustrative spreads based on market prices observed for BBB corporates (IG) and BB corporates (HY), as of September 2021. 2. Acquisition of Foundation is signed but not yet closed. APOLLO INVESTOR DAY 2021 102
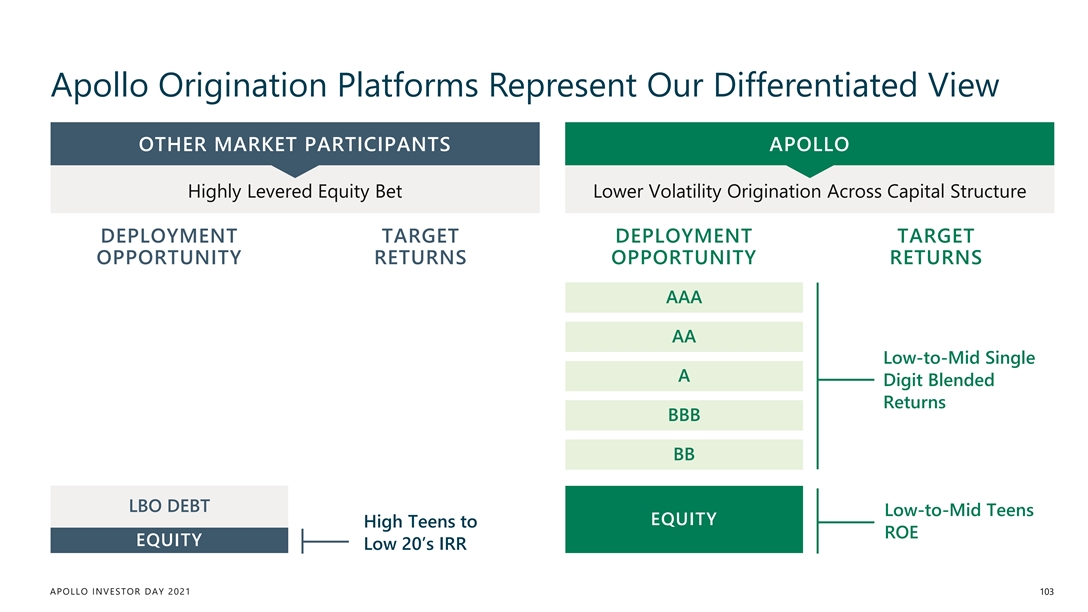
Apollo Origination Platforms Represent Our Differentiated View OTHER MARKET PARTICIPANTS APOLLO Highly Levered Equity Bet Lower Volatility Origination Across Capital Structure DEPLOYMENT TARGET DEPLOYMENT TARGET OPPORTUNITY RETURNS OPPORTUNITY RETURNS AAA AA Low-to-Mid Single A Digit Blended Returns BBB BB LBO DEBT Low-to-Mid Teens EQUITY High Teens to ROE EQUITY Low 20’s IRR APOLLO INVESTOR DAY 2021 103Apollo Origination Platforms Represent Our Differentiated View OTHER MARKET PARTICIPANTS APOLLO Highly Levered Equity Bet Lower Volatility Origination Across Capital Structure DEPLOYMENT TARGET DEPLOYMENT TARGET OPPORTUNITY RETURNS OPPORTUNITY RETURNS AAA AA Low-to-Mid Single A Digit Blended Returns BBB BB LBO DEBT Low-to-Mid Teens EQUITY High Teens to ROE EQUITY Low 20’s IRR APOLLO INVESTOR DAY 2021 103
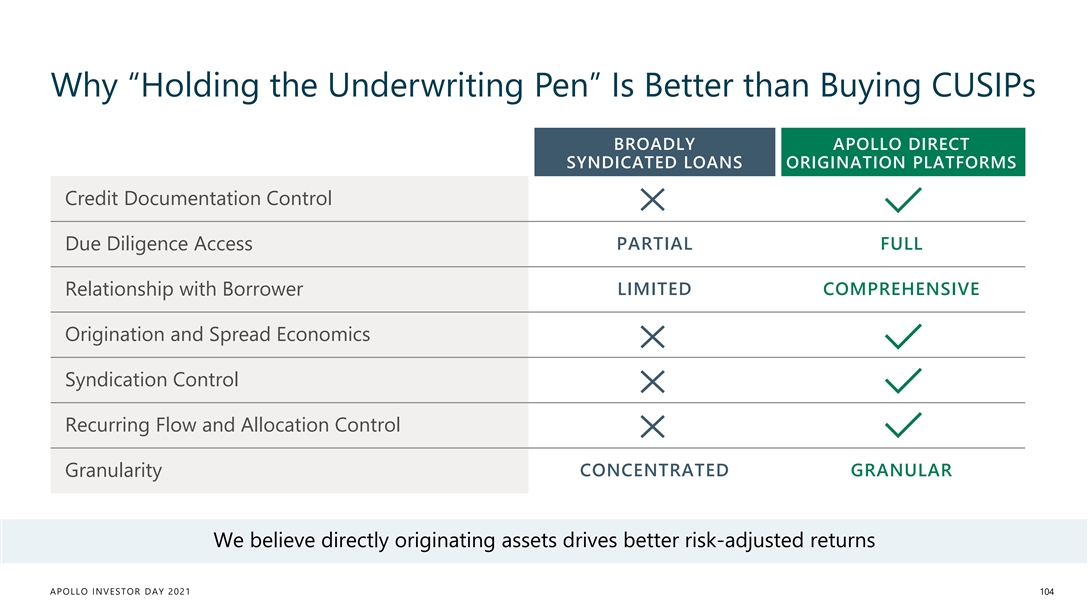
Why “Holding the Underwriting Pen” Is Better than Buying CUSIPs BROADLY APOLLO DIRECT SYNDICATED LOANS ORIGINATION PLATFORMS Credit Documentation Control Due Diligence Access PARTIAL FULL LIMITED COMPREHENSIVE Relationship with Borrower Origination and Spread Economics Syndication Control Recurring Flow and Allocation Control CONCENTRATED GRANULAR Granularity We believe directly originating assets drives better risk-adjusted returns APOLLO INVESTOR DAY 2021 104Why “Holding the Underwriting Pen” Is Better than Buying CUSIPs BROADLY APOLLO DIRECT SYNDICATED LOANS ORIGINATION PLATFORMS Credit Documentation Control Due Diligence Access PARTIAL FULL LIMITED COMPREHENSIVE Relationship with Borrower Origination and Spread Economics Syndication Control Recurring Flow and Allocation Control CONCENTRATED GRANULAR Granularity We believe directly originating assets drives better risk-adjusted returns APOLLO INVESTOR DAY 2021 104
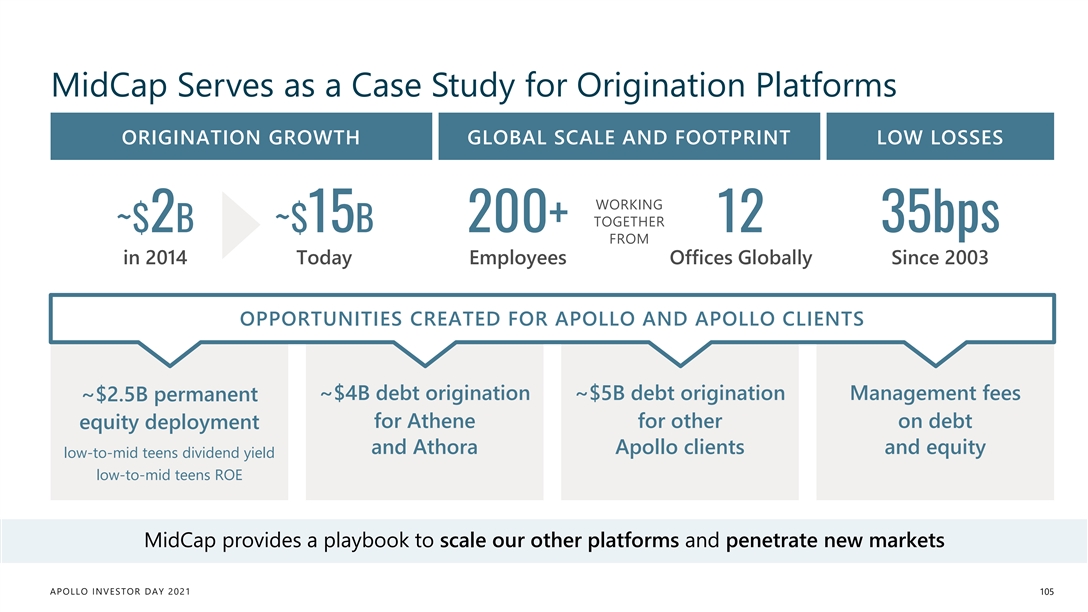
MidCap Serves as a Case Study for Origination Platforms ORIGINATION GROWTH GLOBAL SCALE AND FOOTPRINT LOW LOSSES WORKING TOGETHER ~$2B ~$15B 200+ 12 35bps FROM in 2014 Today Employees Offices Globally Since 2003 OPPORTUNITIES CREATED FOR APOLLO AND APOLLO CLIENTS ~$4B debt origination ~$5B debt origination Management fees ~$2.5B permanent for Athene for other on debt equity deployment and Athora Apollo clients and equity low-to-mid teens dividend yield low-to-mid teens ROE MidCap provides a playbook to scale our other platforms and penetrate new markets APOLLO INVESTOR DAY 2021 105MidCap Serves as a Case Study for Origination Platforms ORIGINATION GROWTH GLOBAL SCALE AND FOOTPRINT LOW LOSSES WORKING TOGETHER ~$2B ~$15B 200+ 12 35bps FROM in 2014 Today Employees Offices Globally Since 2003 OPPORTUNITIES CREATED FOR APOLLO AND APOLLO CLIENTS ~$4B debt origination ~$5B debt origination Management fees ~$2.5B permanent for Athene for other on debt equity deployment and Athora Apollo clients and equity low-to-mid teens dividend yield low-to-mid teens ROE MidCap provides a playbook to scale our other platforms and penetrate new markets APOLLO INVESTOR DAY 2021 105
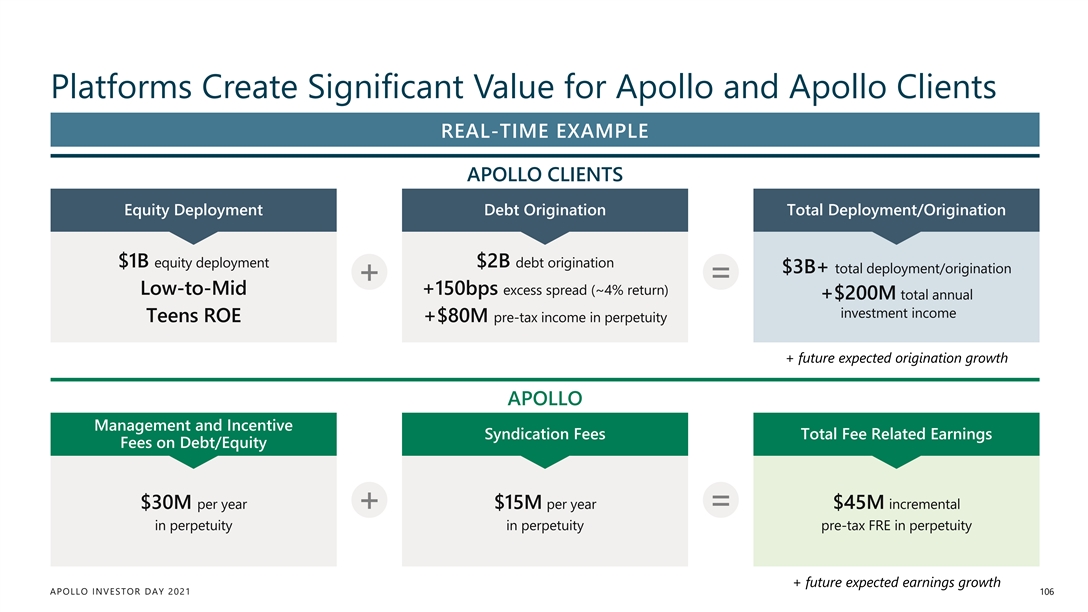
Platforms Create Significant Value for Apollo and Apollo Clients REAL-TIME EXAMPLE APOLLO CLIENTS Equity Deployment Debt Origination Total Deployment/Origination $1B equity deployment $2B debt origination $3B+ total deployment/origination + = Low-to-Mid +150bps excess spread (~4% return) +$200M total annual investment income Teens ROE +$80M pre-tax income in perpetuity + future expected origination growth APOLLO Management and Incentive Syndication Fees Total Fee Related Earnings Fees on Debt/Equity $30M per year $15M per year $45M incremental + = in perpetuity in perpetuity pre-tax FRE in perpetuity + future expected earnings growth APOLLO INVESTOR DAY 2021 106Platforms Create Significant Value for Apollo and Apollo Clients REAL-TIME EXAMPLE APOLLO CLIENTS Equity Deployment Debt Origination Total Deployment/Origination $1B equity deployment $2B debt origination $3B+ total deployment/origination + = Low-to-Mid +150bps excess spread (~4% return) +$200M total annual investment income Teens ROE +$80M pre-tax income in perpetuity + future expected origination growth APOLLO Management and Incentive Syndication Fees Total Fee Related Earnings Fees on Debt/Equity $30M per year $15M per year $45M incremental + = in perpetuity in perpetuity pre-tax FRE in perpetuity + future expected earnings growth APOLLO INVESTOR DAY 2021 106
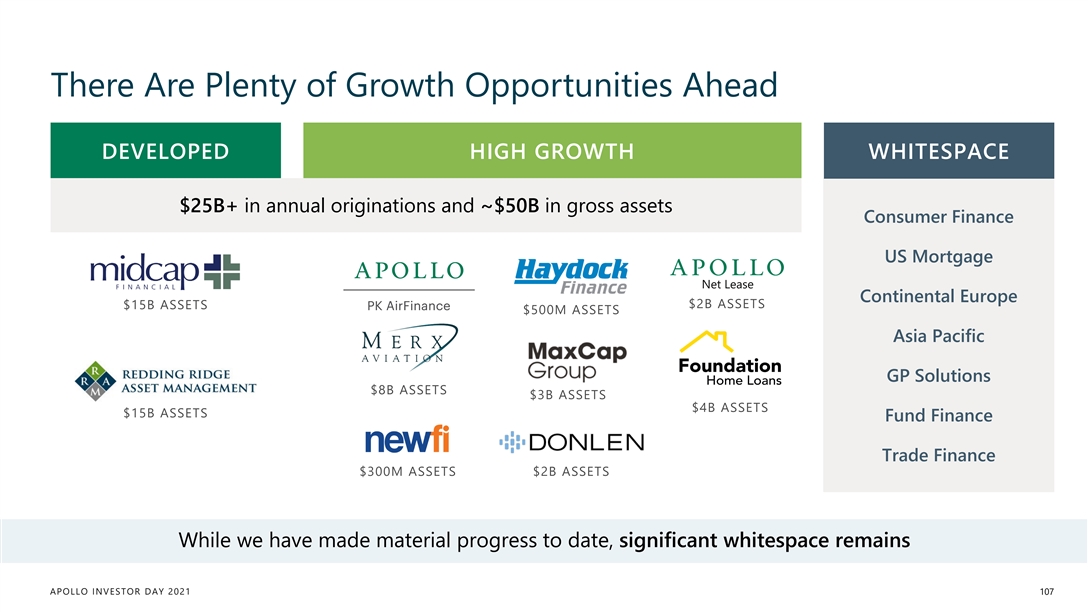
There Are Plenty of Growth Opportunities Ahead DEVELOPED HIGH GROWTH WHITESPACE $25B+ in annual originations and ~$50B in gross assets Consumer Finance US Mortgage Net Lease Continental Europe $2B ASSETS $15B ASSETS $500M ASSETS Asia Pacific GP Solutions $8B ASSETS $3B ASSETS $4B ASSETS $15B ASSETS Fund Finance Trade Finance $300M ASSETS $2B ASSETS While we have made material progress to date, significant whitespace remains APOLLO INVESTOR DAY 2021 107
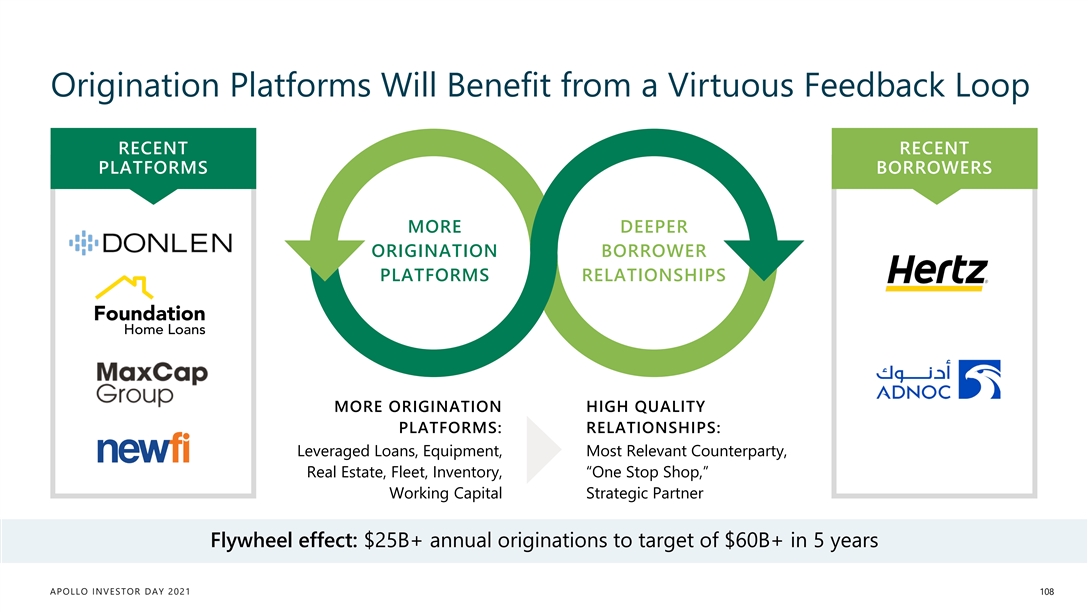
Origination Platforms Will Benefit from a Virtuous Feedback Loop RECENT RECENT PLATFORMS BORROWERS MORE DEEPER ORIGINATION BORROWER PLATFORMS RELATIONSHIPS MORE ORIGINATION HIGH QUALITY PLATFORMS: RELATIONSHIPS: Leveraged Loans, Equipment, Most Relevant Counterparty, Real Estate, Fleet, Inventory, “One Stop Shop,” Working Capital Strategic Partner Flywheel effect: $25B+ annual originations to target of $60B+ in 5 years APOLLO INVESTOR DAY 2021 108Origination Platforms Will Benefit from a Virtuous Feedback Loop RECENT RECENT PLATFORMS BORROWERS MORE DEEPER ORIGINATION BORROWER PLATFORMS RELATIONSHIPS MORE ORIGINATION HIGH QUALITY PLATFORMS: RELATIONSHIPS: Leveraged Loans, Equipment, Most Relevant Counterparty, Real Estate, Fleet, Inventory, “One Stop Shop,” Working Capital Strategic Partner Flywheel effect: $25B+ annual originations to target of $60B+ in 5 years APOLLO INVESTOR DAY 2021 108
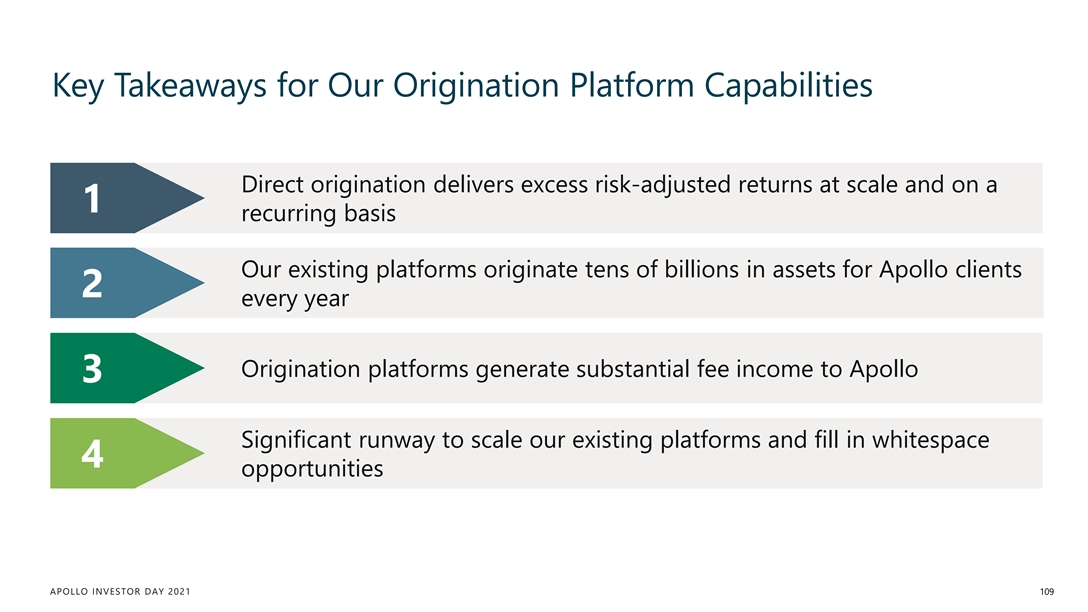
Key Takeaways for Our Origination Platform Capabilities Direct origination delivers excess risk-adjusted returns at scale and on a 1 recurring basis Our existing platforms originate tens of billions in assets for Apollo clients 2 every year Origination platforms generate substantial fee income to Apollo 3 Significant runway to scale our existing platforms and fill in whitespace 4 opportunities APOLLO INVESTOR DAY 2021 109Key Takeaways for Our Origination Platform Capabilities Direct origination delivers excess risk-adjusted returns at scale and on a 1 recurring basis Our existing platforms originate tens of billions in assets for Apollo clients 2 every year Origination platforms generate substantial fee income to Apollo 3 Significant runway to scale our existing platforms and fill in whitespace 4 opportunities APOLLO INVESTOR DAY 2021 109

Capital Solutions CRAIG FARR Senior Partner, Capital Solutions APOLLO INVESTOR DAY 2021Capital Solutions CRAIG FARR Senior Partner, Capital Solutions APOLLO INVESTOR DAY 2021

What You’ve Heard Thus Far… We source We generate Our origination Given ideal …Hence a need unique tremendous platforms holding size, for a centralized investments asset flow via augment this we often have utility to execute across the entire our Yield, Equity, with additional excess flow… and syndicate Apollo platform and Hybrid yield products capital markets businesses opportunities APOLLO INVESTOR DAY 2021 111What You’ve Heard Thus Far… We source We generate Our origination Given ideal …Hence a need unique tremendous platforms holding size, for a centralized investments asset flow via augment this we often have utility to execute across the entire our Yield, Equity, with additional excess flow… and syndicate Apollo platform and Hybrid yield products capital markets businesses opportunities APOLLO INVESTOR DAY 2021 111
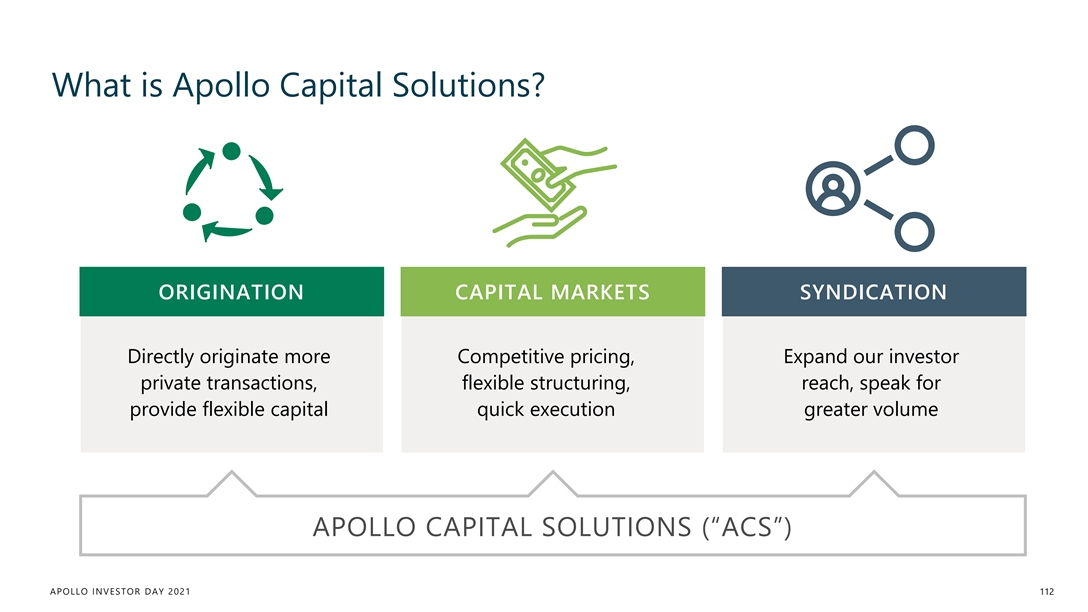
What is Apollo Capital Solutions? ORIGINATION CAPITAL MARKETS SYNDICATION Directly originate more Competitive pricing, Expand our investor private transactions, flexible structuring, reach, speak for provide flexible capital quick execution greater volume APOLLO CAPITAL SOLUTIONS (“ACS”) APOLLO INVESTOR DAY 2021 112What is Apollo Capital Solutions? ORIGINATION CAPITAL MARKETS SYNDICATION Directly originate more Competitive pricing, Expand our investor private transactions, flexible structuring, reach, speak for provide flexible capital quick execution greater volume APOLLO CAPITAL SOLUTIONS (“ACS”) APOLLO INVESTOR DAY 2021 112
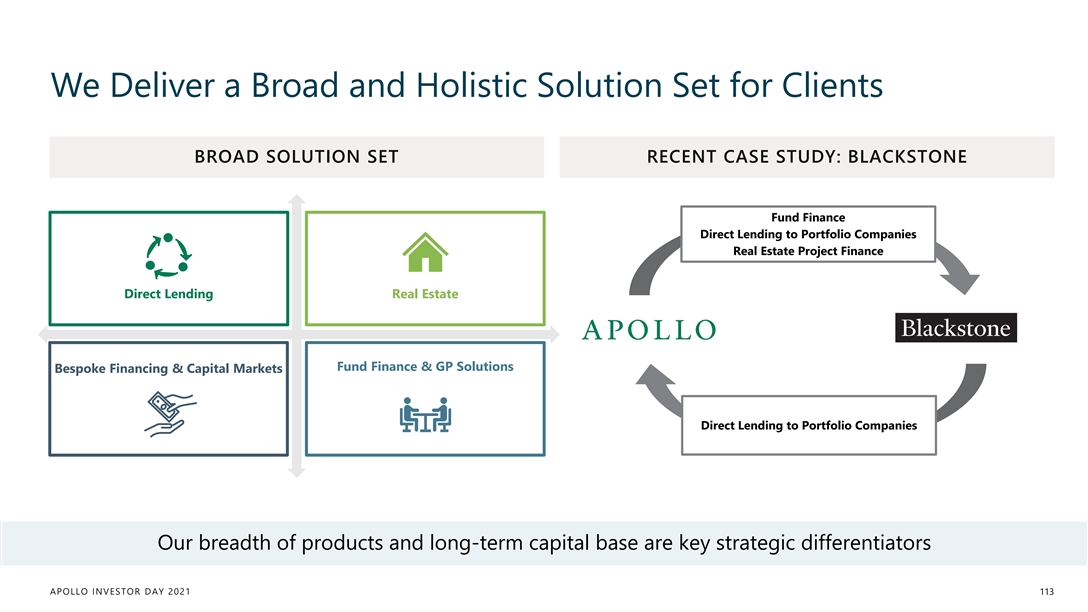
We Deliver a Broad and Holistic Solution Set for Clients BROAD SOLUTION SET RECENT CASE STUDY: BLACKSTONE Fund Finance Direct Lending to Portfolio Companies Real Estate Project Finance Direct Lending Real Estate Fund Finance & GP Solutions Bespoke Financing & Capital Markets Direct Lending to Portfolio Companies Our breadth of products and long-term capital base are key strategic differentiators APOLLO INVESTOR DAY 2021 113We Deliver a Broad and Holistic Solution Set for Clients BROAD SOLUTION SET RECENT CASE STUDY: BLACKSTONE Fund Finance Direct Lending to Portfolio Companies Real Estate Project Finance Direct Lending Real Estate Fund Finance & GP Solutions Bespoke Financing & Capital Markets Direct Lending to Portfolio Companies Our breadth of products and long-term capital base are key strategic differentiators APOLLO INVESTOR DAY 2021 113
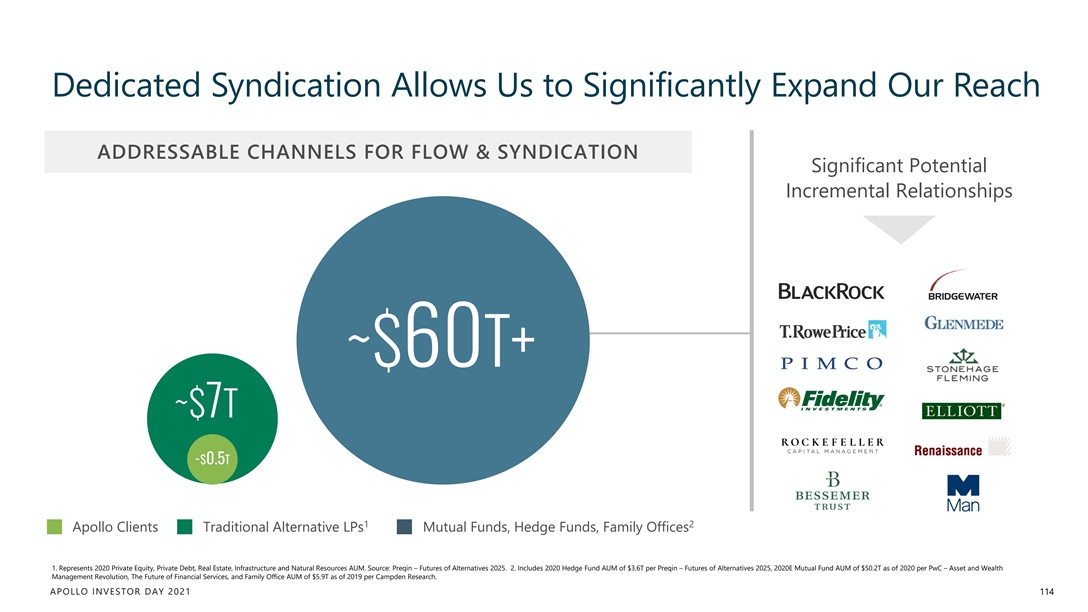
Dedicated Syndication Allows Us to Significantly Expand Our Reach ADDRESSABLE CHANNELS FOR FLOW & SYNDICATION Significant Potential Incremental Relationships ~$60T+ ~$7T ~$0.5T 1 2 Apollo Clients Traditional Alternative LPs Mutual Funds, Hedge Funds, Family Offices 1. Represents 2020 Private Equity, Private Debt, Real Estate, Infrastructure and Natural Resources AUM. Source: Preqin – Futures of Alternatives 2025. 2. Includes 2020 Hedge Fund AUM of $3.6T per Preqin – Futures of Alternatives 2025, 2020E Mutual Fund AUM of $50.2T as of 2020 per PwC – Asset and Wealth Management Revolution, The Future of Financial Services, and Family Office AUM of $5.9T as of 2019 per Campden Research. APOLLO INVESTOR DAY 2021 114
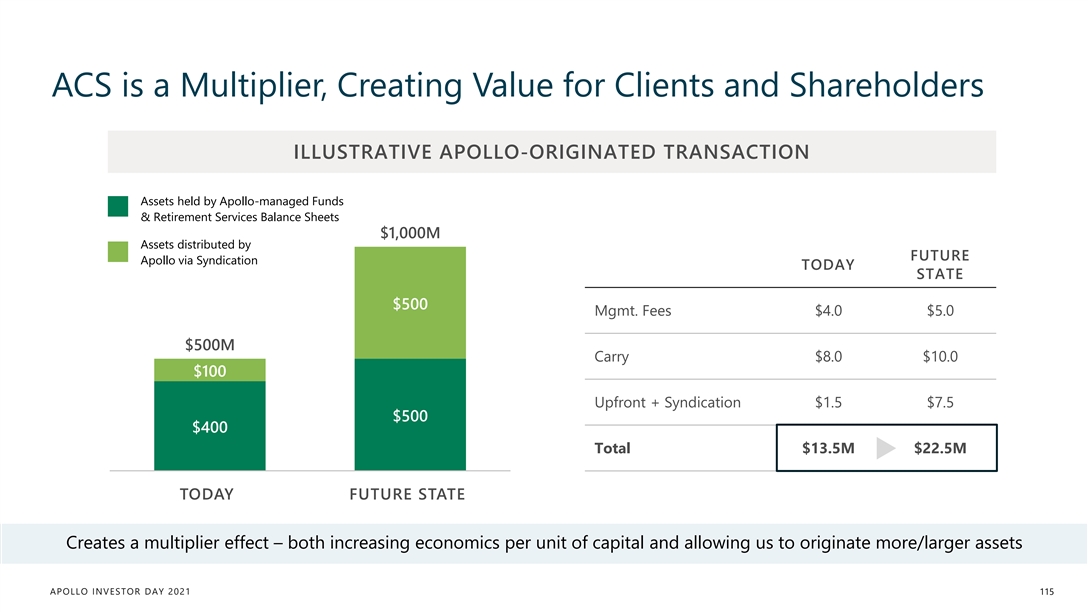
ACS is a Multiplier, Creating Value for Clients and Shareholders ILLUSTRATIVE APOLLO-ORIGINATED TRANSACTION Assets held by Apollo-managed Funds & Retirement Services Balance Sheets $1,000M Assets distributed by FUTURE Apollo via Syndication TODAY STATE $500 Mgmt. Fees $4.0 $5.0 $500M Carry $8.0 $10.0 $100 Upfront + Syndication $1.5 $7.5 $500 $400 Total $13.5M $22.5M TODAY FUTURE STATE Creates a multiplier effect – both increasing economics per unit of capital and allowing us to originate more/larger assets APOLLO INVESTOR DAY 2021 115ACS is a Multiplier, Creating Value for Clients and Shareholders ILLUSTRATIVE APOLLO-ORIGINATED TRANSACTION Assets held by Apollo-managed Funds & Retirement Services Balance Sheets $1,000M Assets distributed by FUTURE Apollo via Syndication TODAY STATE $500 Mgmt. Fees $4.0 $5.0 $500M Carry $8.0 $10.0 $100 Upfront + Syndication $1.5 $7.5 $500 $400 Total $13.5M $22.5M TODAY FUTURE STATE Creates a multiplier effect – both increasing economics per unit of capital and allowing us to originate more/larger assets APOLLO INVESTOR DAY 2021 115
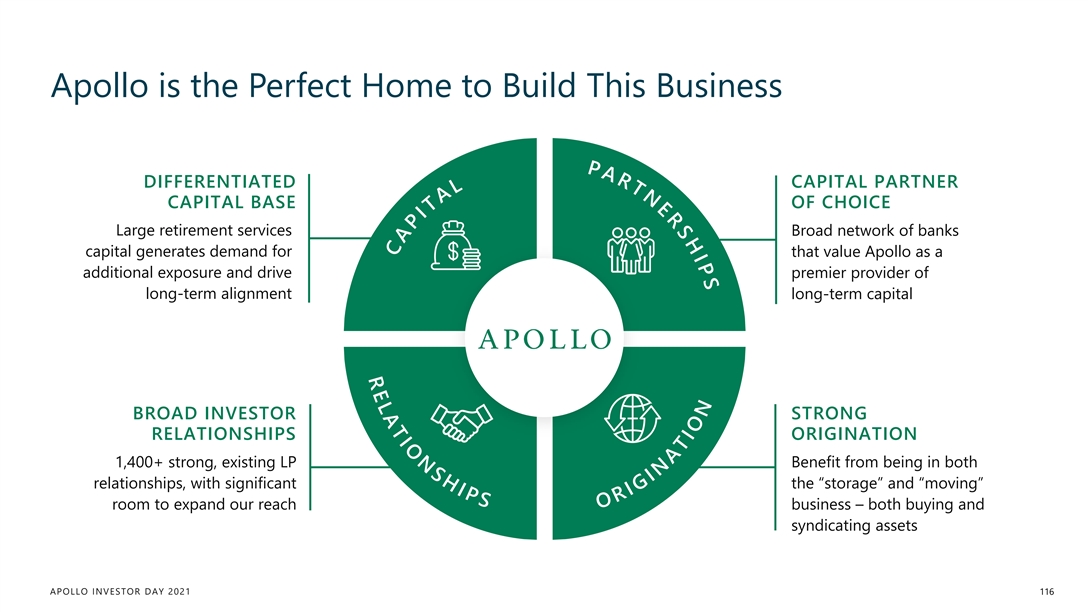
Apollo is the Perfect Home to Build This Business DIFFERENTIATED CAPITAL PARTNER CAPITAL BASE OF CHOICE Large retirement services Broad network of banks capital generates demand for that value Apollo as a additional exposure and drive premier provider of long-term alignment long-term capital BROAD INVESTOR STRONG RELATIONSHIPS ORIGINATION 1,400+ strong, existing LP Benefit from being in both relationships, with significant the “storage” and “moving” room to expand our reach business – both buying and syndicating assets APOLLO INVESTOR DAY 2021 116Apollo is the Perfect Home to Build This Business DIFFERENTIATED CAPITAL PARTNER CAPITAL BASE OF CHOICE Large retirement services Broad network of banks capital generates demand for that value Apollo as a additional exposure and drive premier provider of long-term alignment long-term capital BROAD INVESTOR STRONG RELATIONSHIPS ORIGINATION 1,400+ strong, existing LP Benefit from being in both relationships, with significant the “storage” and “moving” room to expand our reach business – both buying and syndicating assets APOLLO INVESTOR DAY 2021 116
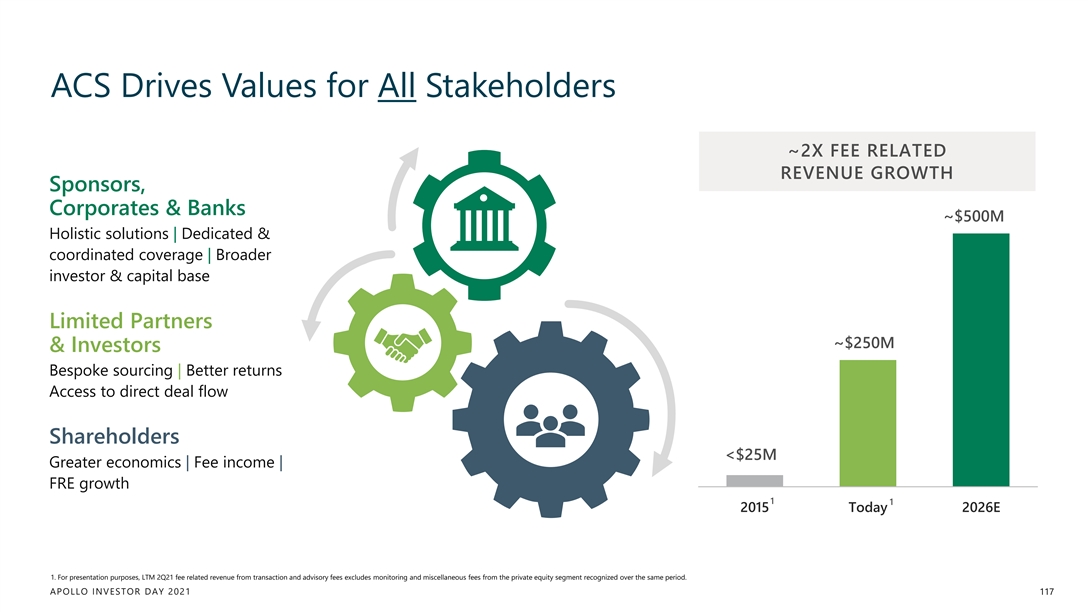
ACS Drives Values for All Stakeholders ~2X FEE RELATED REVENUE GROWTH Sponsors, Corporates & Banks ~$500M Holistic solutions | Dedicated & coordinated coverage | Broader investor & capital base Limited Partners ~$250M & Investors Bespoke sourcing | Better returns Access to direct deal flow Shareholders <$25M Greater economics | Fee income | FRE growth 1 1 2015 Today 2026E 1. For presentation purposes, LTM 2Q21 fee related revenue from transaction and advisory fees excludes monitoring and miscellaneous fees from the private equity segment recognized over the same period. APOLLO INVESTOR DAY 2021 117ACS Drives Values for All Stakeholders ~2X FEE RELATED REVENUE GROWTH Sponsors, Corporates & Banks ~$500M Holistic solutions | Dedicated & coordinated coverage | Broader investor & capital base Limited Partners ~$250M & Investors Bespoke sourcing | Better returns Access to direct deal flow Shareholders <$25M Greater economics | Fee income | FRE growth 1 1 2015 Today 2026E 1. For presentation purposes, LTM 2Q21 fee related revenue from transaction and advisory fees excludes monitoring and miscellaneous fees from the private equity segment recognized over the same period. APOLLO INVESTOR DAY 2021 117
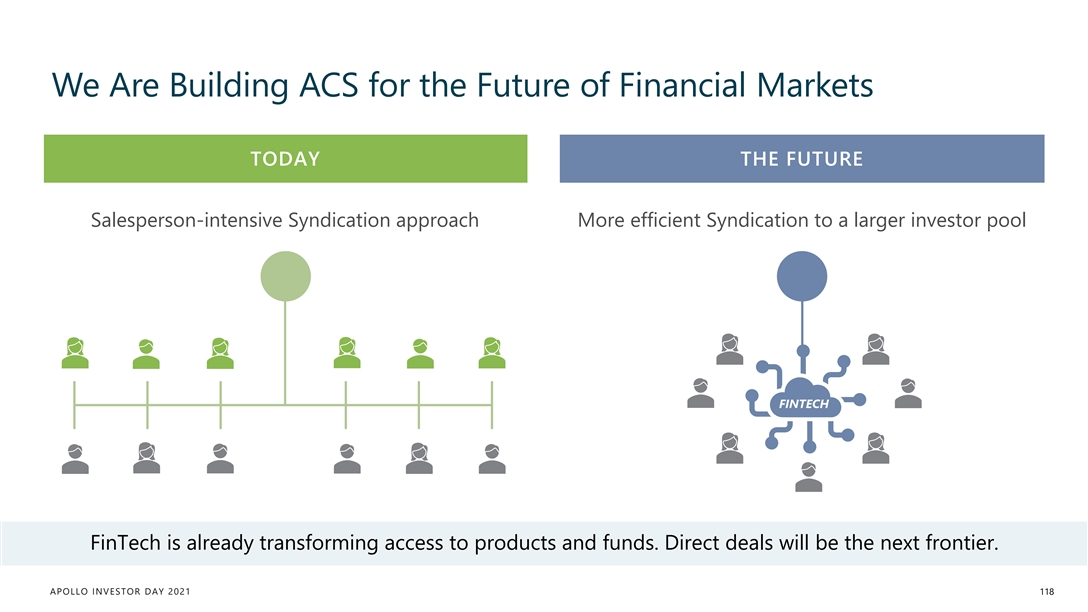
We Are Building ACS for the Future of Financial Markets TODAY THE FUTURE Salesperson-intensive Syndication approach More efficient Syndication to a larger investor pool FINTECH FinTech is already transforming access to products and funds. Direct deals will be the next frontier. APOLLO INVESTOR DAY 2021 118We Are Building ACS for the Future of Financial Markets TODAY THE FUTURE Salesperson-intensive Syndication approach More efficient Syndication to a larger investor pool FINTECH FinTech is already transforming access to products and funds. Direct deals will be the next frontier. APOLLO INVESTOR DAY 2021 118
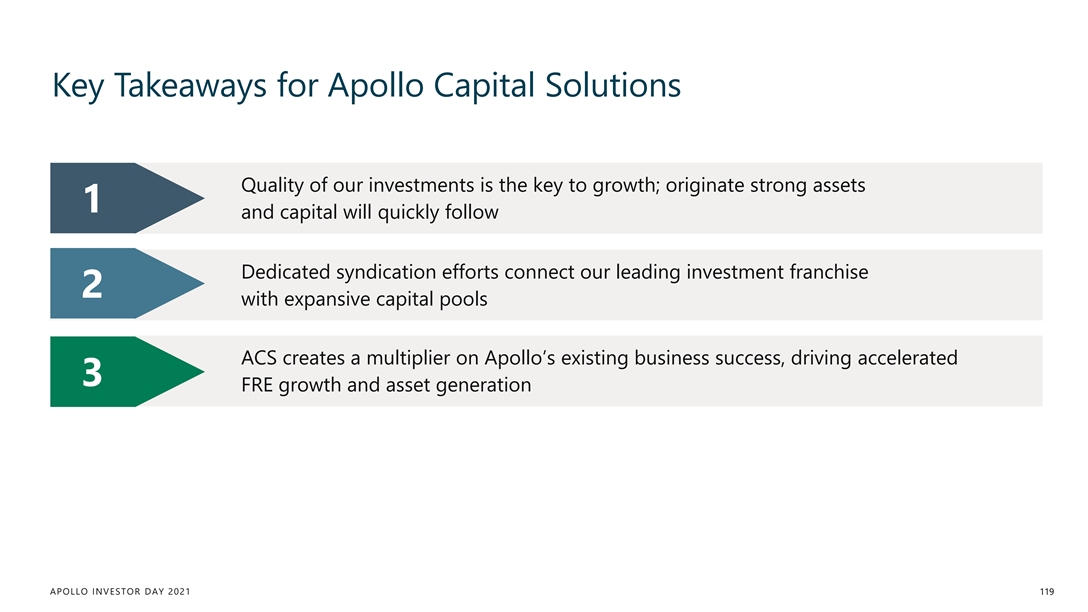
Key Takeaways for Apollo Capital Solutions Quality of our investments is the key to growth; originate strong assets 1 and capital will quickly follow Dedicated syndication efforts connect our leading investment franchise 2 with expansive capital pools ACS creates a multiplier on Apollo’s existing business success, driving accelerated 3 FRE growth and asset generation APOLLO INVESTOR DAY 2021 119Key Takeaways for Apollo Capital Solutions Quality of our investments is the key to growth; originate strong assets 1 and capital will quickly follow Dedicated syndication efforts connect our leading investment franchise 2 with expansive capital pools ACS creates a multiplier on Apollo’s existing business success, driving accelerated 3 FRE growth and asset generation APOLLO INVESTOR DAY 2021 119

Equity & Hybrid Overview SCOTT KLEINMAN Co-President APOLLO INVESTOR DAY 2021
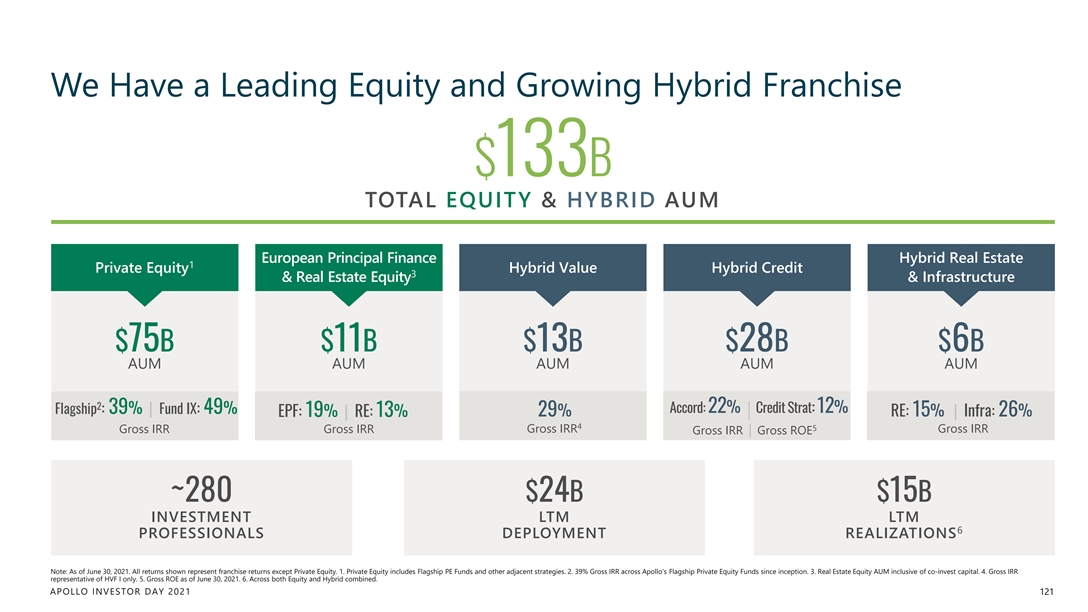
We Have a Leading Equity and Growing Hybrid Franchise $133B TOTAL EQUITY & HYBRID AUM European Principal Finance Hybrid Real Estate 1 Private Equity Hybrid Value Hybrid Credit 3 & Real Estate Equity & Infrastructure $75B $11B $13B $28B $6B AUM AUM AUM AUM AUM 2 Accord: 22% Credit Strat: 12% Flagship : 39% | Fund IX: 49% EPF: 19% | RE: 13% 29% RE: 15% | Infra: 26% 4 5 Gross IRR Gross IRR Gross IRR Gross IRR Gross IRR | Gross ROE ~280 $24B $15B INVESTMENT LTM LTM 6 PROFESSIONALS DEPLOYMENT REALIZATIONS Note: As of June 30, 2021. All returns shown represent franchise returns except Private Equity. 1. Private Equity includes Flagship PE Funds and other adjacent strategies. 2. 39% Gross IRR across Apollo’s Flagship Private Equity Funds since inception. 3. Real Estate Equity AUM inclusive of co-invest capital. 4. Gross IRR representative of HVF I only. 5. Gross ROE as of June 30, 2021. 6. Across both Equity and Hybrid combined. APOLLO INVESTOR DAY 2021 121We Have a Leading Equity and Growing Hybrid Franchise $133B TOTAL EQUITY & HYBRID AUM European Principal Finance Hybrid Real Estate 1 Private Equity Hybrid Value Hybrid Credit 3 & Real Estate Equity & Infrastructure $75B $11B $13B $28B $6B AUM AUM AUM AUM AUM 2 Accord: 22% Credit Strat: 12% Flagship : 39% | Fund IX: 49% EPF: 19% | RE: 13% 29% RE: 15% | Infra: 26% 4 5 Gross IRR Gross IRR Gross IRR Gross IRR Gross IRR | Gross ROE ~280 $24B $15B INVESTMENT LTM LTM 6 PROFESSIONALS DEPLOYMENT REALIZATIONS Note: As of June 30, 2021. All returns shown represent franchise returns except Private Equity. 1. Private Equity includes Flagship PE Funds and other adjacent strategies. 2. 39% Gross IRR across Apollo’s Flagship Private Equity Funds since inception. 3. Real Estate Equity AUM inclusive of co-invest capital. 4. Gross IRR representative of HVF I only. 5. Gross ROE as of June 30, 2021. 6. Across both Equity and Hybrid combined. APOLLO INVESTOR DAY 2021 121
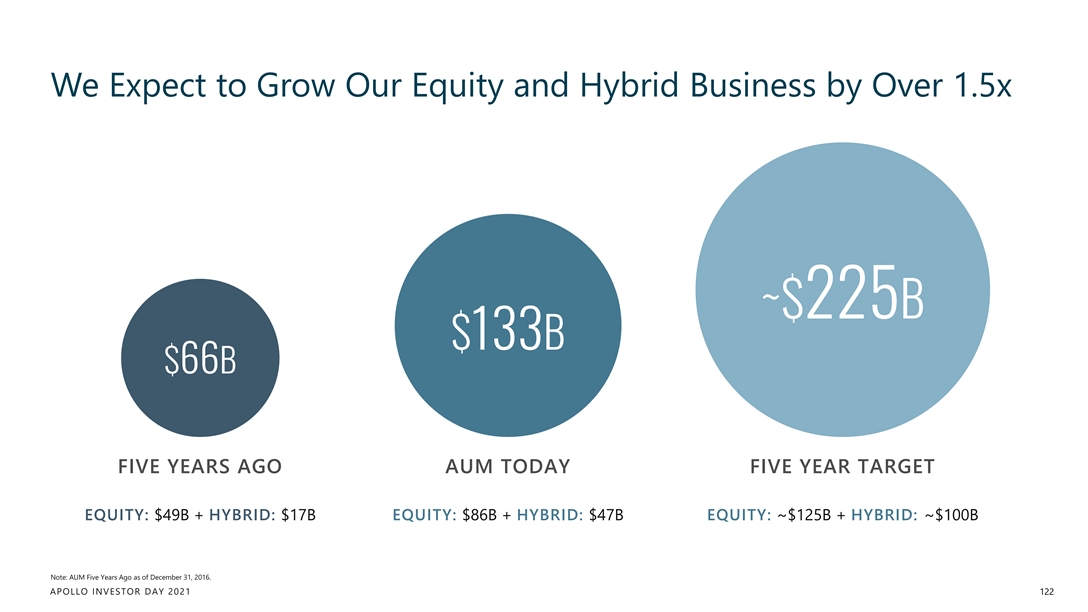
We Expect to Grow Our Equity and Hybrid Business by Over 1.5x ~$225B $133B $66B FIVE YEARS AGO AUM TODAY FIVE YEAR TARGET EQUITY: $49B + HYBRID: $17B EQUITY: $86B + HYBRID: $47B EQUITY: ~$125B + HYBRID: ~$100B Note: AUM Five Years Ago as of December 31, 2016. APOLLO INVESTOR DAY 2021 122
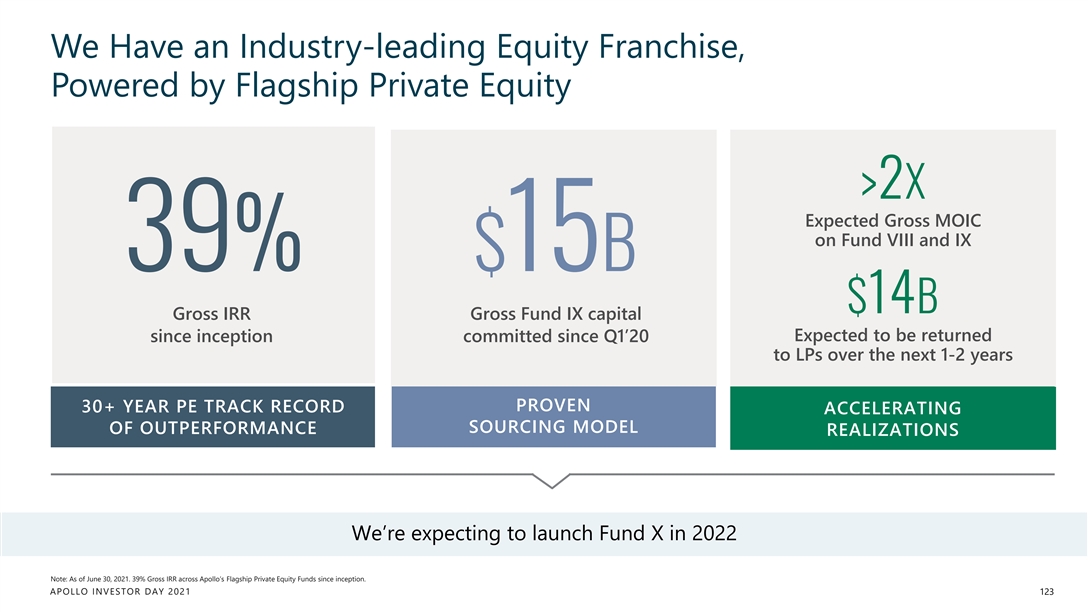
We Have an Industry-leading Equity Franchise, Powered by Flagship Private Equity >2X Expected Gross MOIC on Fund VIII and IX 39% $15B $14B Gross IRR Gross Fund IX capital Expected to be returned since inception committed since Q1’20 to LPs over the next 1-2 years PROVEN 30+ YEAR PE TRACK RECORD ACCELERATING SOURCING MODEL OF OUTPERFORMANCE REALIZATIONS We’re expecting to launch Fund X in 2022 Note: As of June 30, 2021. 39% Gross IRR across Apollo’s Flagship Private Equity Funds since inception. APOLLO INVESTOR DAY 2021 123We Have an Industry-leading Equity Franchise, Powered by Flagship Private Equity >2X Expected Gross MOIC on Fund VIII and IX 39% $15B $14B Gross IRR Gross Fund IX capital Expected to be returned since inception committed since Q1’20 to LPs over the next 1-2 years PROVEN 30+ YEAR PE TRACK RECORD ACCELERATING SOURCING MODEL OF OUTPERFORMANCE REALIZATIONS We’re expecting to launch Fund X in 2022 Note: As of June 30, 2021. 39% Gross IRR across Apollo’s Flagship Private Equity Funds since inception. APOLLO INVESTOR DAY 2021 123
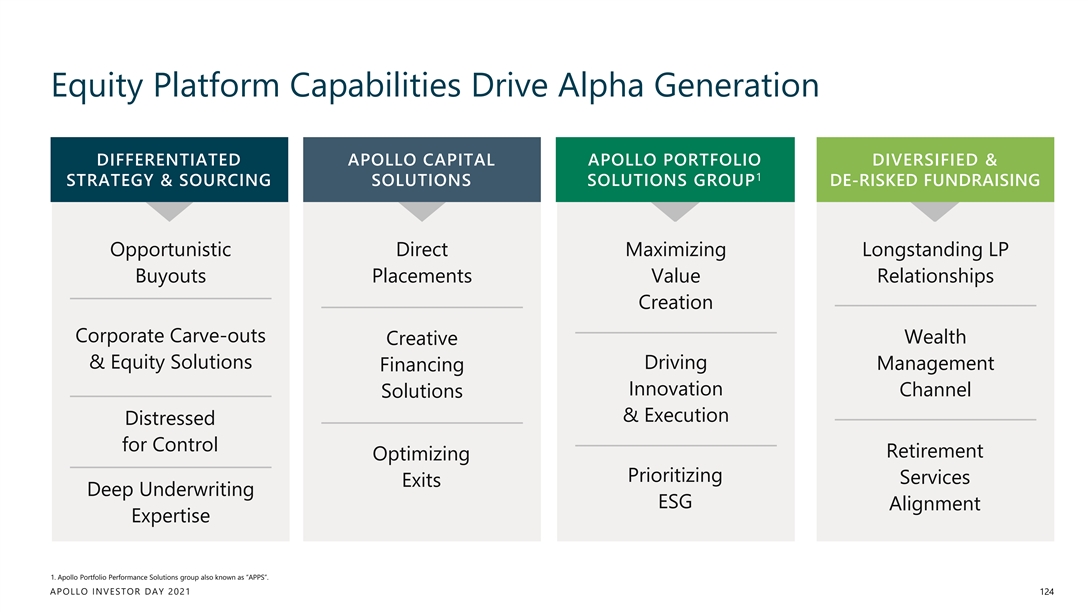
Equity Platform Capabilities Drive Alpha Generation DIFFERENTIATED APOLLO CAPITAL APOLLO PORTFOLIO DIVERSIFIED & 1 STRATEGY & SOURCING SOLUTIONS SOLUTIONS GROUP DE-RISKED FUNDRAISING Opportunistic Direct Maximizing Longstanding LP Buyouts Placements Value Relationships Creation Corporate Carve-outs Wealth Creative & Equity Solutions Driving Management Financing Innovation Channel Solutions & Execution Distressed for Control Retirement Optimizing Prioritizing Services Exits Deep Underwriting ESG Alignment Expertise 1. Apollo Portfolio Performance Solutions group also known as “APPS”. APOLLO INVESTOR DAY 2021 124Equity Platform Capabilities Drive Alpha Generation DIFFERENTIATED APOLLO CAPITAL APOLLO PORTFOLIO DIVERSIFIED & 1 STRATEGY & SOURCING SOLUTIONS SOLUTIONS GROUP DE-RISKED FUNDRAISING Opportunistic Direct Maximizing Longstanding LP Buyouts Placements Value Relationships Creation Corporate Carve-outs Wealth Creative & Equity Solutions Driving Management Financing Innovation Channel Solutions & Execution Distressed for Control Retirement Optimizing Prioritizing Services Exits Deep Underwriting ESG Alignment Expertise 1. Apollo Portfolio Performance Solutions group also known as “APPS”. APOLLO INVESTOR DAY 2021 124
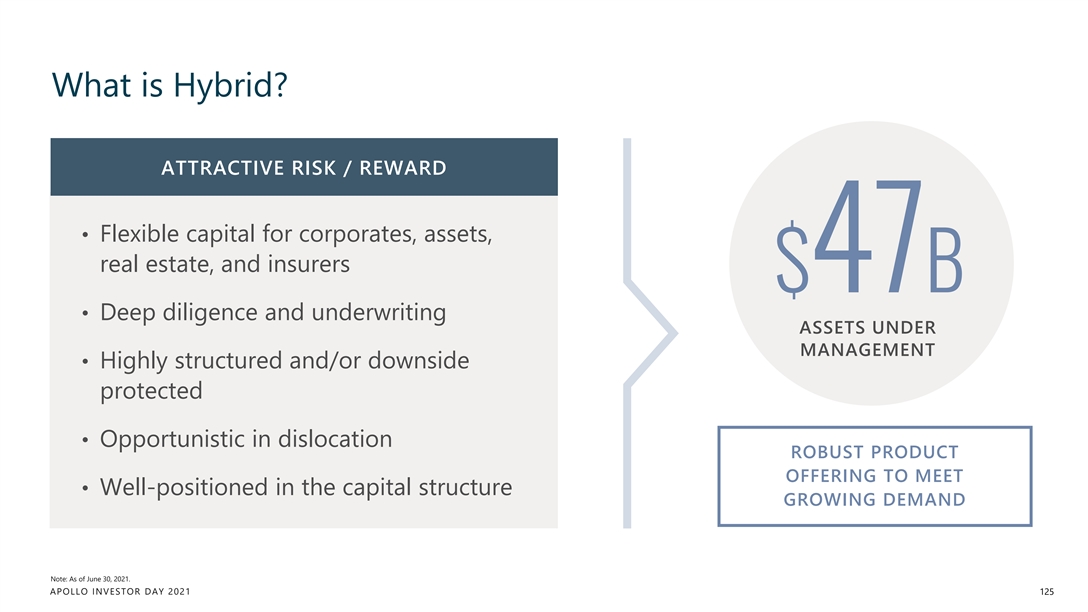
What is Hybrid? ATTRACTIVE RISK / REWARD • Flexible capital for corporates, assets, real estate, and insurers $47B • Deep diligence and underwriting ASSETS UNDER MANAGEMENT • Highly structured and/or downside protected • Opportunistic in dislocation ROBUST PRODUCT OFFERING TO MEET • Well-positioned in the capital structure GROWING DEMAND Note: As of June 30, 2021. APOLLO INVESTOR DAY 2021 125What is Hybrid? ATTRACTIVE RISK / REWARD • Flexible capital for corporates, assets, real estate, and insurers $47B • Deep diligence and underwriting ASSETS UNDER MANAGEMENT • Highly structured and/or downside protected • Opportunistic in dislocation ROBUST PRODUCT OFFERING TO MEET • Well-positioned in the capital structure GROWING DEMAND Note: As of June 30, 2021. APOLLO INVESTOR DAY 2021 125
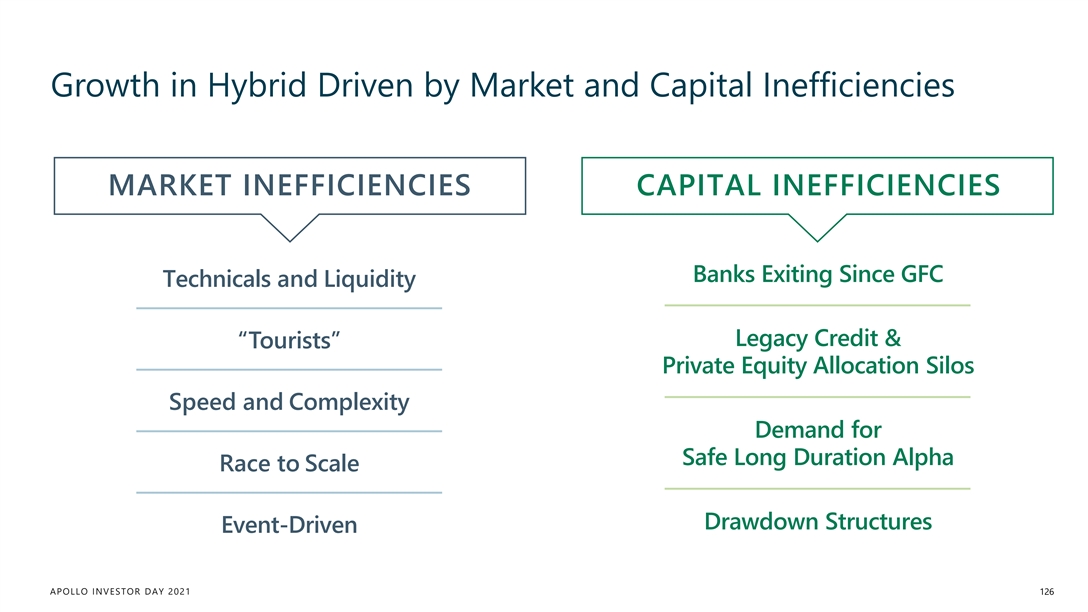
Growth in Hybrid Driven by Market and Capital Inefficiencies MARKET INEFFICIENCIES CAPITAL INEFFICIENCIES Banks Exiting Since GFC Technicals and Liquidity Legacy Credit & “Tourists” Private Equity Allocation Silos Speed and Complexity Demand for Safe Long Duration Alpha Race to Scale Drawdown Structures Event-Driven APOLLO INVESTOR DAY 2021 126Growth in Hybrid Driven by Market and Capital Inefficiencies MARKET INEFFICIENCIES CAPITAL INEFFICIENCIES Banks Exiting Since GFC Technicals and Liquidity Legacy Credit & “Tourists” Private Equity Allocation Silos Speed and Complexity Demand for Safe Long Duration Alpha Race to Scale Drawdown Structures Event-Driven APOLLO INVESTOR DAY 2021 126
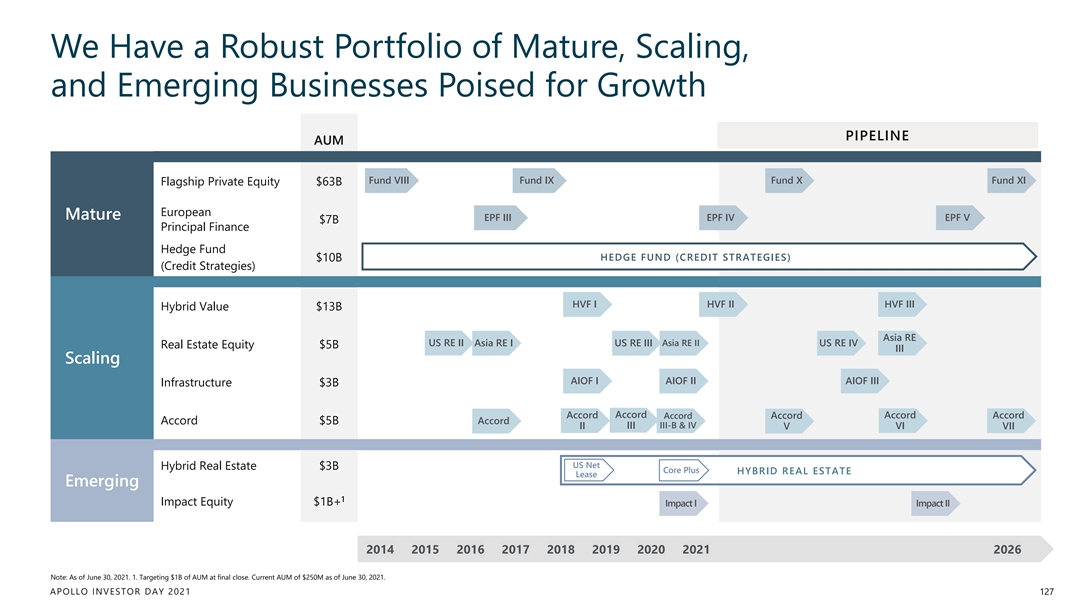
We Have a Robust Portfolio of Mature, Scaling, and Emerging Businesses Poised for Growth PIPELINE AUM Fund VIII Fund IX Fund X Fund XI Flagship Private Equity $63B European Mature EPF III EPF IV EPF V $7B Principal Finance Hedge Fund HEDGE FUND (CREDIT STRATEGIES) $10B (Credit Strategies) HVF I HVF II HVF III Hybrid Value $13B Asia RE US RE II Asia RE I US RE III Asia RE II US RE IV Real Estate Equity $5B III Scaling AIOF I AIOF II AIOF III Infrastructure $3B Accord Accord Accord Accord Accord Accord Accord Accord $5B II III III-B & IV VI VII V US Net Hybrid Real Estate $3B Core Plus HYBRID REAL ESTATE Lease Emerging 1 Impact Equity $1B+ Impact I Impact II 2014 2015 2016 2017 2018 2019 2020 2021 2026 Note: As of June 30, 2021. 1. Targeting $1B of AUM at final close. Current AUM of $250M as of June 30, 2021. APOLLO INVESTOR DAY 2021 127We Have a Robust Portfolio of Mature, Scaling, and Emerging Businesses Poised for Growth PIPELINE AUM Fund VIII Fund IX Fund X Fund XI Flagship Private Equity $63B European Mature EPF III EPF IV EPF V $7B Principal Finance Hedge Fund HEDGE FUND (CREDIT STRATEGIES) $10B (Credit Strategies) HVF I HVF II HVF III Hybrid Value $13B Asia RE US RE II Asia RE I US RE III Asia RE II US RE IV Real Estate Equity $5B III Scaling AIOF I AIOF II AIOF III Infrastructure $3B Accord Accord Accord Accord Accord Accord Accord Accord $5B II III III-B & IV VI VII V US Net Hybrid Real Estate $3B Core Plus HYBRID REAL ESTATE Lease Emerging 1 Impact Equity $1B+ Impact I Impact II 2014 2015 2016 2017 2018 2019 2020 2021 2026 Note: As of June 30, 2021. 1. Targeting $1B of AUM at final close. Current AUM of $250M as of June 30, 2021. APOLLO INVESTOR DAY 2021 127
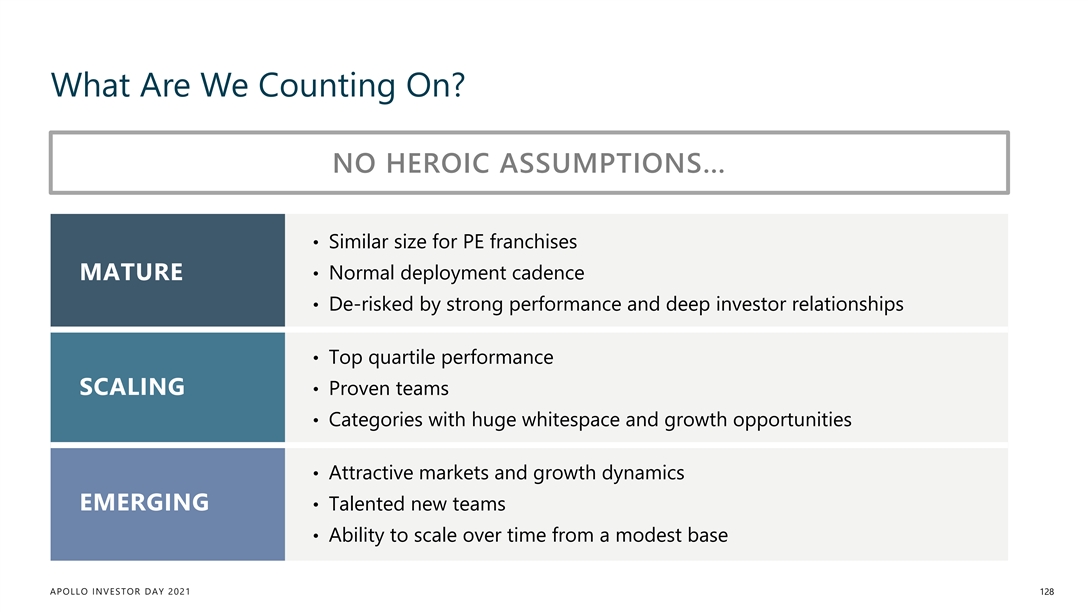
What Are We Counting On? NO HEROIC ASSUMPTIONS… • Similar size for PE franchises MATURE • Normal deployment cadence • De-risked by strong performance and deep investor relationships • Top quartile performance SCALING • Proven teams • Categories with huge whitespace and growth opportunities • Attractive markets and growth dynamics EMERGING • Talented new teams • Ability to scale over time from a modest base APOLLO INVESTOR DAY 2021 128What Are We Counting On? NO HEROIC ASSUMPTIONS… • Similar size for PE franchises MATURE • Normal deployment cadence • De-risked by strong performance and deep investor relationships • Top quartile performance SCALING • Proven teams • Categories with huge whitespace and growth opportunities • Attractive markets and growth dynamics EMERGING • Talented new teams • Ability to scale over time from a modest base APOLLO INVESTOR DAY 2021 128
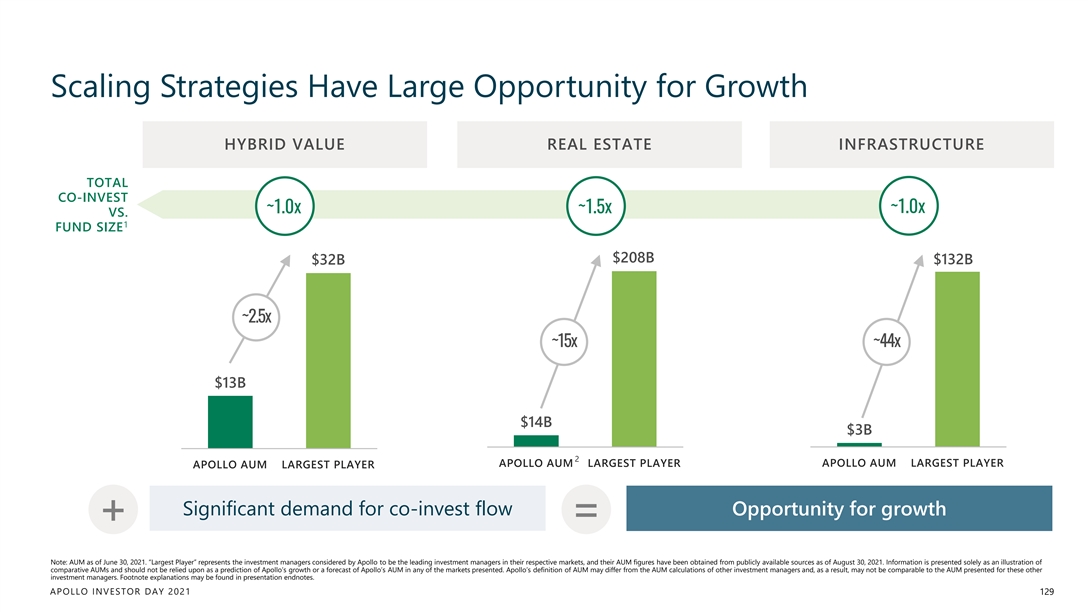
Scaling Strategies Have Large Opportunity for Growth HYBRID VALUE REAL ESTATE INFRASTRUCTURE TOTAL CO-INVEST ~1.0x ~1.5x ~1.0x VS. 1 FUND SIZE $208B $132B $32B ~2.5x ~15x ~44x $13B $14B $3B 2 APOLLO AUM LARGEST PLAYER APOLLO AUM LARGEST PLAYER APOLLO AUM LARGEST PLAYER Significant demand for co-invest flow Opportunity for growth + = Note: AUM as of June 30, 2021. “Largest Player” represents the investment managers considered by Apollo to be the leading investment managers in their respective markets, and their AUM figures have been obtained from publicly available sources as of August 30, 2021. Information is presented solely as an illustration of comparative AUMs and should not be relied upon as a prediction of Apollo’s growth or a forecast of Apollo’s AUM in any of the markets presented. Apollo’s definition of AUM may differ from the AUM calculations of other investment managers and, as a result, may not be comparable to the AUM presented for these other investment managers. Footnote explanations may be found in presentation endnotes. APOLLO INVESTOR DAY 2021 129Scaling Strategies Have Large Opportunity for Growth HYBRID VALUE REAL ESTATE INFRASTRUCTURE TOTAL CO-INVEST ~1.0x ~1.5x ~1.0x VS. 1 FUND SIZE $208B $132B $32B ~2.5x ~15x ~44x $13B $14B $3B 2 APOLLO AUM LARGEST PLAYER APOLLO AUM LARGEST PLAYER APOLLO AUM LARGEST PLAYER Significant demand for co-invest flow Opportunity for growth + = Note: AUM as of June 30, 2021. “Largest Player” represents the investment managers considered by Apollo to be the leading investment managers in their respective markets, and their AUM figures have been obtained from publicly available sources as of August 30, 2021. Information is presented solely as an illustration of comparative AUMs and should not be relied upon as a prediction of Apollo’s growth or a forecast of Apollo’s AUM in any of the markets presented. Apollo’s definition of AUM may differ from the AUM calculations of other investment managers and, as a result, may not be comparable to the AUM presented for these other investment managers. Footnote explanations may be found in presentation endnotes. APOLLO INVESTOR DAY 2021 129
We Have De-Risked Our Ability to Scale Rapidly and Successfully BEST-IN-CLASS STRONG PERFORMANCE FOCUS ON TEAM INVESTMENT TRACK RECORD MODERNIZATION PHILOSOPHY PROVEN PLATFORM ENSURES SUCCESS APOLLO INVESTOR DAY 2021 130We Have De-Risked Our Ability to Scale Rapidly and Successfully BEST-IN-CLASS STRONG PERFORMANCE FOCUS ON TEAM INVESTMENT TRACK RECORD MODERNIZATION PHILOSOPHY PROVEN PLATFORM ENSURES SUCCESS APOLLO INVESTOR DAY 2021 130
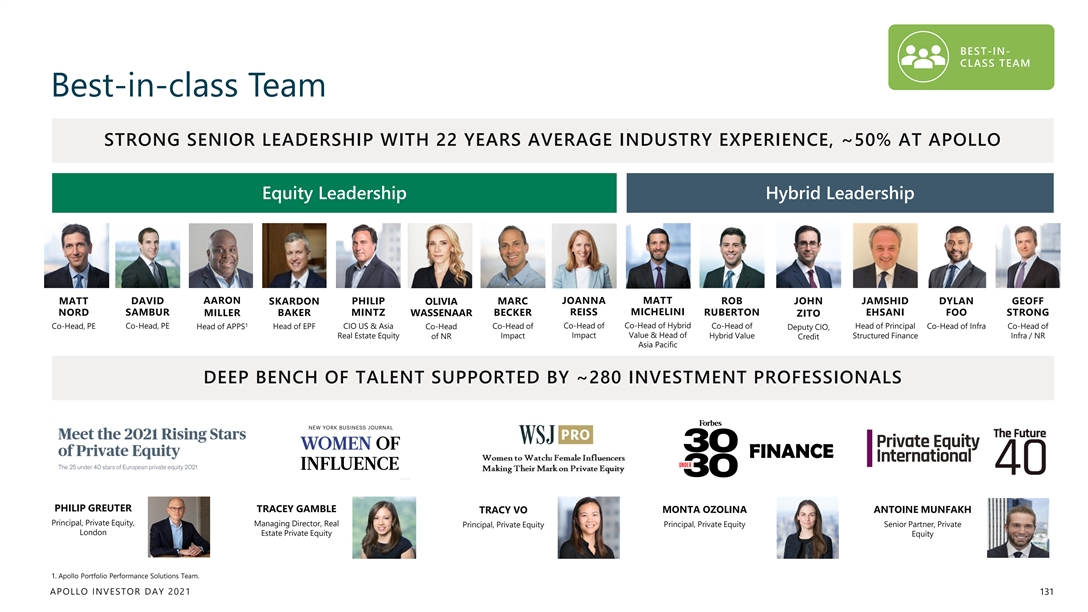
BEST-IN- CLASS TEAM Best-in-class Team STRONG SENIOR LEADERSHIP WITH 22 YEARS AVERAGE INDUSTRY EXPERIENCE, ~50% AT APOLLO Equity Leadership Hybrid Leadership MATT DAVID AARON PHILIP MARC JOANNA MATT ROB JOHN JAMSHID DYLAN GEOFF SKARDON OLIVIA REISS MICHELINI NORD SAMBUR MILLER BAKER MINTZ WASSENAAR BECKER RUBERTON EHSANI FOO STRONG ZITO 1 Co-Head of Hybrid Co-Head, PE Co-Head, PE Head of APPS Head of EPF CIO US & Asia Co-Head Co-Head of Co-Head of Co-Head of Head of Principal Co-Head of Infra Co-Head of Deputy CIO, Impact Value & Head of Hybrid Value Structured Finance Infra / NR Real Estate Equity of NR Impact Credit Asia Pacific DEEP BENCH OF TALENT SUPPORTED BY ~280 INVESTMENT PROFESSIONALS FINANCE PHILIP GREUTER TRACEY GAMBLE TRACY VO MONTA OZOLINA ANTOINE MUNFAKH Principal, Private Equity, Managing Director, Real Principal, Private Equity Principal, Private Equity Senior Partner, Private London Estate Private Equity Equity 1. Apollo Portfolio Performance Solutions Team. APOLLO INVESTOR DAY 2021 131BEST-IN- CLASS TEAM Best-in-class Team STRONG SENIOR LEADERSHIP WITH 22 YEARS AVERAGE INDUSTRY EXPERIENCE, ~50% AT APOLLO Equity Leadership Hybrid Leadership MATT DAVID AARON PHILIP MARC JOANNA MATT ROB JOHN JAMSHID DYLAN GEOFF SKARDON OLIVIA REISS MICHELINI NORD SAMBUR MILLER BAKER MINTZ WASSENAAR BECKER RUBERTON EHSANI FOO STRONG ZITO 1 Co-Head of Hybrid Co-Head, PE Co-Head, PE Head of APPS Head of EPF CIO US & Asia Co-Head Co-Head of Co-Head of Co-Head of Head of Principal Co-Head of Infra Co-Head of Deputy CIO, Impact Value & Head of Hybrid Value Structured Finance Infra / NR Real Estate Equity of NR Impact Credit Asia Pacific DEEP BENCH OF TALENT SUPPORTED BY ~280 INVESTMENT PROFESSIONALS FINANCE PHILIP GREUTER TRACEY GAMBLE TRACY VO MONTA OZOLINA ANTOINE MUNFAKH Principal, Private Equity, Managing Director, Real Principal, Private Equity Principal, Private Equity Senior Partner, Private London Estate Private Equity Equity 1. Apollo Portfolio Performance Solutions Team. APOLLO INVESTOR DAY 2021 131
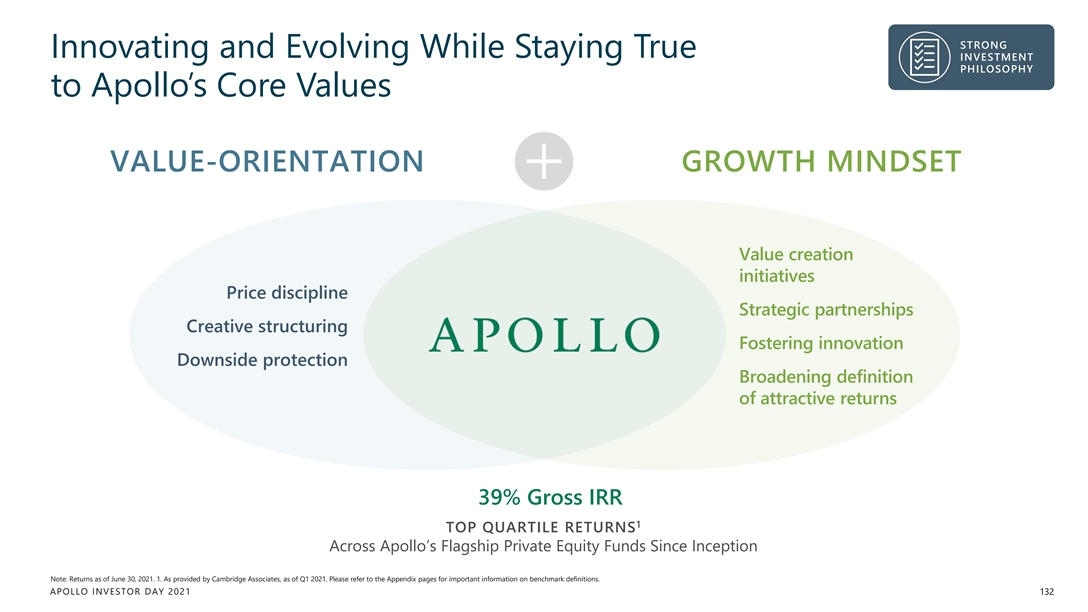
STRONG Innovating and Evolving While Staying True INVESTMENT PHILOSOPHY to Apollo’s Core Values VALUE-ORIENTATION GROWTH MINDSET Value creation initiatives Price discipline Strategic partnerships Creative structuring Fostering innovation Downside protection Broadening definition of attractive returns 39% Gross IRR 1 TOP QUARTILE RETURNS Across Apollo’s Flagship Private Equity Funds Since Inception Note: Returns as of June 30, 2021. 1. As provided by Cambridge Associates, as of Q1 2021. Please refer to the Appendix pages for important information on benchmark definitions. APOLLO INVESTOR DAY 2021 132STRONG Innovating and Evolving While Staying True INVESTMENT PHILOSOPHY to Apollo’s Core Values VALUE-ORIENTATION GROWTH MINDSET Value creation initiatives Price discipline Strategic partnerships Creative structuring Fostering innovation Downside protection Broadening definition of attractive returns 39% Gross IRR 1 TOP QUARTILE RETURNS Across Apollo’s Flagship Private Equity Funds Since Inception Note: Returns as of June 30, 2021. 1. As provided by Cambridge Associates, as of Q1 2021. Please refer to the Appendix pages for important information on benchmark definitions. APOLLO INVESTOR DAY 2021 132
STRONG INVESTMENT PHILOSOPHY Powered by Our Integrated Platform INTEGRATED PLATFORM BENEFITS EQUITY Collaborative Culture HYBRID Institutional Expertise YIELD One-Firm Mindset APOLLO INVESTOR DAY 2021 133
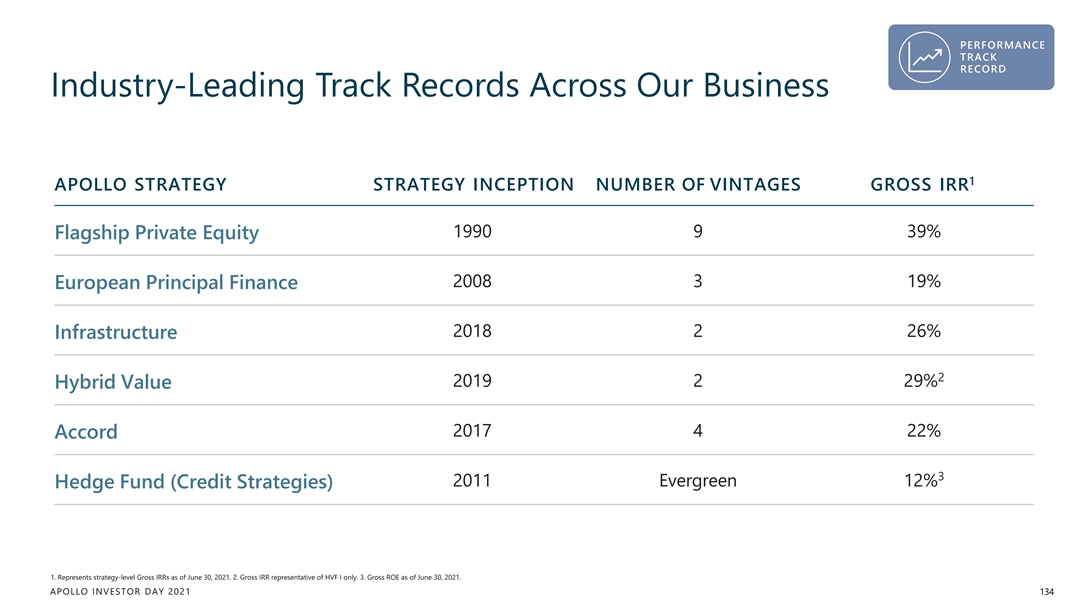
PERFORMANCE TRACK RECORD Industry-Leading Track Records Across Our Business 1 APOLLO STRATEGY STRATEGY INCEPTION NUMBER OF VINTAGES GROSS IRR 1990 9 39% Flagship Private Equity 2008 3 19% European Principal Finance 2018 2 26% Infrastructure 2 2019 2 29% Hybrid Value 2017 4 22% Accord 3 2011 Evergreen 12% Hedge Fund (Credit Strategies) 1. Represents strategy-level Gross IRRs as of June 30, 2021. 2. Gross IRR representative of HVF I only. 3. Gross ROE as of June 30, 2021. APOLLO INVESTOR DAY 2021 134PERFORMANCE TRACK RECORD Industry-Leading Track Records Across Our Business 1 APOLLO STRATEGY STRATEGY INCEPTION NUMBER OF VINTAGES GROSS IRR 1990 9 39% Flagship Private Equity 2008 3 19% European Principal Finance 2018 2 26% Infrastructure 2 2019 2 29% Hybrid Value 2017 4 22% Accord 3 2011 Evergreen 12% Hedge Fund (Credit Strategies) 1. Represents strategy-level Gross IRRs as of June 30, 2021. 2. Gross IRR representative of HVF I only. 3. Gross ROE as of June 30, 2021. APOLLO INVESTOR DAY 2021 134
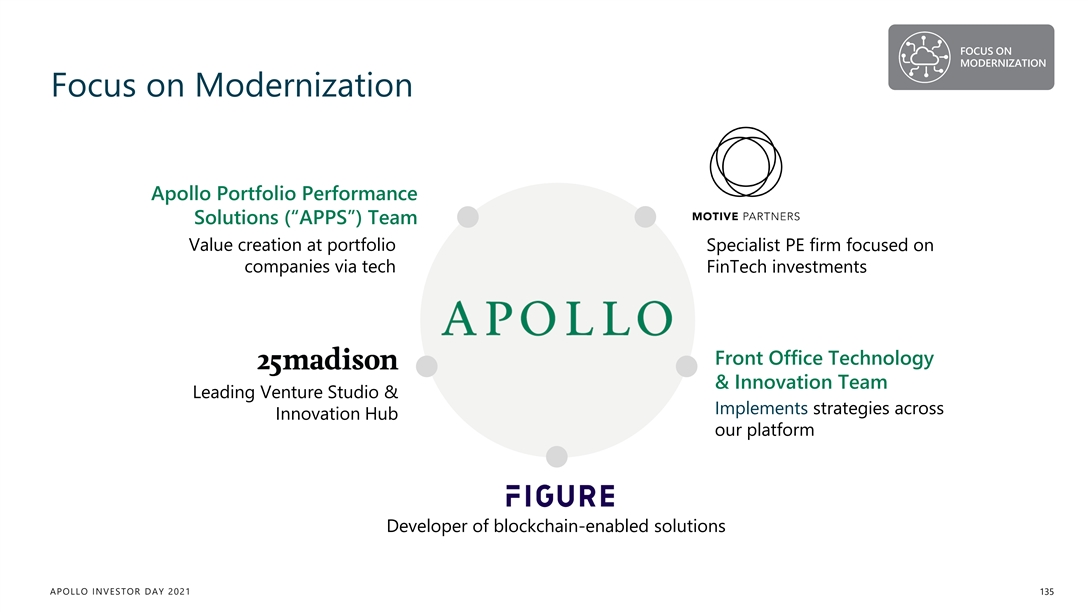
FOCUS ON MODERNIZATION Focus on Modernization Apollo Portfolio Performance Solutions (“APPS”) Team Value creation at portfolio Specialist PE firm focused on companies via tech FinTech investments Front Office Technology & Innovation Team Leading Venture Studio & Implements strategies across Innovation Hub our platform Developer of blockchain-enabled solutions APOLLO INVESTOR DAY 2021 135FOCUS ON MODERNIZATION Focus on Modernization Apollo Portfolio Performance Solutions (“APPS”) Team Value creation at portfolio Specialist PE firm focused on companies via tech FinTech investments Front Office Technology & Innovation Team Leading Venture Studio & Implements strategies across Innovation Hub our platform Developer of blockchain-enabled solutions APOLLO INVESTOR DAY 2021 135
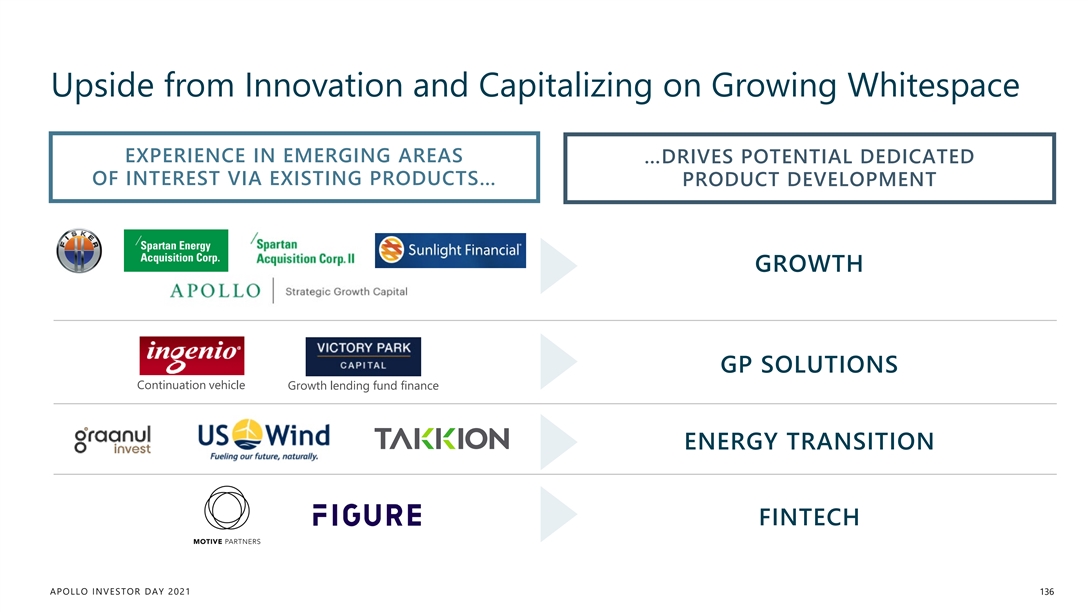
Upside from Innovation and Capitalizing on Growing Whitespace EXPERIENCE IN EMERGING AREAS …DRIVES POTENTIAL DEDICATED OF INTEREST VIA EXISTING PRODUCTS… PRODUCT DEVELOPMENT GROWTH GP SOLUTIONS Continuation vehicle Growth lending fund finance ENERGY TRANSITION FINTECH APOLLO INVESTOR DAY 2021 136Upside from Innovation and Capitalizing on Growing Whitespace EXPERIENCE IN EMERGING AREAS …DRIVES POTENTIAL DEDICATED OF INTEREST VIA EXISTING PRODUCTS… PRODUCT DEVELOPMENT GROWTH GP SOLUTIONS Continuation vehicle Growth lending fund finance ENERGY TRANSITION FINTECH APOLLO INVESTOR DAY 2021 136
Key Takeaways for Our Equity & Hybrid Business NO BIG ASSUMPTIONS… Maintaining an industry-leading position in mature franchises and Flagship Private Equity 1 Significant growth opportunity for scaling strategies, especially in Hybrid 2 Upside from whitespace opportunities 3 APOLLO INVESTOR DAY 2021 137Key Takeaways for Our Equity & Hybrid Business NO BIG ASSUMPTIONS… Maintaining an industry-leading position in mature franchises and Flagship Private Equity 1 Significant growth opportunity for scaling strategies, especially in Hybrid 2 Upside from whitespace opportunities 3 APOLLO INVESTOR DAY 2021 137

Retirement Services Overview SCOTT KLEINMAN Co-President APOLLO INVESTOR DAY 2021Retirement Services Overview SCOTT KLEINMAN Co-President APOLLO INVESTOR DAY 2021
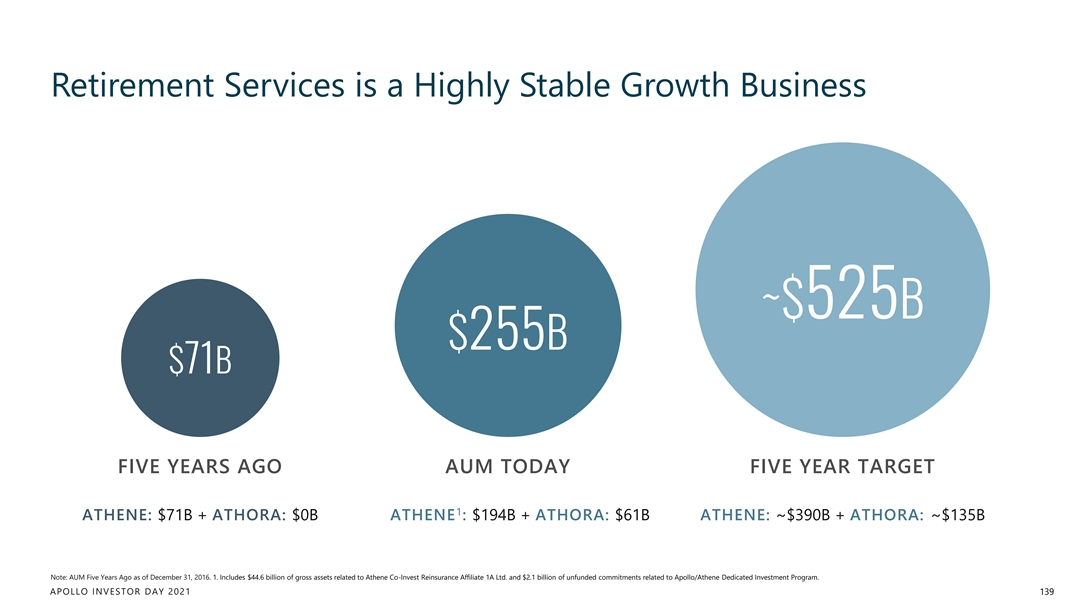
Retirement Services is a Highly Stable Growth Business ~$525B $255B $71B FIVE YEARS AGO AUM TODAY FIVE YEAR TARGET 1 ATHENE: $71B + ATHORA: $0B ATHENE : $194B + ATHORA: $61B ATHENE: ~$390B + ATHORA: ~$135B Note: AUM Five Years Ago as of December 31, 2016. 1. Includes $44.6 billion of gross assets related to Athene Co-Invest Reinsurance Affiliate 1A Ltd. and $2.1 billion of unfunded commitments related to Apollo/Athene Dedicated Investment Program. APOLLO INVESTOR DAY 2021 139Retirement Services is a Highly Stable Growth Business ~$525B $255B $71B FIVE YEARS AGO AUM TODAY FIVE YEAR TARGET 1 ATHENE: $71B + ATHORA: $0B ATHENE : $194B + ATHORA: $61B ATHENE: ~$390B + ATHORA: ~$135B Note: AUM Five Years Ago as of December 31, 2016. 1. Includes $44.6 billion of gross assets related to Athene Co-Invest Reinsurance Affiliate 1A Ltd. and $2.1 billion of unfunded commitments related to Apollo/Athene Dedicated Investment Program. APOLLO INVESTOR DAY 2021 139
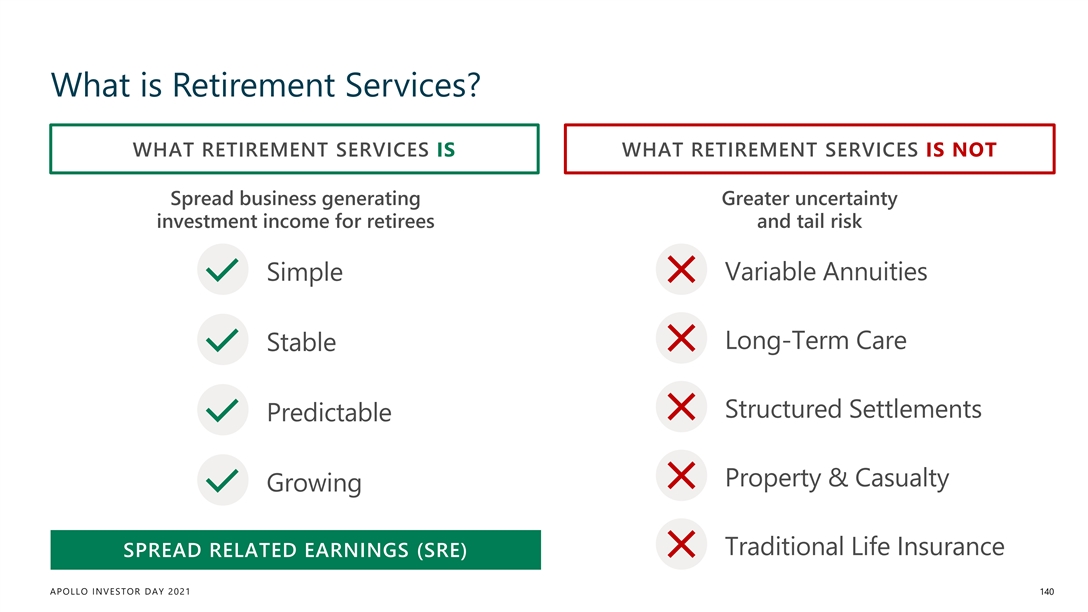
What is Retirement Services? WHAT RETIREMENT SERVICES IS WHAT RETIREMENT SERVICES IS NOT Spread business generating Greater uncertainty investment income for retirees and tail risk Variable Annuities Simple Long-Term Care Stable Structured Settlements Predictable Property & Casualty Growing Traditional Life Insurance SPREAD RELATED EARNINGS (SRE) APOLLO INVESTOR DAY 2021 140What is Retirement Services? WHAT RETIREMENT SERVICES IS WHAT RETIREMENT SERVICES IS NOT Spread business generating Greater uncertainty investment income for retirees and tail risk Variable Annuities Simple Long-Term Care Stable Structured Settlements Predictable Property & Casualty Growing Traditional Life Insurance SPREAD RELATED EARNINGS (SRE) APOLLO INVESTOR DAY 2021 140
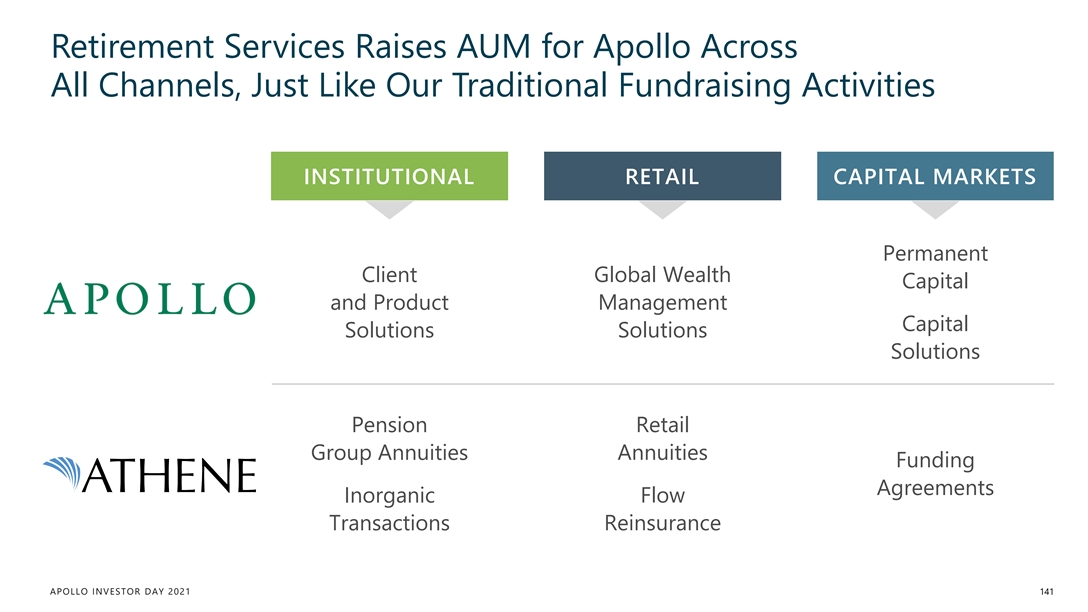
Retirement Services Raises AUM for Apollo Across All Channels, Just Like Our Traditional Fundraising Activities INSTITUTIONAL RETAIL CAPITAL MARKETS Permanent Client Global Wealth Capital and Product Management Capital Solutions Solutions Solutions Pension Retail Group Annuities Annuities Funding Agreements Inorganic Flow Transactions Reinsurance APOLLO INVESTOR DAY 2021 141Retirement Services Raises AUM for Apollo Across All Channels, Just Like Our Traditional Fundraising Activities INSTITUTIONAL RETAIL CAPITAL MARKETS Permanent Client Global Wealth Capital and Product Management Capital Solutions Solutions Solutions Pension Retail Group Annuities Annuities Funding Agreements Inorganic Flow Transactions Reinsurance APOLLO INVESTOR DAY 2021 141
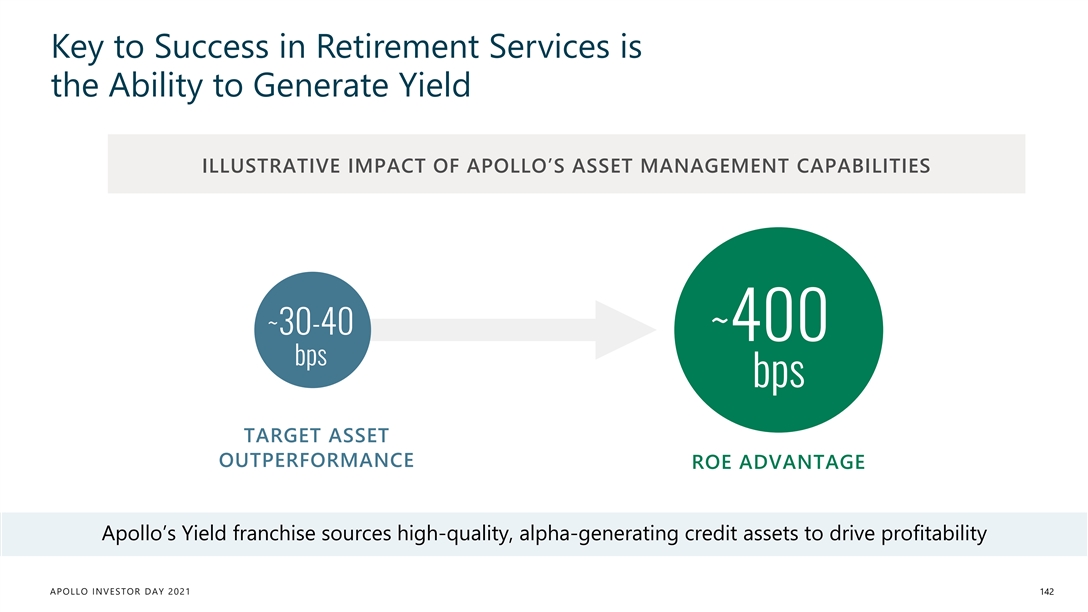
Key to Success in Retirement Services is the Ability to Generate Yield ILLUSTRATIVE IMPACT OF APOLLO’S ASSET MANAGEMENT CAPABILITIES ~30-40 ~400 bps bps TARGET ASSET OUTPERFORMANCE ROE ADVANTAGE Apollo’s Yield franchise sources high-quality, alpha-generating credit assets to drive profitability APOLLO INVESTOR DAY 2021 142Key to Success in Retirement Services is the Ability to Generate Yield ILLUSTRATIVE IMPACT OF APOLLO’S ASSET MANAGEMENT CAPABILITIES ~30-40 ~400 bps bps TARGET ASSET OUTPERFORMANCE ROE ADVANTAGE Apollo’s Yield franchise sources high-quality, alpha-generating credit assets to drive profitability APOLLO INVESTOR DAY 2021 142
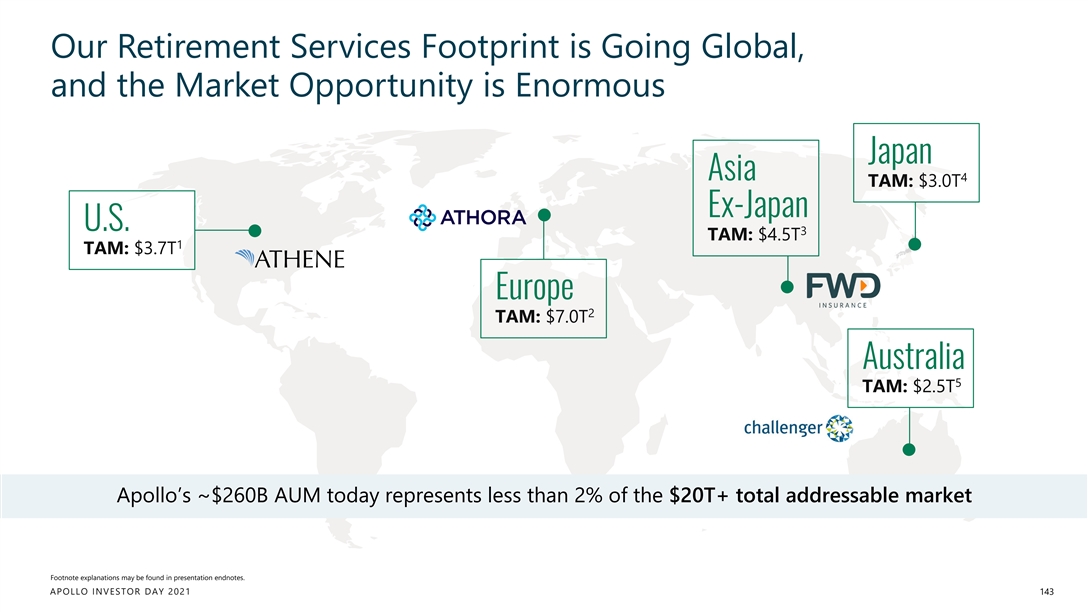
Our Retirement Services Footprint is Going Global, and the Market Opportunity is Enormous Japan Asia 4 TAM: $3.0T Ex-Japan U.S. 3 TAM: $4.5T 1 TAM: $3.7T Europe 2 TAM: $7.0T Australia 5 TAM: $2.5T Apollo’s ~$260B AUM today represents less than 2% of the $20T+ total addressable market Footnote explanations may be found in presentation endnotes. APOLLO INVESTOR DAY 2021 143Our Retirement Services Footprint is Going Global, and the Market Opportunity is Enormous Japan Asia 4 TAM: $3.0T Ex-Japan U.S. 3 TAM: $4.5T 1 TAM: $3.7T Europe 2 TAM: $7.0T Australia 5 TAM: $2.5T Apollo’s ~$260B AUM today represents less than 2% of the $20T+ total addressable market Footnote explanations may be found in presentation endnotes. APOLLO INVESTOR DAY 2021 143
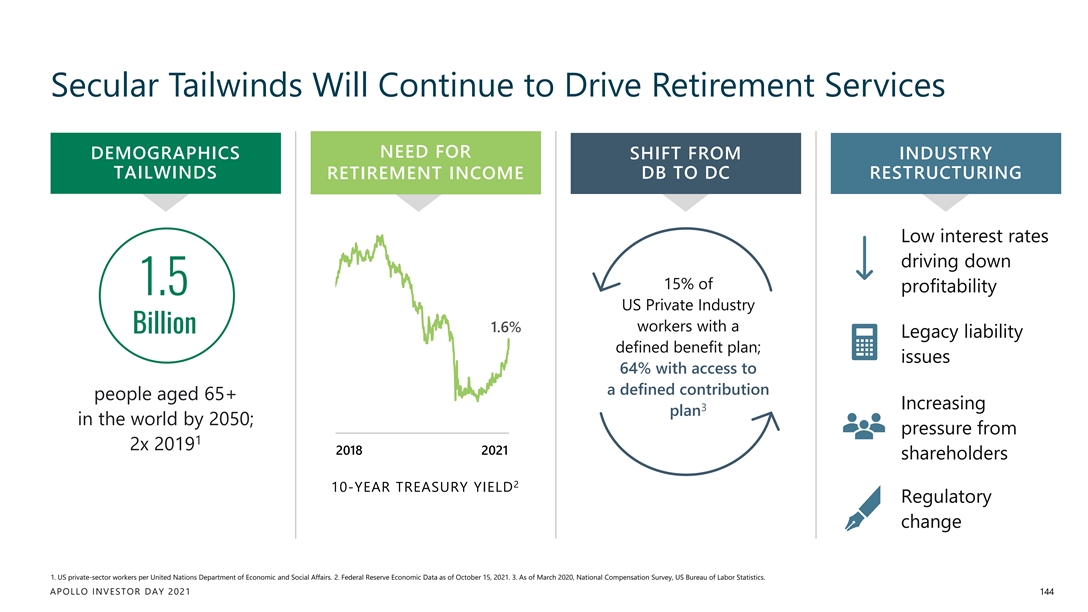
Secular Tailwinds Will Continue to Drive Retirement Services NEED FOR DEMOGRAPHICS SHIFT FROM INDUSTRY TAILWINDS RETIREMENT INCOME DB TO DC RESTRUCTURING Low interest rates driving down 15% of profitability 1.5 US Private Industry workers with a 1.6% Billion Legacy liability defined benefit plan; issues 64% with access to a defined contribution people aged 65+ Increasing 3 plan in the world by 2050; pressure from 1 2x 2019 2018 2021 shareholders 2 10-YEAR TREASURY YIELD Regulatory change 1. US private-sector workers per United Nations Department of Economic and Social Affairs. 2. Federal Reserve Economic Data as of October 15, 2021. 3. As of March 2020, National Compensation Survey, US Bureau of Labor Statistics. APOLLO INVESTOR DAY 2021 144Secular Tailwinds Will Continue to Drive Retirement Services NEED FOR DEMOGRAPHICS SHIFT FROM INDUSTRY TAILWINDS RETIREMENT INCOME DB TO DC RESTRUCTURING Low interest rates driving down 15% of profitability 1.5 US Private Industry workers with a 1.6% Billion Legacy liability defined benefit plan; issues 64% with access to a defined contribution people aged 65+ Increasing 3 plan in the world by 2050; pressure from 1 2x 2019 2018 2021 shareholders 2 10-YEAR TREASURY YIELD Regulatory change 1. US private-sector workers per United Nations Department of Economic and Social Affairs. 2. Federal Reserve Economic Data as of October 15, 2021. 3. As of March 2020, National Compensation Survey, US Bureau of Labor Statistics. APOLLO INVESTOR DAY 2021 144
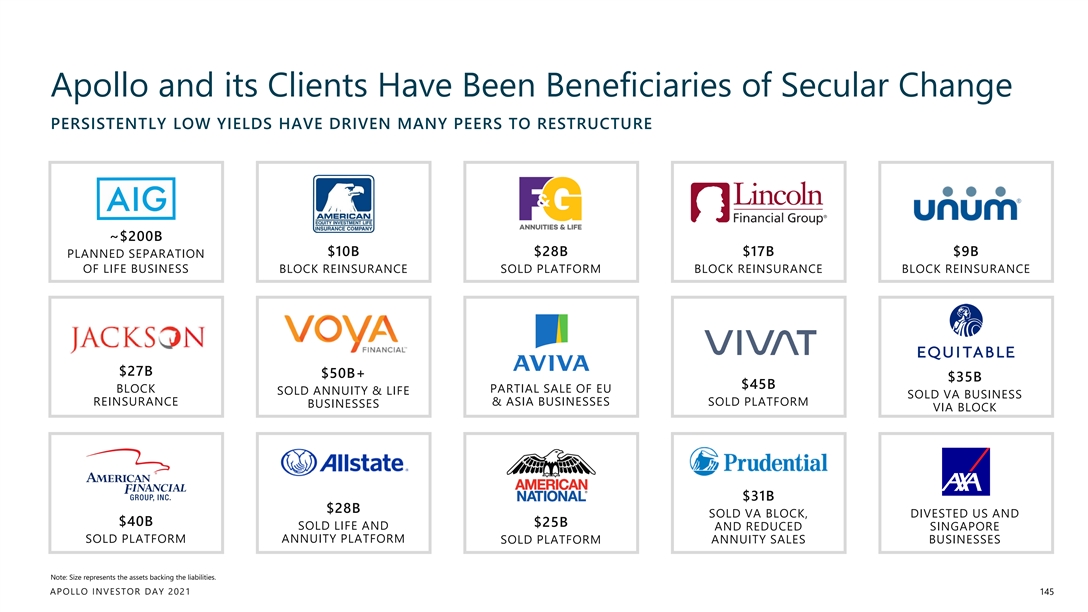
Apollo and its Clients Have Been Beneficiaries of Secular Change PERSISTENTLY LOW YIELDS HAVE DRIVEN MANY PEERS TO RESTRUCTURE ~$200B $10B $28B $17B $9B PLANNED SEPARATION OF LIFE BUSINESS BLOCK REINSURANCE SOLD PLATFORM BLOCK REINSURANCE BLOCK REINSURANCE $27B $50B+ $35B $45B BLOCK PARTIAL SALE OF EU SOLD ANNUITY & LIFE SOLD VA BUSINESS REINSURANCE & ASIA BUSINESSES SOLD PLATFORM BUSINESSES VIA BLOCK $31B $28B SOLD VA BLOCK, DIVESTED US AND $40B $25B SOLD LIFE AND AND REDUCED SINGAPORE SOLD PLATFORM ANNUITY PLATFORM SOLD PLATFORM ANNUITY SALES BUSINESSES Note: Size represents the assets backing the liabilities. APOLLO INVESTOR DAY 2021 145Apollo and its Clients Have Been Beneficiaries of Secular Change PERSISTENTLY LOW YIELDS HAVE DRIVEN MANY PEERS TO RESTRUCTURE ~$200B $10B $28B $17B $9B PLANNED SEPARATION OF LIFE BUSINESS BLOCK REINSURANCE SOLD PLATFORM BLOCK REINSURANCE BLOCK REINSURANCE $27B $50B+ $35B $45B BLOCK PARTIAL SALE OF EU SOLD ANNUITY & LIFE SOLD VA BUSINESS REINSURANCE & ASIA BUSINESSES SOLD PLATFORM BUSINESSES VIA BLOCK $31B $28B SOLD VA BLOCK, DIVESTED US AND $40B $25B SOLD LIFE AND AND REDUCED SINGAPORE SOLD PLATFORM ANNUITY PLATFORM SOLD PLATFORM ANNUITY SALES BUSINESSES Note: Size represents the assets backing the liabilities. APOLLO INVESTOR DAY 2021 145
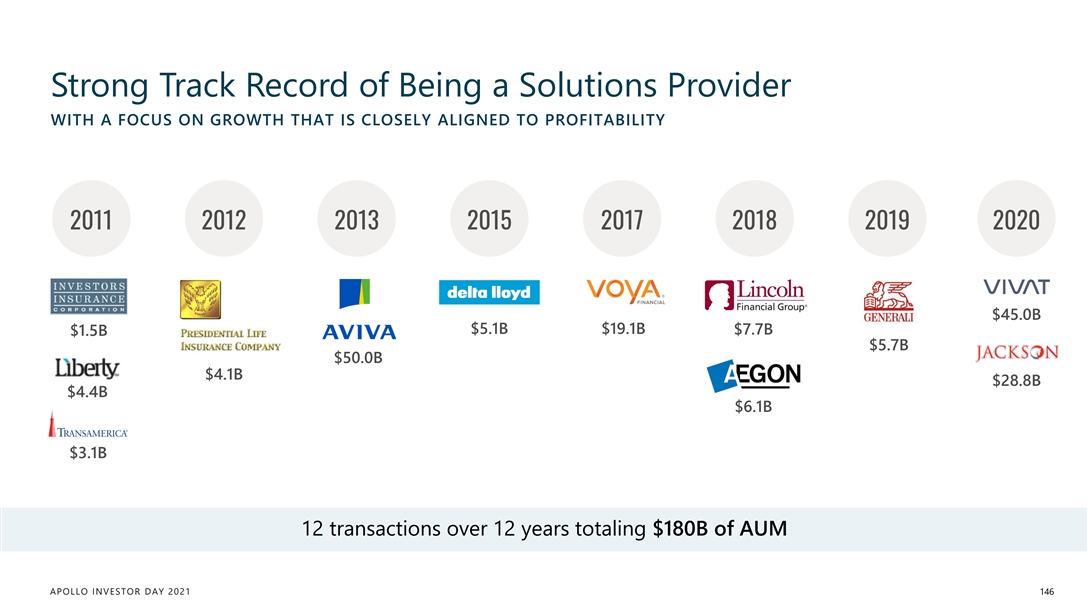
Strong Track Record of Being a Solutions Provider WITH A FOCUS ON GROWTH THAT IS CLOSELY ALIGNED TO PROFITABILITY 2011 2012 2013 2015 2017 2018 2019 2020 $45.0B $5.1B $19.1B $7.7B $1.5B $5.7B $50.0B $4.1B $28.8B $4.4B $6.1B $3.1B 12 transactions over 12 years totaling $180B of AUM APOLLO INVESTOR DAY 2021 146
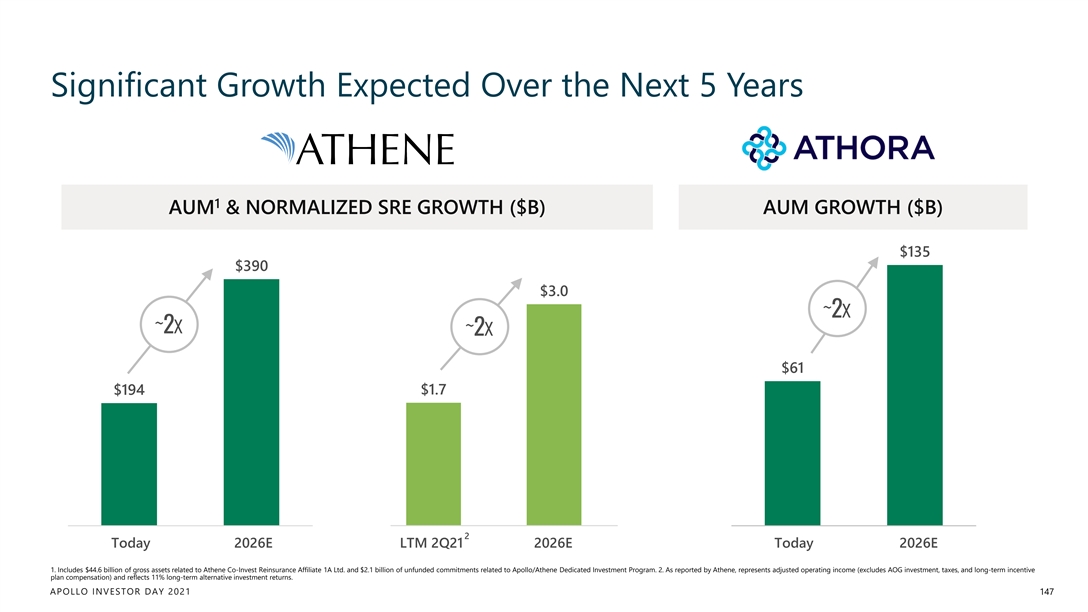
Significant Growth Expected Over the Next 5 Years 1 AUM & NORMALIZED SRE GROWTH ($B) AUM GROWTH ($B) $135 $390 $3.0 ~2x ~2x ~2x $61 $194 $1.7 2 Today In Five Years Today In Five Years Today 2026E LTM 2Q21 2026E Today 2026E 1. Includes $44.6 billion of gross assets related to Athene Co-Invest Reinsurance Affiliate 1A Ltd. and $2.1 billion of unfunded commitments related to Apollo/Athene Dedicated Investment Program. 2. As reported by Athene, represents adjusted operating income (excludes AOG investment, taxes, and long-term incentive plan compensation) and reflects 11% long-term alternative investment returns. APOLLO INVESTOR DAY 2021 147Significant Growth Expected Over the Next 5 Years 1 AUM & NORMALIZED SRE GROWTH ($B) AUM GROWTH ($B) $135 $390 $3.0 ~2x ~2x ~2x $61 $194 $1.7 2 Today In Five Years Today In Five Years Today 2026E LTM 2Q21 2026E Today 2026E 1. Includes $44.6 billion of gross assets related to Athene Co-Invest Reinsurance Affiliate 1A Ltd. and $2.1 billion of unfunded commitments related to Apollo/Athene Dedicated Investment Program. 2. As reported by Athene, represents adjusted operating income (excludes AOG investment, taxes, and long-term incentive plan compensation) and reflects 11% long-term alternative investment returns. APOLLO INVESTOR DAY 2021 147
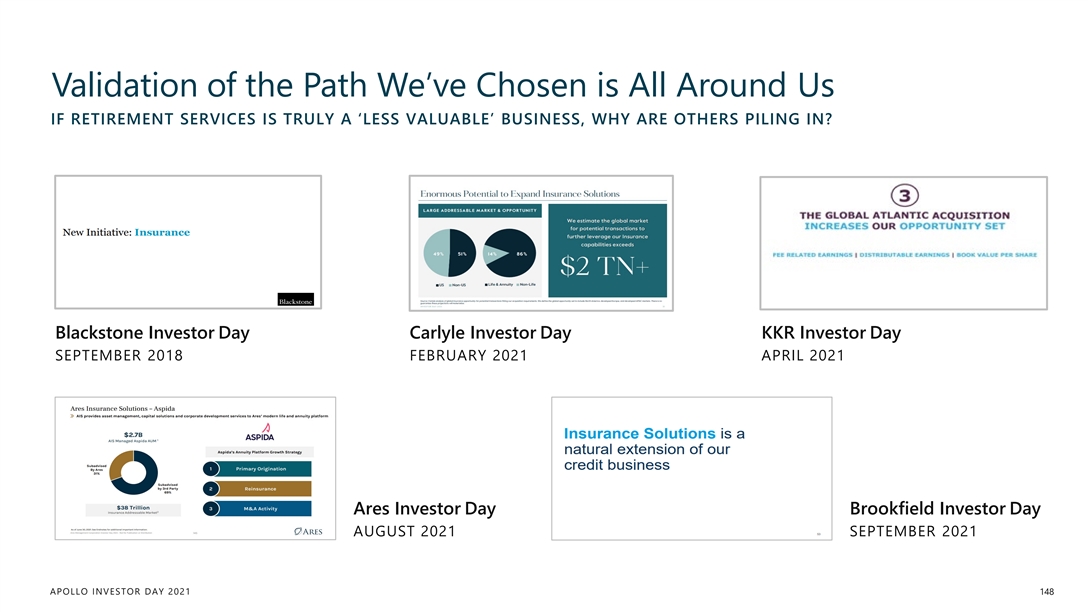
Validation of the Path We’ve Chosen is All Around Us IF RETIREMENT SERVICES IS TRULY A ‘LESS VALUABLE’ BUSINESS, WHY ARE OTHERS PILING IN? Blackstone Investor Day Carlyle Investor Day KKR Investor Day SEPTEMBER 2018 FEBRUARY 2021 APRIL 2021 Ares Investor Day Brookfield Investor Day AUGUST 2021 SEPTEMBER 2021 APOLLO INVESTOR DAY 2021 148Validation of the Path We’ve Chosen is All Around Us IF RETIREMENT SERVICES IS TRULY A ‘LESS VALUABLE’ BUSINESS, WHY ARE OTHERS PILING IN? Blackstone Investor Day Carlyle Investor Day KKR Investor Day SEPTEMBER 2018 FEBRUARY 2021 APRIL 2021 Ares Investor Day Brookfield Investor Day AUGUST 2021 SEPTEMBER 2021 APOLLO INVESTOR DAY 2021 148
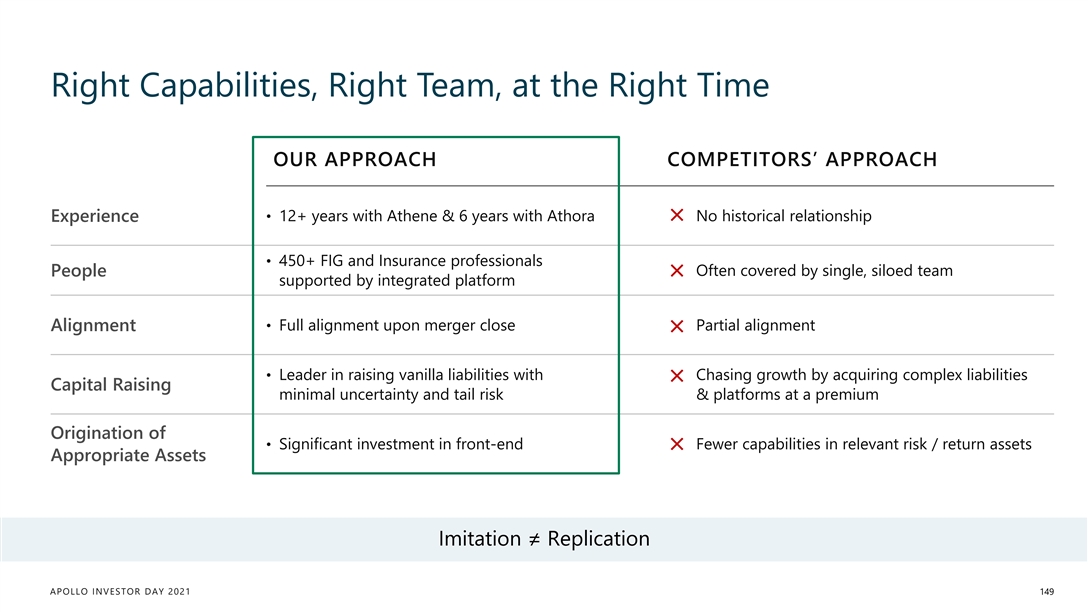
Right Capabilities, Right Team, at the Right Time OUR APPROACH COMPETITORS’ APPROACH • 12+ years with Athene & 6 years with Athora No historical relationship Experience • 450+ FIG and Insurance professionals Often covered by single, siloed team People supported by integrated platform Alignment • Full alignment upon merger close Partial alignment • Leader in raising vanilla liabilities with Chasing growth by acquiring complex liabilities Capital Raising minimal uncertainty and tail risk & platforms at a premium Origination of • Significant investment in front-end Fewer capabilities in relevant risk / return assets Appropriate Assets Imitation ≠ Replication APOLLO INVESTOR DAY 2021 149Right Capabilities, Right Team, at the Right Time OUR APPROACH COMPETITORS’ APPROACH • 12+ years with Athene & 6 years with Athora No historical relationship Experience • 450+ FIG and Insurance professionals Often covered by single, siloed team People supported by integrated platform Alignment • Full alignment upon merger close Partial alignment • Leader in raising vanilla liabilities with Chasing growth by acquiring complex liabilities Capital Raising minimal uncertainty and tail risk & platforms at a premium Origination of • Significant investment in front-end Fewer capabilities in relevant risk / return assets Appropriate Assets Imitation ≠ Replication APOLLO INVESTOR DAY 2021 149
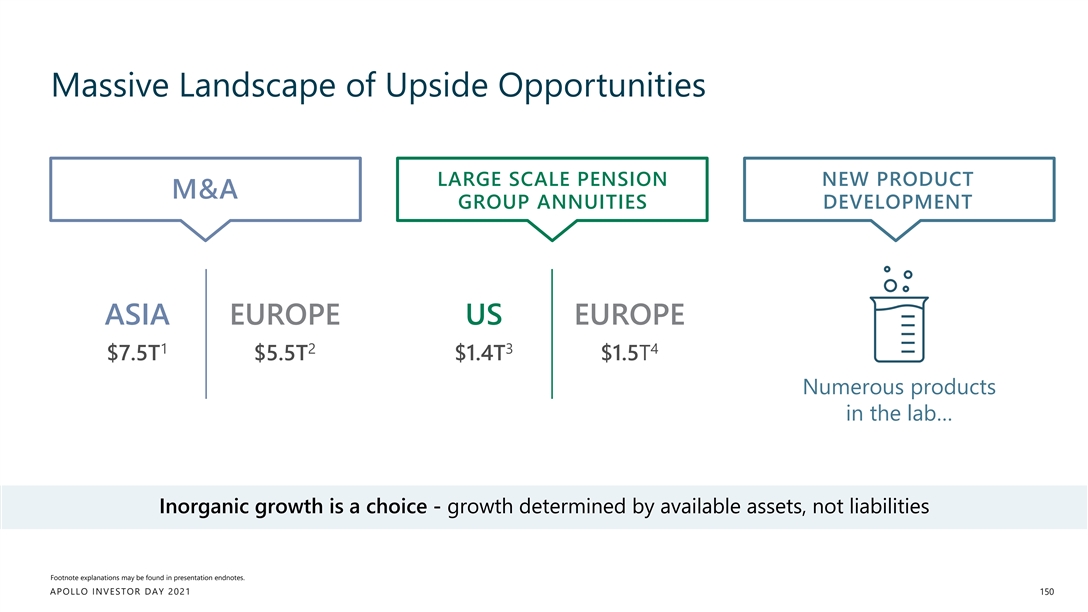
Massive Landscape of Upside Opportunities LARGE SCALE PENSION NEW PRODUCT M&A GROUP ANNUITIES DEVELOPMENT ASIA EUROPE US EUROPE 1 2 3 4 $7.5T $5.5T $1.4T $1.5T Numerous products in the lab… Inorganic growth is a choice - growth determined by available assets, not liabilities Footnote explanations may be found in presentation endnotes. APOLLO INVESTOR DAY 2021 150Massive Landscape of Upside Opportunities LARGE SCALE PENSION NEW PRODUCT M&A GROUP ANNUITIES DEVELOPMENT ASIA EUROPE US EUROPE 1 2 3 4 $7.5T $5.5T $1.4T $1.5T Numerous products in the lab… Inorganic growth is a choice - growth determined by available assets, not liabilities Footnote explanations may be found in presentation endnotes. APOLLO INVESTOR DAY 2021 150
Athene JIM BELARDI Athene Chairman, Chief Executive Officer, & Chief Investment Officer APOLLO INVESTOR DAY 2021Athene JIM BELARDI Athene Chairman, Chief Executive Officer, & Chief Investment Officer APOLLO INVESTOR DAY 2021
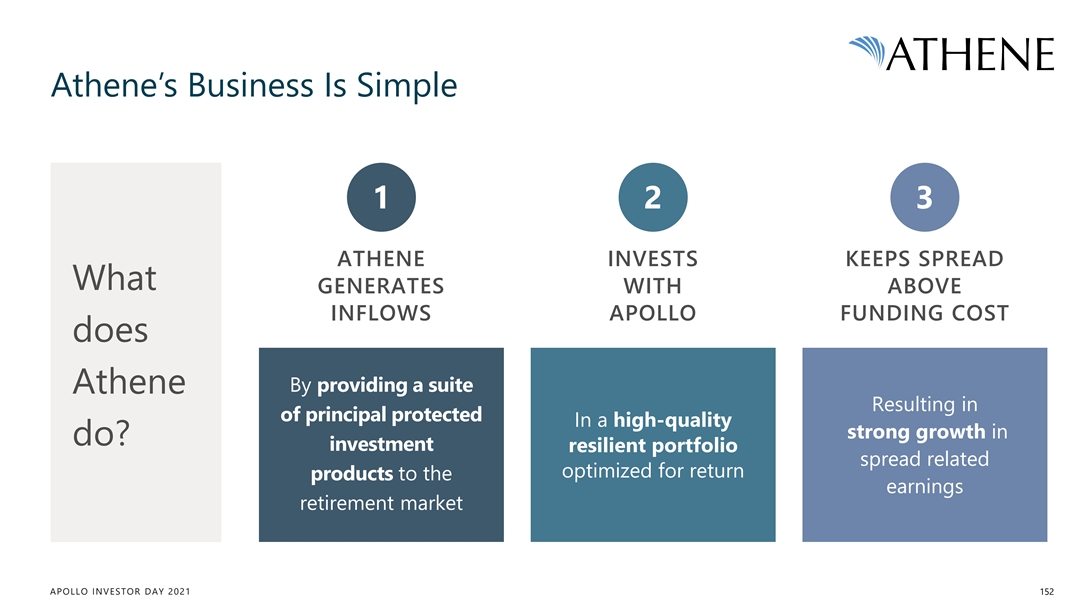
Athene’s Business Is Simple 1 2 3 ATHENE INVESTS KEEPS SPREAD What GENERATES WITH ABOVE INFLOWS APOLLO FUNDING COST does By providing a suite Athene Resulting in of principal protected In a high-quality strong growth in do? investment resilient portfolio spread related optimized for return products to the earnings retirement market APOLLO INVESTOR DAY 2021 152Athene’s Business Is Simple 1 2 3 ATHENE INVESTS KEEPS SPREAD What GENERATES WITH ABOVE INFLOWS APOLLO FUNDING COST does By providing a suite Athene Resulting in of principal protected In a high-quality strong growth in do? investment resilient portfolio spread related optimized for return products to the earnings retirement market APOLLO INVESTOR DAY 2021 152
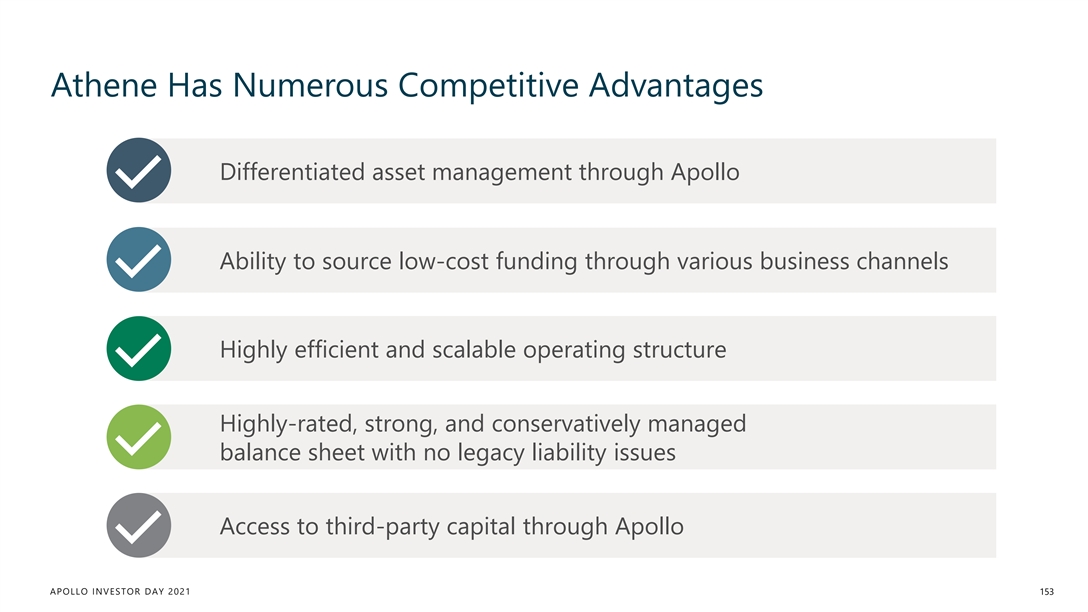
Athene Has Numerous Competitive Advantages Differentiated asset management through Apollo Ability to source low-cost funding through various business channels Highly efficient and scalable operating structure Highly-rated, strong, and conservatively managed balance sheet with no legacy liability issues Access to third-party capital through Apollo APOLLO INVESTOR DAY 2021 153Athene Has Numerous Competitive Advantages Differentiated asset management through Apollo Ability to source low-cost funding through various business channels Highly efficient and scalable operating structure Highly-rated, strong, and conservatively managed balance sheet with no legacy liability issues Access to third-party capital through Apollo APOLLO INVESTOR DAY 2021 153
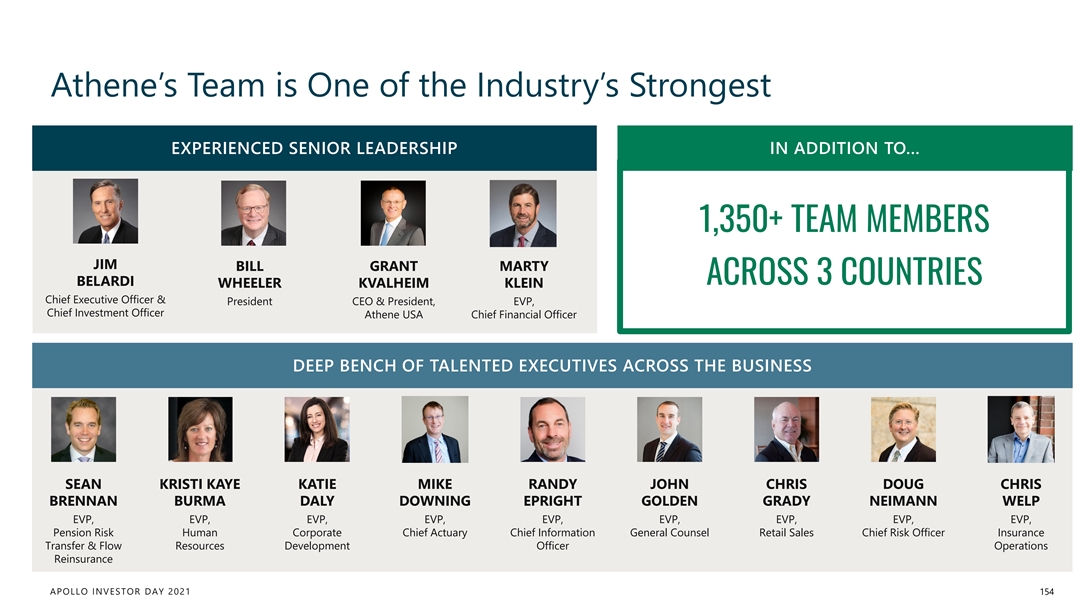
Athene’s Team is One of the Industry’s Strongest EXPERIENCED SENIOR LEADERSHIP IN ADDITION TO… 1,350+ TEAM MEMBERS JIM BILL GRANT MARTY ACROSS 3 COUNTRIES BELARDI WHEELER KVALHEIM KLEIN Chief Executive Officer & President CEO & President, EVP, Chief Investment Officer Athene USA Chief Financial Officer DEEP BENCH OF TALENTED EXECUTIVES ACROSS THE BUSINESS SEAN KRISTI KAYE KATIE MIKE RANDY JOHN CHRIS DOUG CHRIS BRENNAN BURMA DALY DOWNING EPRIGHT GOLDEN GRADY NEIMANN WELP EVP, EVP, EVP, EVP, EVP, EVP, EVP, EVP, EVP, Pension Risk Human Corporate Chief Actuary Chief Information General Counsel Retail Sales Chief Risk Officer Insurance Transfer & Flow Resources Development Officer Operations Reinsurance APOLLO INVESTOR DAY 2021 154
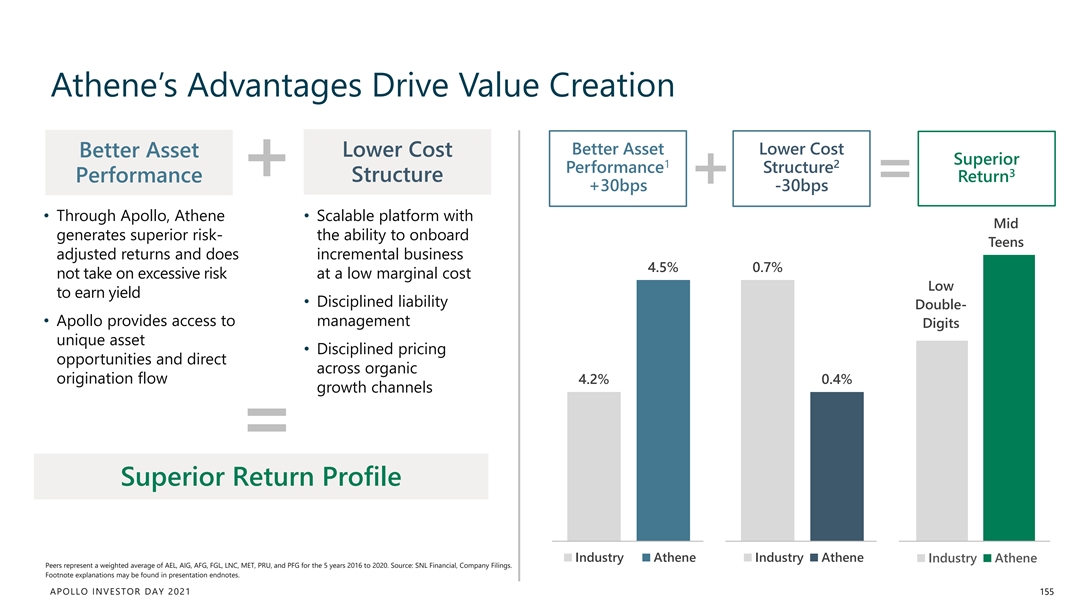
Athene’s Advantages Drive Value Creation Better Asset Lower Cost Better Asset Lower Cost Superior 1 2 Performance Structure 3 Structure Return Performance +30bps -30bps • Through Apollo, Athene • Scalable platform with Mid generates superior risk- the ability to onboard Teens adjusted returns and does incremental business 4.5% 0.7% not take on excessive risk at a low marginal cost Low to earn yield • Disciplined liability Double- • Apollo provides access to management Digits unique asset • Disciplined pricing opportunities and direct across organic origination flow 4.2% 0.4% growth channels Superior Return Profile Industry Athene Industry Athene Industry Athene Peers represent a weighted average of AEL, AIG, AFG, FGL, LNC, MET, PRU, and PFG for the 5 years 2016 to 2020. Source: SNL Financial, Company Filings. Footnote explanations may be found in presentation endnotes. APOLLO INVESTOR DAY 2021 155Athene’s Advantages Drive Value Creation Better Asset Lower Cost Better Asset Lower Cost Superior 1 2 Performance Structure 3 Structure Return Performance +30bps -30bps • Through Apollo, Athene • Scalable platform with Mid generates superior risk- the ability to onboard Teens adjusted returns and does incremental business 4.5% 0.7% not take on excessive risk at a low marginal cost Low to earn yield • Disciplined liability Double- • Apollo provides access to management Digits unique asset • Disciplined pricing opportunities and direct across organic origination flow 4.2% 0.4% growth channels Superior Return Profile Industry Athene Industry Athene Industry Athene Peers represent a weighted average of AEL, AIG, AFG, FGL, LNC, MET, PRU, and PFG for the 5 years 2016 to 2020. Source: SNL Financial, Company Filings. Footnote explanations may be found in presentation endnotes. APOLLO INVESTOR DAY 2021 155
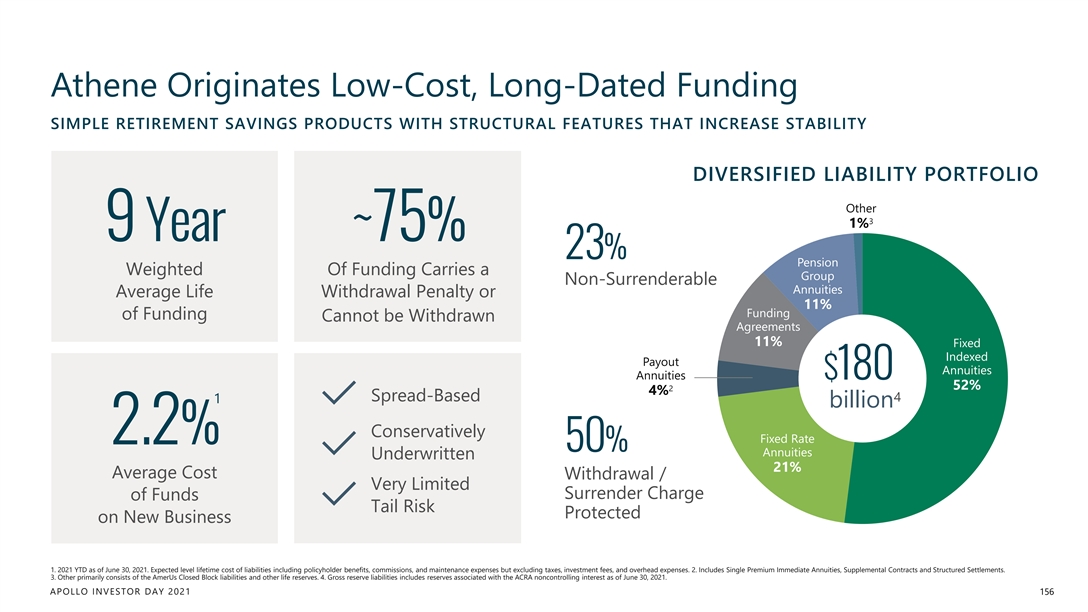
Athene Originates Low-Cost, Long-Dated Funding SIMPLE RETIREMENT SAVINGS PRODUCTS WITH STRUCTURAL FEATURES THAT INCREASE STABILITY DIVERSIFIED LIABILITY PORTFOLIO Other 3 1% 9 Year ~75% 23% Pension Weighted Of Funding Carries a Group Non-Surrenderable Annuities Average Life Withdrawal Penalty or 11% Funding of Funding Cannot be Withdrawn Agreements 11% Fixed Indexed Payout Annuities Annuities $180 52% 2 4% Spread-Based 4 1 billion Conservatively Fixed Rate 2.2% 50% Annuities Underwritten 21% Average Cost Withdrawal / Very Limited Surrender Charge of Funds Tail Risk Protected on New Business 1. 2021 YTD as of June 30, 2021. Expected level lifetime cost of liabilities including policyholder benefits, commissions, and maintenance expenses but excluding taxes, investment fees, and overhead expenses. 2. Includes Single Premium Immediate Annuities, Supplemental Contracts and Structured Settlements. 3. Other primarily consists of the AmerUs Closed Block liabilities and other life reserves. 4. Gross reserve liabilities includes reserves associated with the ACRA noncontrolling interest as of June 30, 2021. APOLLO INVESTOR DAY 2021 156Athene Originates Low-Cost, Long-Dated Funding SIMPLE RETIREMENT SAVINGS PRODUCTS WITH STRUCTURAL FEATURES THAT INCREASE STABILITY DIVERSIFIED LIABILITY PORTFOLIO Other 3 1% 9 Year ~75% 23% Pension Weighted Of Funding Carries a Group Non-Surrenderable Annuities Average Life Withdrawal Penalty or 11% Funding of Funding Cannot be Withdrawn Agreements 11% Fixed Indexed Payout Annuities Annuities $180 52% 2 4% Spread-Based 4 1 billion Conservatively Fixed Rate 2.2% 50% Annuities Underwritten 21% Average Cost Withdrawal / Very Limited Surrender Charge of Funds Tail Risk Protected on New Business 1. 2021 YTD as of June 30, 2021. Expected level lifetime cost of liabilities including policyholder benefits, commissions, and maintenance expenses but excluding taxes, investment fees, and overhead expenses. 2. Includes Single Premium Immediate Annuities, Supplemental Contracts and Structured Settlements. 3. Other primarily consists of the AmerUs Closed Block liabilities and other life reserves. 4. Gross reserve liabilities includes reserves associated with the ACRA noncontrolling interest as of June 30, 2021. APOLLO INVESTOR DAY 2021 156
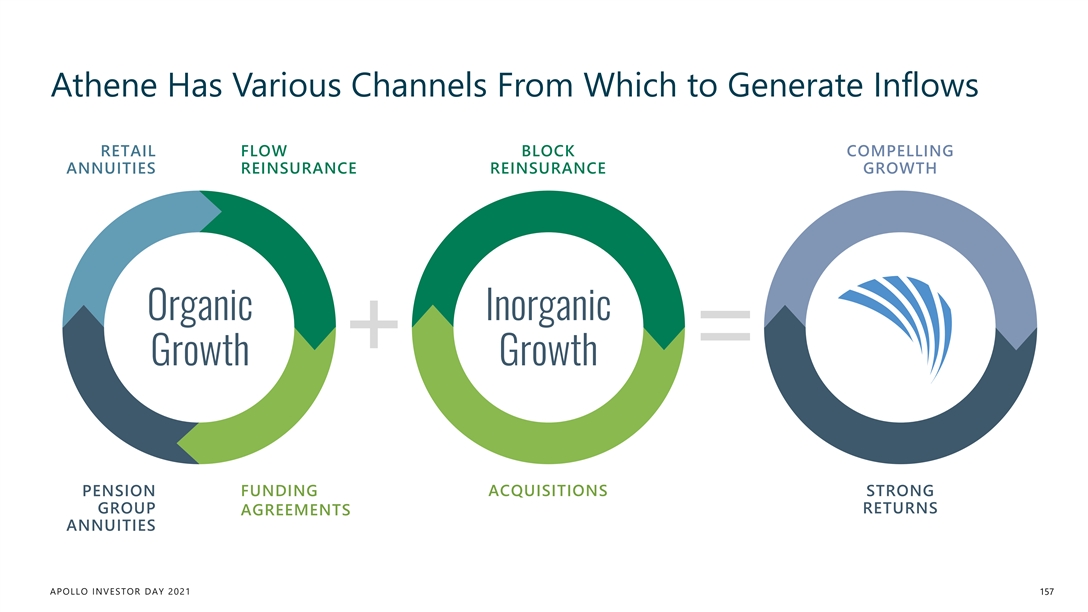
Athene Has Various Channels From Which to Generate Inflows RETAIL FLOW BLOCK COMPELLING ANNUITIES REINSURANCE REINSURANCE GROWTH Organic Inorganic Growth Growth PENSION FUNDING ACQUISITIONS STRONG GROUP RETURNS AGREEMENTS ANNUITIES APOLLO INVESTOR DAY 2021 157Athene Has Various Channels From Which to Generate Inflows RETAIL FLOW BLOCK COMPELLING ANNUITIES REINSURANCE REINSURANCE GROWTH Organic Inorganic Growth Growth PENSION FUNDING ACQUISITIONS STRONG GROUP RETURNS AGREEMENTS ANNUITIES APOLLO INVESTOR DAY 2021 157
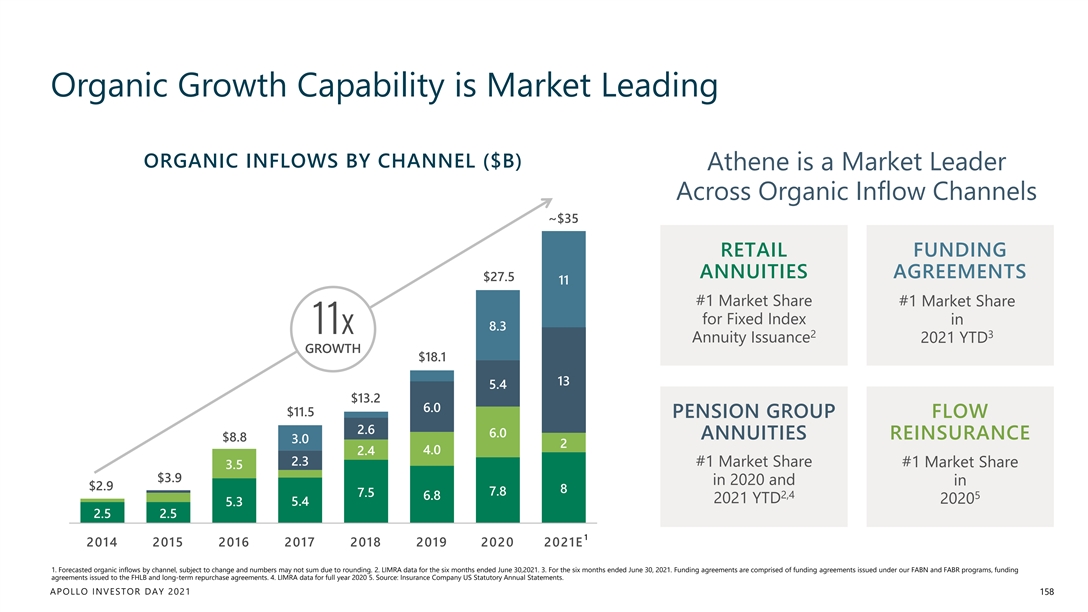
Organic Growth Capability is Market Leading ORGANIC INFLOWS BY CHANNEL ($B) Athene is a Market Leader Across Organic Inflow Channels ~$35 RETAIL FUNDING ANNUITIES AGREEMENTS $27.5 11 #1 Market Share #1 Market Share for Fixed Index in 8.3 11x 2 3 Annuity Issuance 2021 YTD GROWTH $18.1 13 5.4 $13.2 6.0 $11.5 PENSION GROUP FLOW 2.6 6.0 ANNUITIES REINSURANCE $8.8 3.0 2 4.0 2.4 2.3 #1 Market Share #1 Market Share 3.5 $3.9 in 2020 and in $2.9 8 7.8 7.5 2,4 5 6.8 2021 YTD 2020 5.3 5.4 2.5 2.5 1 2014 2015 2016 2017 2018 2019 2020 2021E 1. Forecasted organic inflows by channel, subject to change and numbers may not sum due to rounding. 2. LIMRA data for the six months ended June 30,2021. 3. For the six months ended June 30, 2021. Funding agreements are comprised of funding agreements issued under our FABN and FABR programs, funding agreements issued to the FHLB and long-term repurchase agreements. 4. LIMRA data for full year 2020 5. Source: Insurance Company US Statutory Annual Statements. APOLLO INVESTOR DAY 2021 158Organic Growth Capability is Market Leading ORGANIC INFLOWS BY CHANNEL ($B) Athene is a Market Leader Across Organic Inflow Channels ~$35 RETAIL FUNDING ANNUITIES AGREEMENTS $27.5 11 #1 Market Share #1 Market Share for Fixed Index in 8.3 11x 2 3 Annuity Issuance 2021 YTD GROWTH $18.1 13 5.4 $13.2 6.0 $11.5 PENSION GROUP FLOW 2.6 6.0 ANNUITIES REINSURANCE $8.8 3.0 2 4.0 2.4 2.3 #1 Market Share #1 Market Share 3.5 $3.9 in 2020 and in $2.9 8 7.8 7.5 2,4 5 6.8 2021 YTD 2020 5.3 5.4 2.5 2.5 1 2014 2015 2016 2017 2018 2019 2020 2021E 1. Forecasted organic inflows by channel, subject to change and numbers may not sum due to rounding. 2. LIMRA data for the six months ended June 30,2021. 3. For the six months ended June 30, 2021. Funding agreements are comprised of funding agreements issued under our FABN and FABR programs, funding agreements issued to the FHLB and long-term repurchase agreements. 4. LIMRA data for full year 2020 5. Source: Insurance Company US Statutory Annual Statements. APOLLO INVESTOR DAY 2021 158
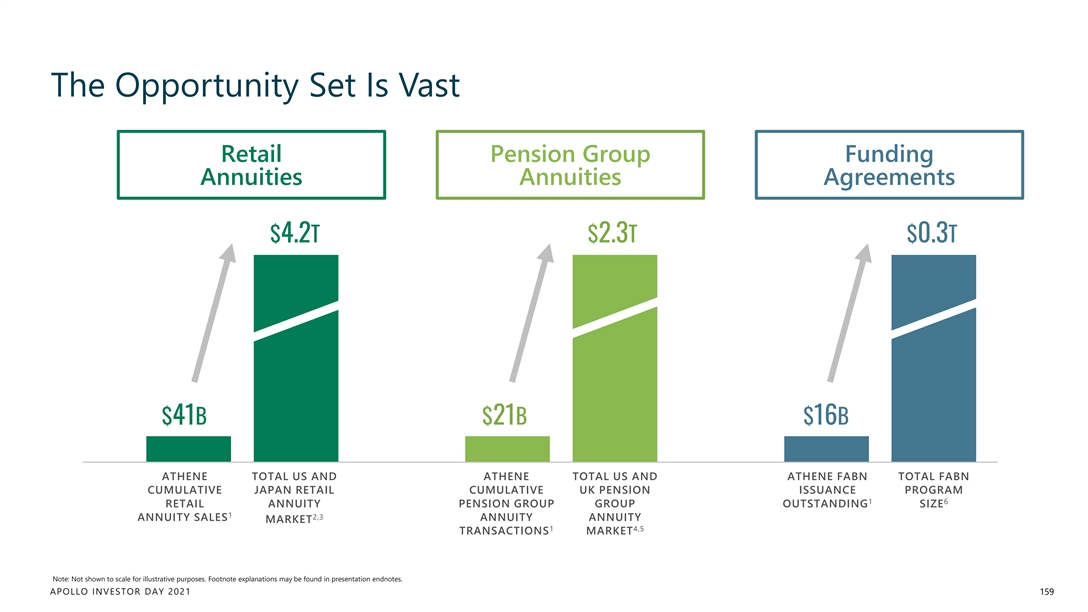
The Opportunity Set Is Vast Retail Pension Group Funding Annuities Annuities Agreements $4.2T $2.3T $0.3T $41B $21B $16B ATHENE TOTAL US AND ATHENE TOTAL US AND ATHENE FABN TOTAL FABN CUMULATIVE JAPAN RETAIL CUMULATIVE UK PENSION ISSUANCE PROGRAM 1 6 RETAIL ANNUITY PENSION GROUP GROUP OUTSTANDING SIZE 1 2,3 ANNUITY SALES ANNUITY ANNUITY MARKET 1 4,5 TRANSACTIONS MARKET Note: Not shown to scale for illustrative purposes. Footnote explanations may be found in presentation endnotes. APOLLO INVESTOR DAY 2021 159The Opportunity Set Is Vast Retail Pension Group Funding Annuities Annuities Agreements $4.2T $2.3T $0.3T $41B $21B $16B ATHENE TOTAL US AND ATHENE TOTAL US AND ATHENE FABN TOTAL FABN CUMULATIVE JAPAN RETAIL CUMULATIVE UK PENSION ISSUANCE PROGRAM 1 6 RETAIL ANNUITY PENSION GROUP GROUP OUTSTANDING SIZE 1 2,3 ANNUITY SALES ANNUITY ANNUITY MARKET 1 4,5 TRANSACTIONS MARKET Note: Not shown to scale for illustrative purposes. Footnote explanations may be found in presentation endnotes. APOLLO INVESTOR DAY 2021 159
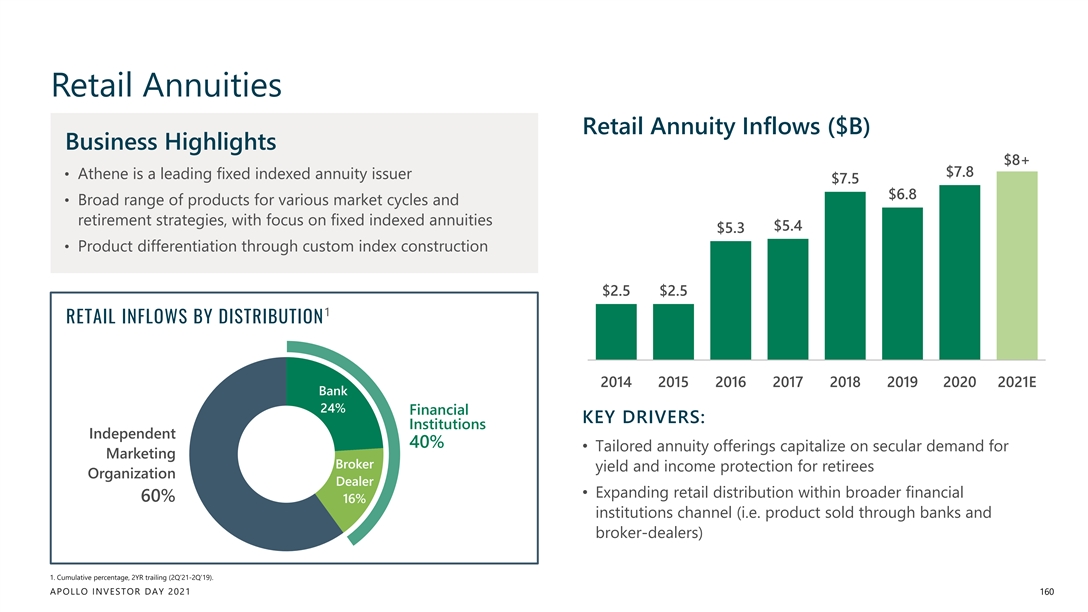
Retail Annuities Retail Annuity Inflows ($B) Business Highlights $8+ $7.8 • Athene is a leading fixed indexed annuity issuer $7.5 $6.8 • Broad range of products for various market cycles and retirement strategies, with focus on fixed indexed annuities $5.4 $5.3 • Product differentiation through custom index construction $2.5 $2.5 1 RETAIL INFLOWS BY DISTRIBUTION 2014 2015 2016 2017 2018 2019 2020 2021E Bank 24% Financial KEY DRIVERS: Institutions Independent 40% • Tailored annuity offerings capitalize on secular demand for Marketing Broker yield and income protection for retirees Organization Dealer • Expanding retail distribution within broader financial 60% 16% institutions channel (i.e. product sold through banks and broker-dealers) 1. Cumulative percentage, 2YR trailing (2Q’21-2Q’19). APOLLO INVESTOR DAY 2021 160Retail Annuities Retail Annuity Inflows ($B) Business Highlights $8+ $7.8 • Athene is a leading fixed indexed annuity issuer $7.5 $6.8 • Broad range of products for various market cycles and retirement strategies, with focus on fixed indexed annuities $5.4 $5.3 • Product differentiation through custom index construction $2.5 $2.5 1 RETAIL INFLOWS BY DISTRIBUTION 2014 2015 2016 2017 2018 2019 2020 2021E Bank 24% Financial KEY DRIVERS: Institutions Independent 40% • Tailored annuity offerings capitalize on secular demand for Marketing Broker yield and income protection for retirees Organization Dealer • Expanding retail distribution within broader financial 60% 16% institutions channel (i.e. product sold through banks and broker-dealers) 1. Cumulative percentage, 2YR trailing (2Q’21-2Q’19). APOLLO INVESTOR DAY 2021 160
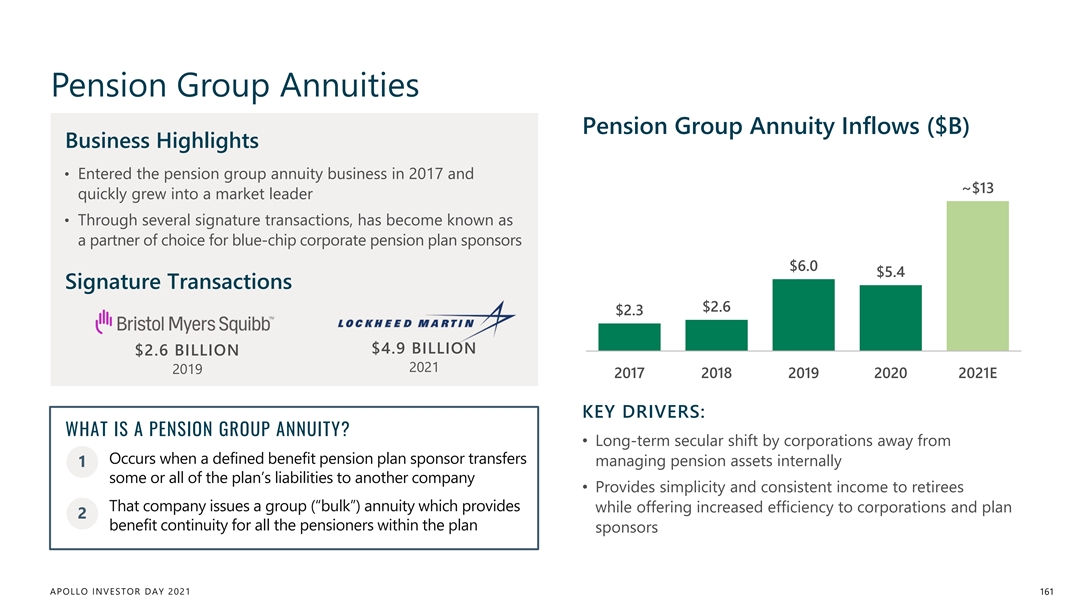
Pension Group Annuities Pension Group Annuity Inflows ($B) Business Highlights • Entered the pension group annuity business in 2017 and ~$13 quickly grew into a market leader • Through several signature transactions, has become known as a partner of choice for blue-chip corporate pension plan sponsors $6.0 $5.4 Signature Transactions $2.6 $2.3 $4.9 BILLION $2.6 BILLION 2021 2019 2017 2018 2019 2020 2021E KEY DRIVERS: WHAT IS A PENSION GROUP ANNUITY? • Long-term secular shift by corporations away from Occurs when a defined benefit pension plan sponsor transfers managing pension assets internally 1 some or all of the plan’s liabilities to another company • Provides simplicity and consistent income to retirees That company issues a group (“bulk”) annuity which provides while offering increased efficiency to corporations and plan 2 benefit continuity for all the pensioners within the plan sponsors APOLLO INVESTOR DAY 2021 161Pension Group Annuities Pension Group Annuity Inflows ($B) Business Highlights • Entered the pension group annuity business in 2017 and ~$13 quickly grew into a market leader • Through several signature transactions, has become known as a partner of choice for blue-chip corporate pension plan sponsors $6.0 $5.4 Signature Transactions $2.6 $2.3 $4.9 BILLION $2.6 BILLION 2021 2019 2017 2018 2019 2020 2021E KEY DRIVERS: WHAT IS A PENSION GROUP ANNUITY? • Long-term secular shift by corporations away from Occurs when a defined benefit pension plan sponsor transfers managing pension assets internally 1 some or all of the plan’s liabilities to another company • Provides simplicity and consistent income to retirees That company issues a group (“bulk”) annuity which provides while offering increased efficiency to corporations and plan 2 benefit continuity for all the pensioners within the plan sponsors APOLLO INVESTOR DAY 2021 161
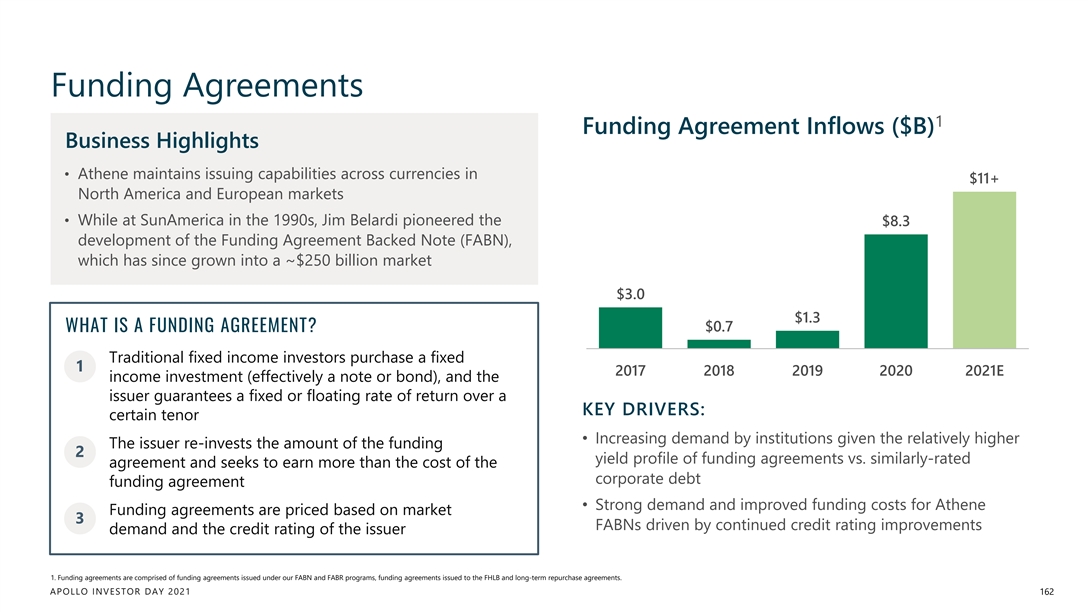
Funding Agreements 1 Funding Agreement Inflows ($B) Business Highlights • Athene maintains issuing capabilities across currencies in $11+ North America and European markets • While at SunAmerica in the 1990s, Jim Belardi pioneered the $8.3 development of the Funding Agreement Backed Note (FABN), which has since grown into a ~$250 billion market $3.0 $1.3 WHAT IS A FUNDING AGREEMENT? $0.7 Traditional fixed income investors purchase a fixed 1 2017 2018 2019 2020 2021E income investment (effectively a note or bond), and the issuer guarantees a fixed or floating rate of return over a KEY DRIVERS: certain tenor • Increasing demand by institutions given the relatively higher The issuer re-invests the amount of the funding 2 yield profile of funding agreements vs. similarly-rated agreement and seeks to earn more than the cost of the corporate debt funding agreement • Strong demand and improved funding costs for Athene Funding agreements are priced based on market 3 FABNs driven by continued credit rating improvements demand and the credit rating of the issuer 1. Funding agreements are comprised of funding agreements issued under our FABN and FABR programs, funding agreements issued to the FHLB and long-term repurchase agreements. APOLLO INVESTOR DAY 2021 162Funding Agreements 1 Funding Agreement Inflows ($B) Business Highlights • Athene maintains issuing capabilities across currencies in $11+ North America and European markets • While at SunAmerica in the 1990s, Jim Belardi pioneered the $8.3 development of the Funding Agreement Backed Note (FABN), which has since grown into a ~$250 billion market $3.0 $1.3 WHAT IS A FUNDING AGREEMENT? $0.7 Traditional fixed income investors purchase a fixed 1 2017 2018 2019 2020 2021E income investment (effectively a note or bond), and the issuer guarantees a fixed or floating rate of return over a KEY DRIVERS: certain tenor • Increasing demand by institutions given the relatively higher The issuer re-invests the amount of the funding 2 yield profile of funding agreements vs. similarly-rated agreement and seeks to earn more than the cost of the corporate debt funding agreement • Strong demand and improved funding costs for Athene Funding agreements are priced based on market 3 FABNs driven by continued credit rating improvements demand and the credit rating of the issuer 1. Funding agreements are comprised of funding agreements issued under our FABN and FABR programs, funding agreements issued to the FHLB and long-term repurchase agreements. APOLLO INVESTOR DAY 2021 162
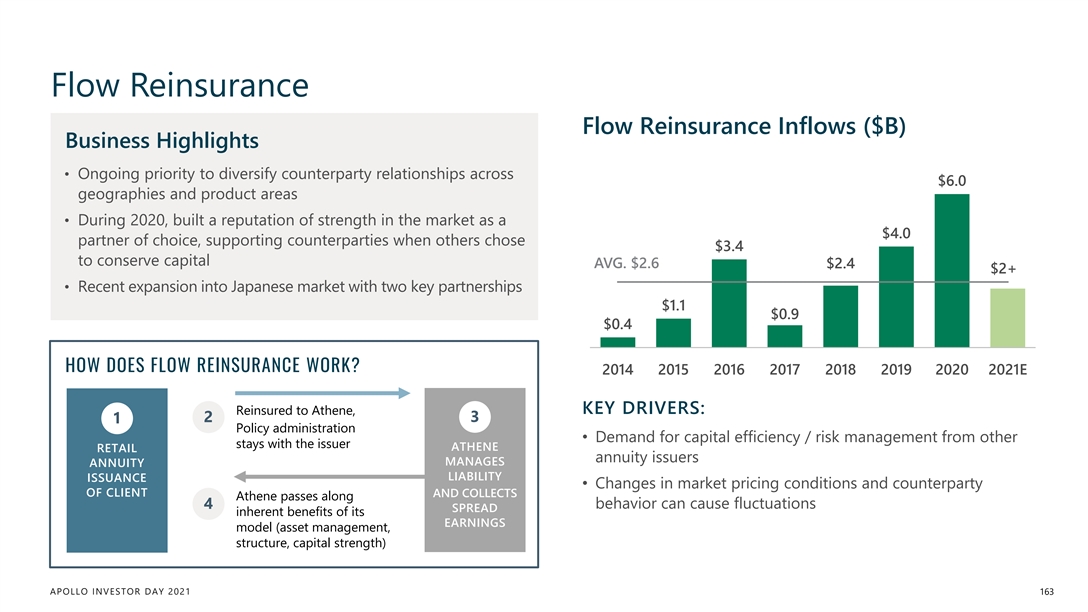
Flow Reinsurance Flow Reinsurance Inflows ($B) Business Highlights • Ongoing priority to diversify counterparty relationships across $6.0 geographies and product areas • During 2020, built a reputation of strength in the market as a $4.0 partner of choice, supporting counterparties when others chose $3.4 to conserve capital AVG. $2.6 $2.4 $2+ • Recent expansion into Japanese market with two key partnerships $1.1 $0.9 $0.4 HOW DOES FLOW REINSURANCE WORK? 2014 2015 2016 2017 2018 2019 2020 2021E KEY DRIVERS: Reinsured to Athene, 2 3 1 Policy administration • Demand for capital efficiency / risk management from other stays with the issuer ATHENE RETAIL annuity issuers MANAGES ANNUITY LIABILITY ISSUANCE • Changes in market pricing conditions and counterparty OF CLIENT AND COLLECTS Athene passes along 4 behavior can cause fluctuations SPREAD inherent benefits of its EARNINGS model (asset management, structure, capital strength) APOLLO INVESTOR DAY 2021 163Flow Reinsurance Flow Reinsurance Inflows ($B) Business Highlights • Ongoing priority to diversify counterparty relationships across $6.0 geographies and product areas • During 2020, built a reputation of strength in the market as a $4.0 partner of choice, supporting counterparties when others chose $3.4 to conserve capital AVG. $2.6 $2.4 $2+ • Recent expansion into Japanese market with two key partnerships $1.1 $0.9 $0.4 HOW DOES FLOW REINSURANCE WORK? 2014 2015 2016 2017 2018 2019 2020 2021E KEY DRIVERS: Reinsured to Athene, 2 3 1 Policy administration • Demand for capital efficiency / risk management from other stays with the issuer ATHENE RETAIL annuity issuers MANAGES ANNUITY LIABILITY ISSUANCE • Changes in market pricing conditions and counterparty OF CLIENT AND COLLECTS Athene passes along 4 behavior can cause fluctuations SPREAD inherent benefits of its EARNINGS model (asset management, structure, capital strength) APOLLO INVESTOR DAY 2021 163
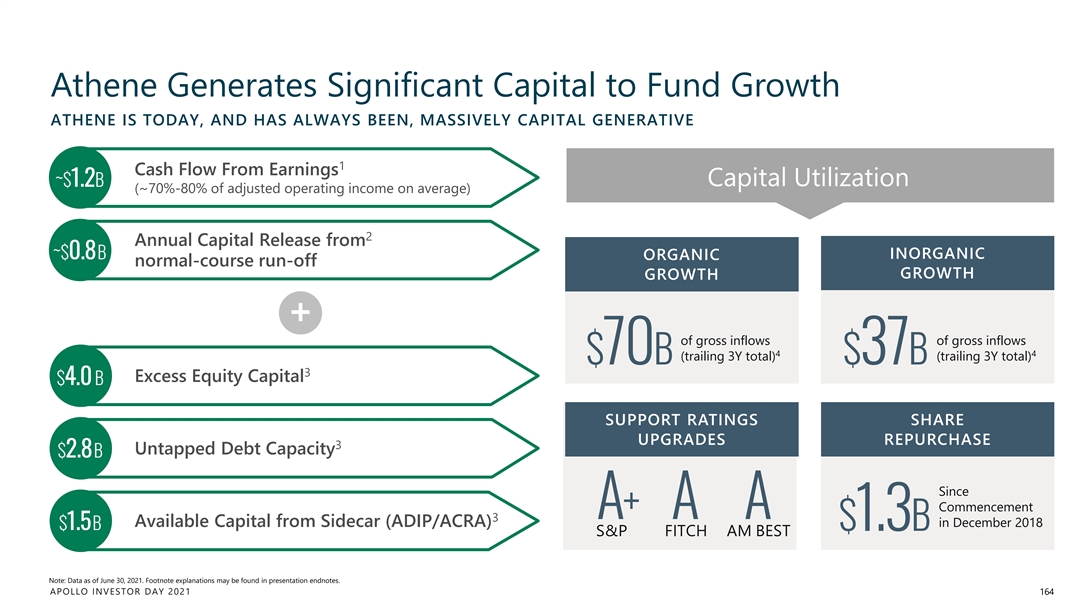
Athene Generates Significant Capital to Fund Growth ATHENE IS TODAY, AND HAS ALWAYS BEEN, MASSIVELY CAPITAL GENERATIVE 1 Cash Flow From Earnings Capital Utilization ~$1.2B (~70%-80% of adjusted operating income on average) 2 Annual Capital Release from ~$0.8B INORGANIC ORGANIC normal-course run-off GROWTH GROWTH + of gross inflows of gross inflows 4 4 (trailing 3Y total) (trailing 3Y total) $70B $37B 3 Excess Equity Capital $4.0 B SUPPORT RATINGS SHARE UPGRADES REPURCHASE 3 Untapped Debt Capacity $2.8B Since Commencement A+ A A 3 Available Capital from Sidecar (ADIP/ACRA) in December 2018 $1.5B $1.3B S&P FITCH AM BEST Note: Data as of June 30, 2021. Footnote explanations may be found in presentation endnotes. APOLLO INVESTOR DAY 2021 164Athene Generates Significant Capital to Fund Growth ATHENE IS TODAY, AND HAS ALWAYS BEEN, MASSIVELY CAPITAL GENERATIVE 1 Cash Flow From Earnings Capital Utilization ~$1.2B (~70%-80% of adjusted operating income on average) 2 Annual Capital Release from ~$0.8B INORGANIC ORGANIC normal-course run-off GROWTH GROWTH + of gross inflows of gross inflows 4 4 (trailing 3Y total) (trailing 3Y total) $70B $37B 3 Excess Equity Capital $4.0 B SUPPORT RATINGS SHARE UPGRADES REPURCHASE 3 Untapped Debt Capacity $2.8B Since Commencement A+ A A 3 Available Capital from Sidecar (ADIP/ACRA) in December 2018 $1.5B $1.3B S&P FITCH AM BEST Note: Data as of June 30, 2021. Footnote explanations may be found in presentation endnotes. APOLLO INVESTOR DAY 2021 164
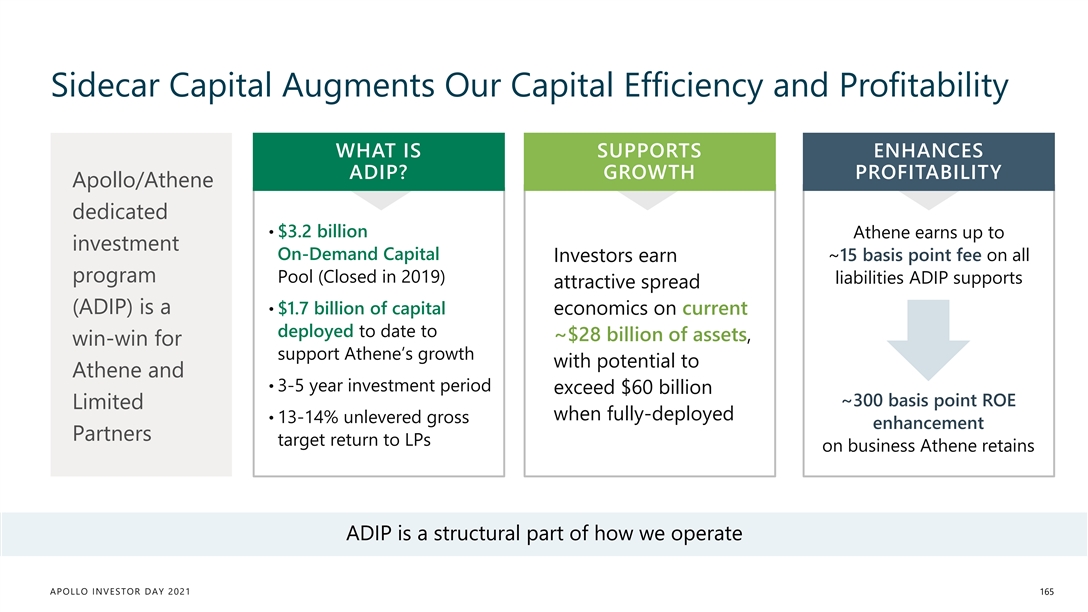
Sidecar Capital Augments Our Capital Efficiency and Profitability WHAT IS SUPPORTS ENHANCES ADIP? GROWTH PROFITABILITY Apollo/Athene dedicated • $3.2 billion Athene earns up to investment On-Demand Capital ~15 basis point fee on all Investors earn program Pool (Closed in 2019) liabilities ADIP supports attractive spread (ADIP) is a • $1.7 billion of capital economics on current deployed to date to ~$28 billion of assets, win-win for support Athene’s growth with potential to Athene and • 3-5 year investment period exceed $60 billion ~300 basis point ROE Limited when fully-deployed • 13-14% unlevered gross enhancement Partners target return to LPs on business Athene retains ADIP is a structural part of how we operate APOLLO INVESTOR DAY 2021 165Sidecar Capital Augments Our Capital Efficiency and Profitability WHAT IS SUPPORTS ENHANCES ADIP? GROWTH PROFITABILITY Apollo/Athene dedicated • $3.2 billion Athene earns up to investment On-Demand Capital ~15 basis point fee on all Investors earn program Pool (Closed in 2019) liabilities ADIP supports attractive spread (ADIP) is a • $1.7 billion of capital economics on current deployed to date to ~$28 billion of assets, win-win for support Athene’s growth with potential to Athene and • 3-5 year investment period exceed $60 billion ~300 basis point ROE Limited when fully-deployed • 13-14% unlevered gross enhancement Partners target return to LPs on business Athene retains ADIP is a structural part of how we operate APOLLO INVESTOR DAY 2021 165
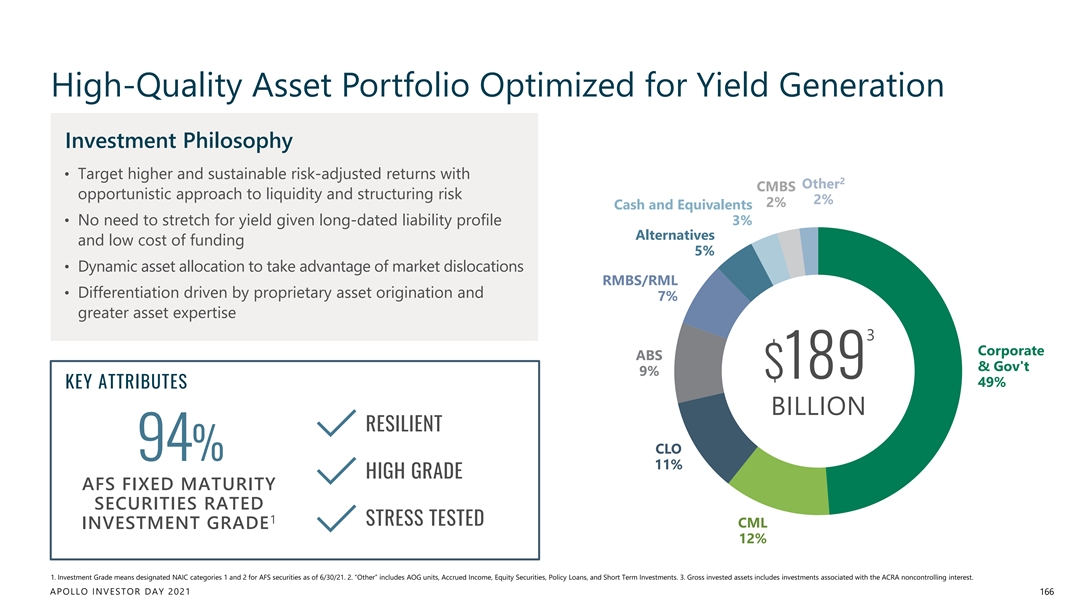
High-Quality Asset Portfolio Optimized for Yield Generation Investment Philosophy • Target higher and sustainable risk-adjusted returns with 2 Other CMBS opportunistic approach to liquidity and structuring risk 2% 2% Cash and Equivalents • No need to stretch for yield given long-dated liability profile 3% Alternatives and low cost of funding 5% • Dynamic asset allocation to take advantage of market dislocations RMBS/RML • Differentiation driven by proprietary asset origination and 7% greater asset expertise 3 Corporate ABS & Gov't 9% $189 49% KEY ATTRIBUTES BILLION RESILIENT CLO 94% 11% HIGH GRADE AFS FIXED MATURITY SECURITIES RATED 1 STRESS TESTED CML INVESTMENT GRADE 12% 1. Investment Grade means designated NAIC categories 1 and 2 for AFS securities as of 6/30/21. 2. “Other” includes AOG units, Accrued Income, Equity Securities, Policy Loans, and Short Term Investments. 3. Gross invested assets includes investments associated with the ACRA noncontrolling interest. APOLLO INVESTOR DAY 2021 166High-Quality Asset Portfolio Optimized for Yield Generation Investment Philosophy • Target higher and sustainable risk-adjusted returns with 2 Other CMBS opportunistic approach to liquidity and structuring risk 2% 2% Cash and Equivalents • No need to stretch for yield given long-dated liability profile 3% Alternatives and low cost of funding 5% • Dynamic asset allocation to take advantage of market dislocations RMBS/RML • Differentiation driven by proprietary asset origination and 7% greater asset expertise 3 Corporate ABS & Gov't 9% $189 49% KEY ATTRIBUTES BILLION RESILIENT CLO 94% 11% HIGH GRADE AFS FIXED MATURITY SECURITIES RATED 1 STRESS TESTED CML INVESTMENT GRADE 12% 1. Investment Grade means designated NAIC categories 1 and 2 for AFS securities as of 6/30/21. 2. “Other” includes AOG units, Accrued Income, Equity Securities, Policy Loans, and Short Term Investments. 3. Gross invested assets includes investments associated with the ACRA noncontrolling interest. APOLLO INVESTOR DAY 2021 166
Risk Management is Embedded in Everything We Do MANAGE ATHENE’S RISKS SUCH THAT IT CAN GROW PROFITABLY ACROSS VARIOUS MARKETS ATHENE’S RISK MANAGEMENT PRIORITIES • Robust risk management framework and procedures underpin focus on downside protection • Risk strategy, investment, ALM and liquidity compliance policies at the board and management levels • Stress testing plays a key role in defining risk appetite, with tests performed on both sides of the balance sheet Committed to transparency by publishing annual stress test: latest edition available October 19, 2021 APOLLO INVESTOR DAY 2021 167
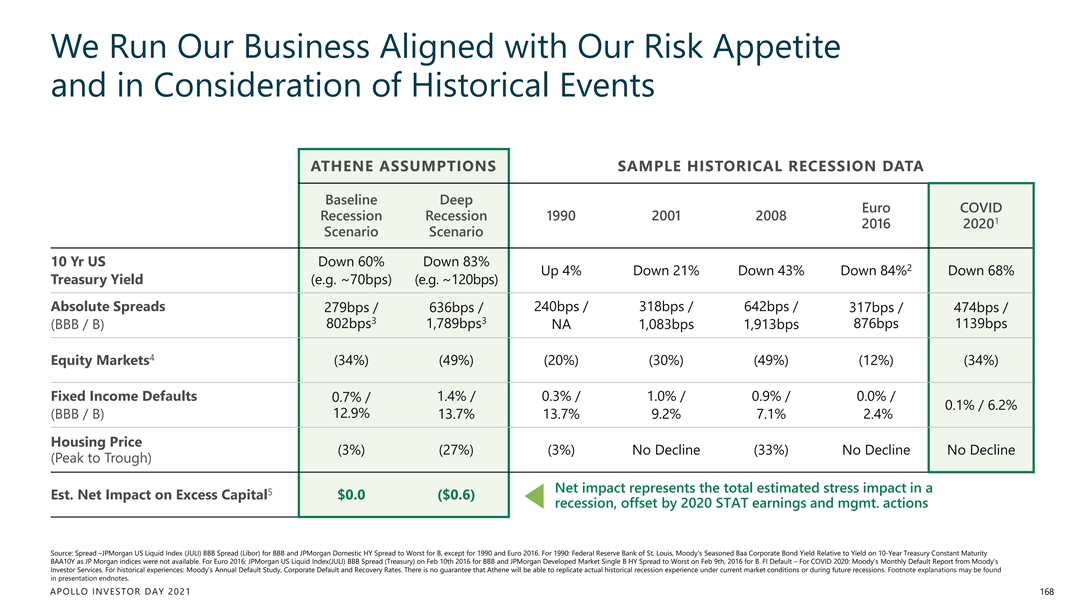
We Run Our Business Aligned with Our Risk Appetite and in Consideration of Historical Events ATHENE ASSUMPTIONS SAMPLE HISTORICAL RECESSION DATA Baseline Deep Euro COVID Recession Recession 1990 2001 2008 1 2016 2020 Scenario Scenario 10 Yr US Down 60% Down 83% 2 Up 4% Down 21% Down 43% Down 84% Down 68% Treasury Yield (e.g. ~70bps) (e.g. ~120bps) Absolute Spreads 240bps / 318bps / 642bps / 279bps / 636bps / 317bps / 474bps / 3 3 802bps 1,789bps 876bps 1139bps (BBB / B) NA 1,083bps 1,913bps 4 Equity Markets (34%) (49%) (20%) (30%) (49%) (12%) (34%) Fixed Income Defaults 1.4% / 0.3% / 1.0% / 0.9% / 0.0% / 0.7% / 0.1% / 6.2% 12.9% (BBB / B) 13.7% 13.7% 9.2% 7.1% 2.4% Housing Price (3%) (27%) (3%) No Decline (33%) No Decline No Decline (Peak to Trough) Net impact represents the total estimated stress impact in a 5 Est. Net Impact on Excess Capital $0.0 ($0.6) recession, offset by 2020 STAT earnings and mgmt. actions Source: Spread –JPMorgan US Liquid Index (JULI) BBB Spread (Libor) for BBB and JPMorgan Domestic HY Spread to Worst for B, except for 1990 and Euro 2016. For 1990: Federal Reserve Bank of St. Louis, Moody's Seasoned Baa Corporate Bond Yield Relative to Yield on 10-Year Treasury Constant Maturity BAA10Y as JP Morgan indices were not available. For Euro 2016: JPMorgan US Liquid Index(JULI) BBB Spread (Treasury) on Feb 10th 2016 for BBB and JPMorgan Developed Market Single B HY Spread to Worst on Feb 9th, 2016 for B. FI Default – For COVID 2020: Moody’s Monthly Default Report from Moody’s Investor Services. For historical experiences: Moody’s Annual Default Study, Corporate Default and Recovery Rates. There is no guarantee that Athene will be able to replicate actual historical recession experience under current market conditions or during future recessions. Footnote explanations may be found in presentation endnotes. APOLLO INVESTOR DAY 2021 168We Run Our Business Aligned with Our Risk Appetite and in Consideration of Historical Events ATHENE ASSUMPTIONS SAMPLE HISTORICAL RECESSION DATA Baseline Deep Euro COVID Recession Recession 1990 2001 2008 1 2016 2020 Scenario Scenario 10 Yr US Down 60% Down 83% 2 Up 4% Down 21% Down 43% Down 84% Down 68% Treasury Yield (e.g. ~70bps) (e.g. ~120bps) Absolute Spreads 240bps / 318bps / 642bps / 279bps / 636bps / 317bps / 474bps / 3 3 802bps 1,789bps 876bps 1139bps (BBB / B) NA 1,083bps 1,913bps 4 Equity Markets (34%) (49%) (20%) (30%) (49%) (12%) (34%) Fixed Income Defaults 1.4% / 0.3% / 1.0% / 0.9% / 0.0% / 0.7% / 0.1% / 6.2% 12.9% (BBB / B) 13.7% 13.7% 9.2% 7.1% 2.4% Housing Price (3%) (27%) (3%) No Decline (33%) No Decline No Decline (Peak to Trough) Net impact represents the total estimated stress impact in a 5 Est. Net Impact on Excess Capital $0.0 ($0.6) recession, offset by 2020 STAT earnings and mgmt. actions Source: Spread –JPMorgan US Liquid Index (JULI) BBB Spread (Libor) for BBB and JPMorgan Domestic HY Spread to Worst for B, except for 1990 and Euro 2016. For 1990: Federal Reserve Bank of St. Louis, Moody's Seasoned Baa Corporate Bond Yield Relative to Yield on 10-Year Treasury Constant Maturity BAA10Y as JP Morgan indices were not available. For Euro 2016: JPMorgan US Liquid Index(JULI) BBB Spread (Treasury) on Feb 10th 2016 for BBB and JPMorgan Developed Market Single B HY Spread to Worst on Feb 9th, 2016 for B. FI Default – For COVID 2020: Moody’s Monthly Default Report from Moody’s Investor Services. For historical experiences: Moody’s Annual Default Study, Corporate Default and Recovery Rates. There is no guarantee that Athene will be able to replicate actual historical recession experience under current market conditions or during future recessions. Footnote explanations may be found in presentation endnotes. APOLLO INVESTOR DAY 2021 168
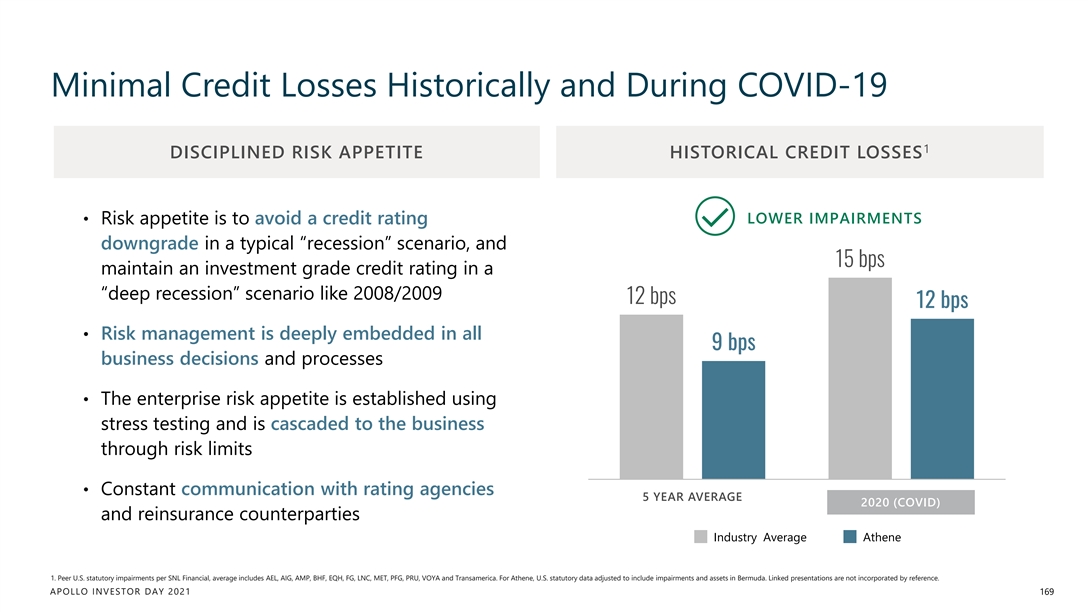
Minimal Credit Losses Historically and During COVID-19 1 DISCIPLINED RISK APPETITE HISTORICAL CREDIT LOSSES • Risk appetite is to avoid a credit rating LOWER IMPAIRMENTS downgrade in a typical “recession” scenario, and 15 bps maintain an investment grade credit rating in a “deep recession” scenario like 2008/2009 12 bps 12 bps • Risk management is deeply embedded in all 9 bps business decisions and processes • The enterprise risk appetite is established using stress testing and is cascaded to the business through risk limits • Constant communication with rating agencies 5 YEAR AVERAGE 2020 2020 (COVID) and reinsurance counterparties Industry Average Athene 1. Peer U.S. statutory impairments per SNL Financial, average includes AEL, AIG, AMP, BHF, EQH, FG, LNC, MET, PFG, PRU, VOYA and Transamerica. For Athene, U.S. statutory data adjusted to include impairments and assets in Bermuda. Linked presentations are not incorporated by reference. APOLLO INVESTOR DAY 2021 169Minimal Credit Losses Historically and During COVID-19 1 DISCIPLINED RISK APPETITE HISTORICAL CREDIT LOSSES • Risk appetite is to avoid a credit rating LOWER IMPAIRMENTS downgrade in a typical “recession” scenario, and 15 bps maintain an investment grade credit rating in a “deep recession” scenario like 2008/2009 12 bps 12 bps • Risk management is deeply embedded in all 9 bps business decisions and processes • The enterprise risk appetite is established using stress testing and is cascaded to the business through risk limits • Constant communication with rating agencies 5 YEAR AVERAGE 2020 2020 (COVID) and reinsurance counterparties Industry Average Athene 1. Peer U.S. statutory impairments per SNL Financial, average includes AEL, AIG, AMP, BHF, EQH, FG, LNC, MET, PFG, PRU, VOYA and Transamerica. For Athene, U.S. statutory data adjusted to include impairments and assets in Bermuda. Linked presentations are not incorporated by reference. APOLLO INVESTOR DAY 2021 169
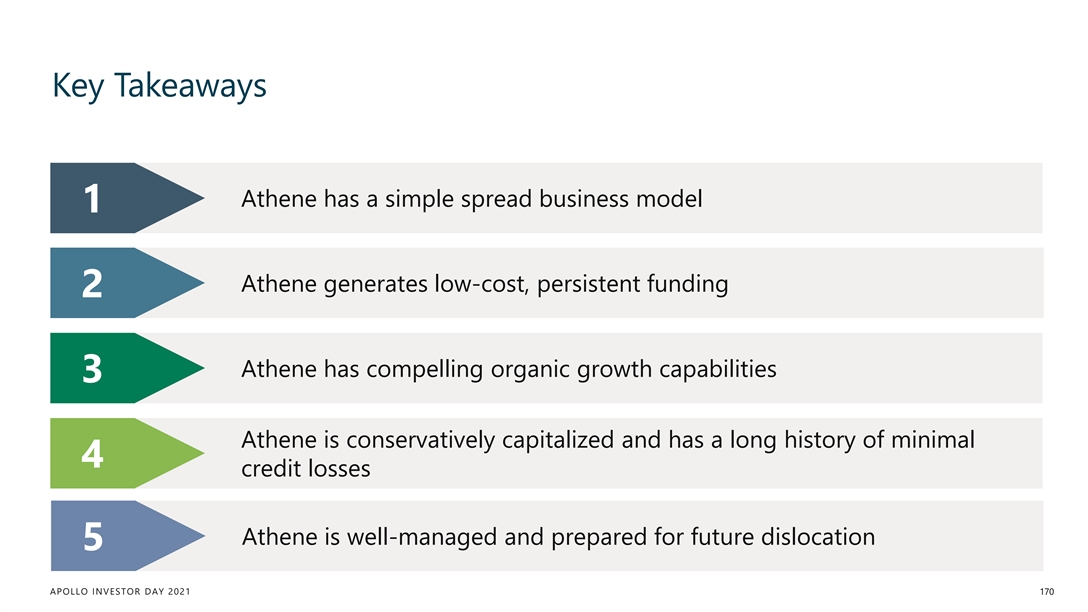
Key Takeaways Athene has a simple spread business model 1 Athene generates low-cost, persistent funding 2 Athene has compelling organic growth capabilities 3 Athene is conservatively capitalized and has a long history of minimal 4 credit losses Athene is well-managed and prepared for future dislocation 5 APOLLO INVESTOR DAY 2021 170Key Takeaways Athene has a simple spread business model 1 Athene generates low-cost, persistent funding 2 Athene has compelling organic growth capabilities 3 Athene is conservatively capitalized and has a long history of minimal 4 credit losses Athene is well-managed and prepared for future dislocation 5 APOLLO INVESTOR DAY 2021 170
Client & Product Solutions STEPHANIE DRESCHER Chief Client & Product Development Officer APOLLO INVESTOR DAY 2021Client & Product Solutions STEPHANIE DRESCHER Chief Client & Product Development Officer APOLLO INVESTOR DAY 2021
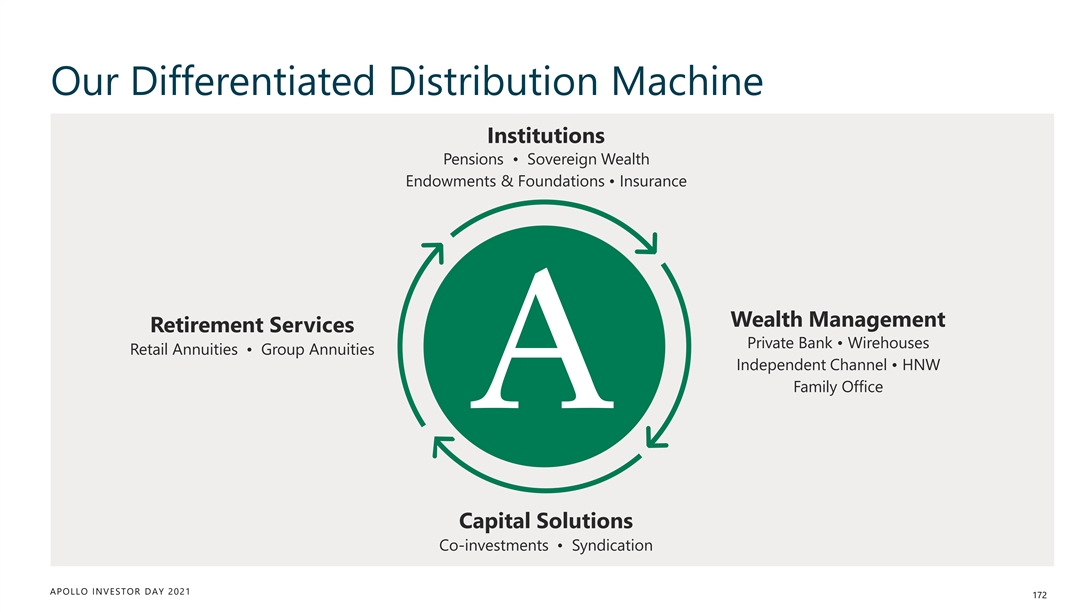
Our Differentiated Distribution Machine Institutions Pensions • Sovereign Wealth Endowments & Foundations • Insurance Wealth Management Retirement Services Private Bank • Wirehouses Retail Annuities • Group Annuities Independent Channel • HNW Family Office Capital Solutions Co-investments • Syndication APOLLO INVESTOR DAY 2021 172Our Differentiated Distribution Machine Institutions Pensions • Sovereign Wealth Endowments & Foundations • Insurance Wealth Management Retirement Services Private Bank • Wirehouses Retail Annuities • Group Annuities Independent Channel • HNW Family Office Capital Solutions Co-investments • Syndication APOLLO INVESTOR DAY 2021 172
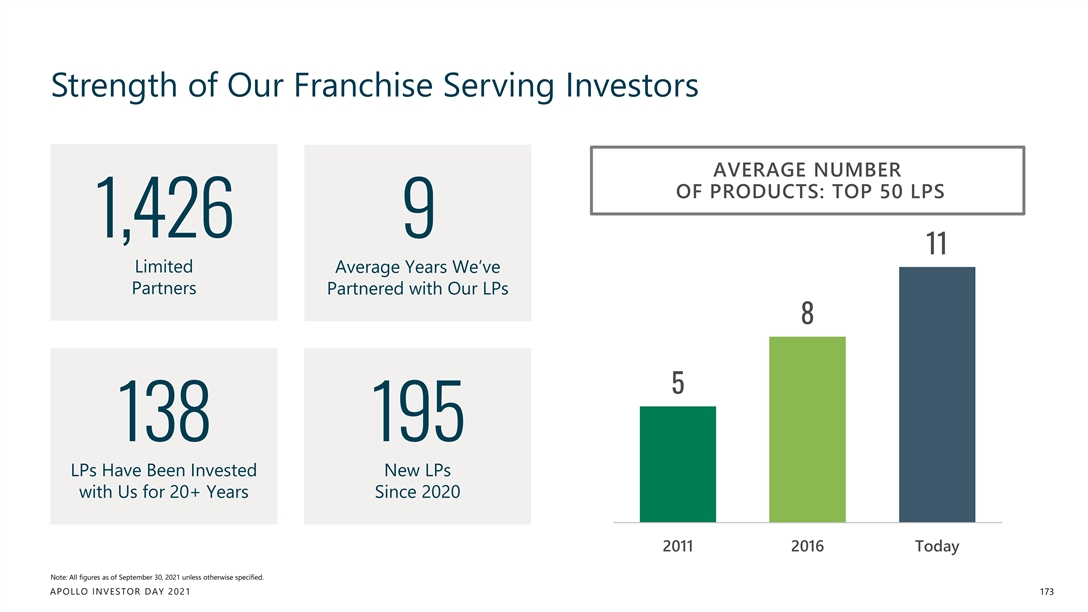
Strength of Our Franchise Serving Investors AVERAGE NUMBER OF PRODUCTS: TOP 50 LPS 1,426 9 11 Limited Average Years We’ve Partners Partnered with Our LPs 8 5 138 195 LPs Have Been Invested New LPs with Us for 20+ Years Since 2020 2011 2016 Today Note: All figures as of September 30, 2021 unless otherwise specified. APOLLO INVESTOR DAY 2021 173
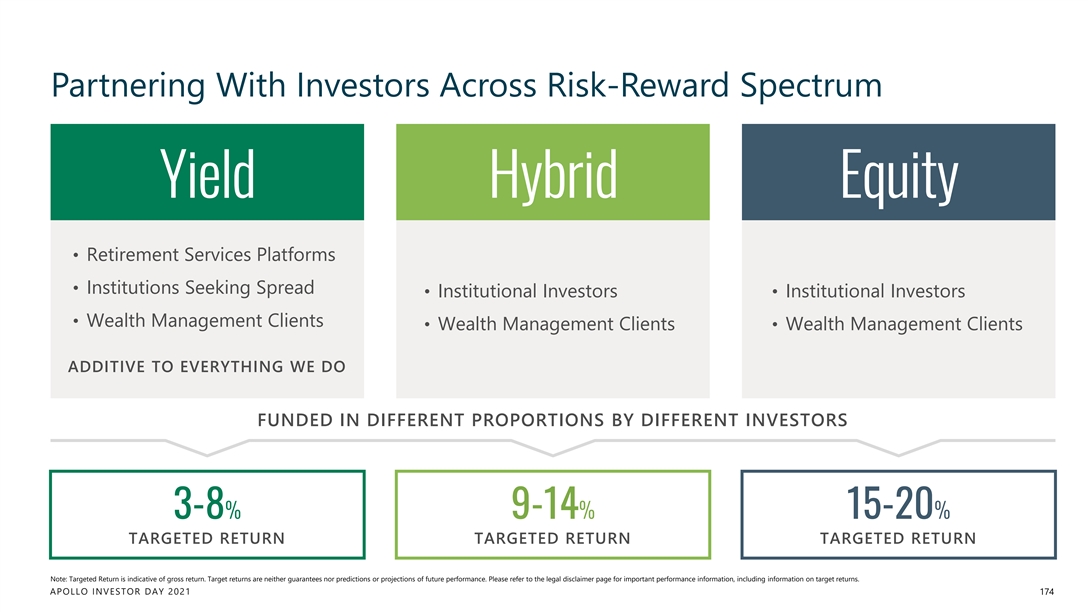
Partnering With Investors Across Risk-Reward Spectrum Yield Hybrid Equity • Retirement Services Platforms • Institutions Seeking Spread • Institutional Investors • Institutional Investors • Wealth Management Clients • Wealth Management Clients • Wealth Management Clients ADDITIVE TO EVERYTHING WE DO FUNDED IN DIFFERENT PROPORTIONS BY DIFFERENT INVESTORS 3-8% 9-14% 15-20% TARGETED RETURN TARGETED RETURN TARGETED RETURN Note: Targeted Return is indicative of gross return. Target returns are neither guarantees nor predictions or projections of future performance. Please refer to the legal disclaimer page for important performance information, including information on target returns. APOLLO INVESTOR DAY 2021 174Partnering With Investors Across Risk-Reward Spectrum Yield Hybrid Equity • Retirement Services Platforms • Institutions Seeking Spread • Institutional Investors • Institutional Investors • Wealth Management Clients • Wealth Management Clients • Wealth Management Clients ADDITIVE TO EVERYTHING WE DO FUNDED IN DIFFERENT PROPORTIONS BY DIFFERENT INVESTORS 3-8% 9-14% 15-20% TARGETED RETURN TARGETED RETURN TARGETED RETURN Note: Targeted Return is indicative of gross return. Target returns are neither guarantees nor predictions or projections of future performance. Please refer to the legal disclaimer page for important performance information, including information on target returns. APOLLO INVESTOR DAY 2021 174
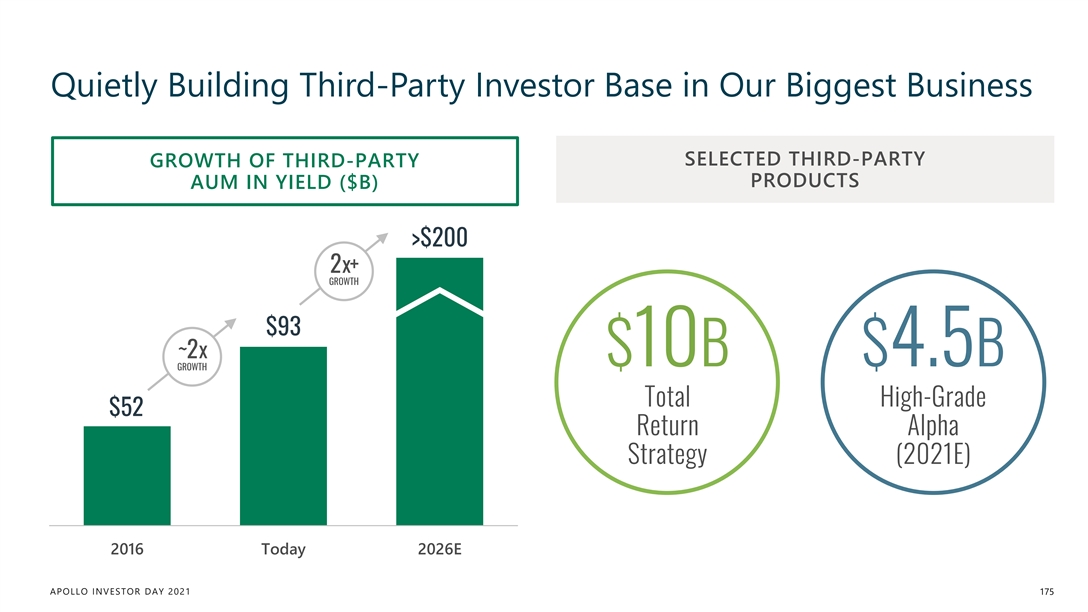
Quietly Building Third-Party Investor Base in Our Biggest Business SELECTED THIRD-PARTY GROWTH OF THIRD-PARTY PRODUCTS AUM IN YIELD ($B) >$200 2x+ GROWTH $93 ~2x $10B $4.5B GROWTH Total High-Grade $52 Return Alpha Strategy (2021E) 2016 Today 2026E APOLLO INVESTOR DAY 2021 175Quietly Building Third-Party Investor Base in Our Biggest Business SELECTED THIRD-PARTY GROWTH OF THIRD-PARTY PRODUCTS AUM IN YIELD ($B) >$200 2x+ GROWTH $93 ~2x $10B $4.5B GROWTH Total High-Grade $52 Return Alpha Strategy (2021E) 2016 Today 2026E APOLLO INVESTOR DAY 2021 175
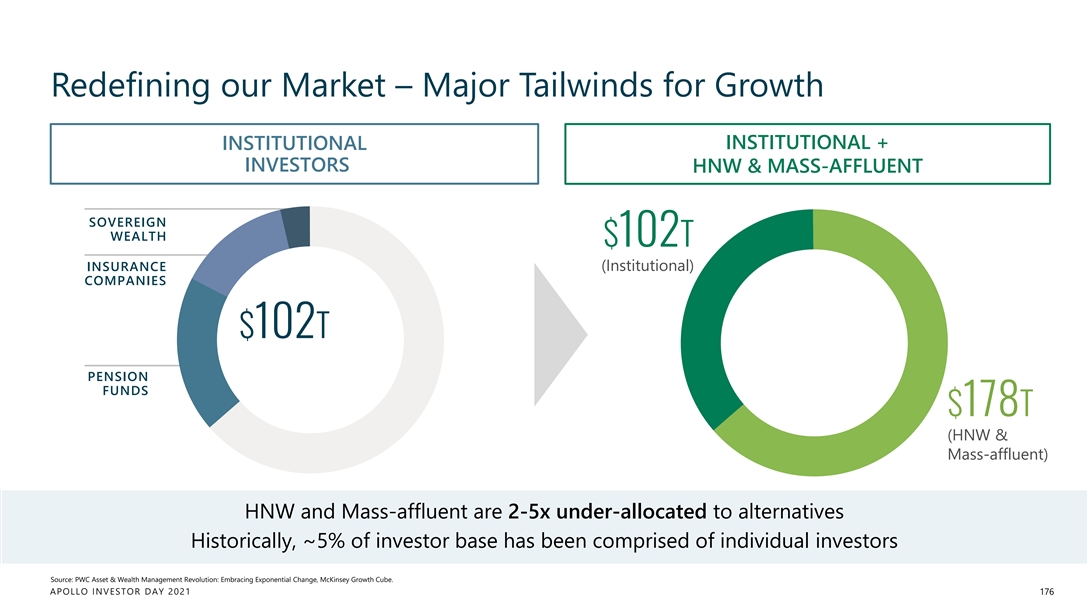
Redefining our Market – Major Tailwinds for Growth INSTITUTIONAL + INSTITUTIONAL INVESTORS HNW & MASS-AFFLUENT SOVEREIGN WEALTH $102T INSURANCE (Institutional) COMPANIES $102T PENSION FUNDS $178T (HNW & Mass-affluent) HNW and Mass-affluent are 2-5x under-allocated to alternatives Historically, ~5% of investor base has been comprised of individual investors Source: PWC Asset & Wealth Management Revolution: Embracing Exponential Change, McKinsey Growth Cube. APOLLO INVESTOR DAY 2021 176Redefining our Market – Major Tailwinds for Growth INSTITUTIONAL + INSTITUTIONAL INVESTORS HNW & MASS-AFFLUENT SOVEREIGN WEALTH $102T INSURANCE (Institutional) COMPANIES $102T PENSION FUNDS $178T (HNW & Mass-affluent) HNW and Mass-affluent are 2-5x under-allocated to alternatives Historically, ~5% of investor base has been comprised of individual investors Source: PWC Asset & Wealth Management Revolution: Embracing Exponential Change, McKinsey Growth Cube. APOLLO INVESTOR DAY 2021 176
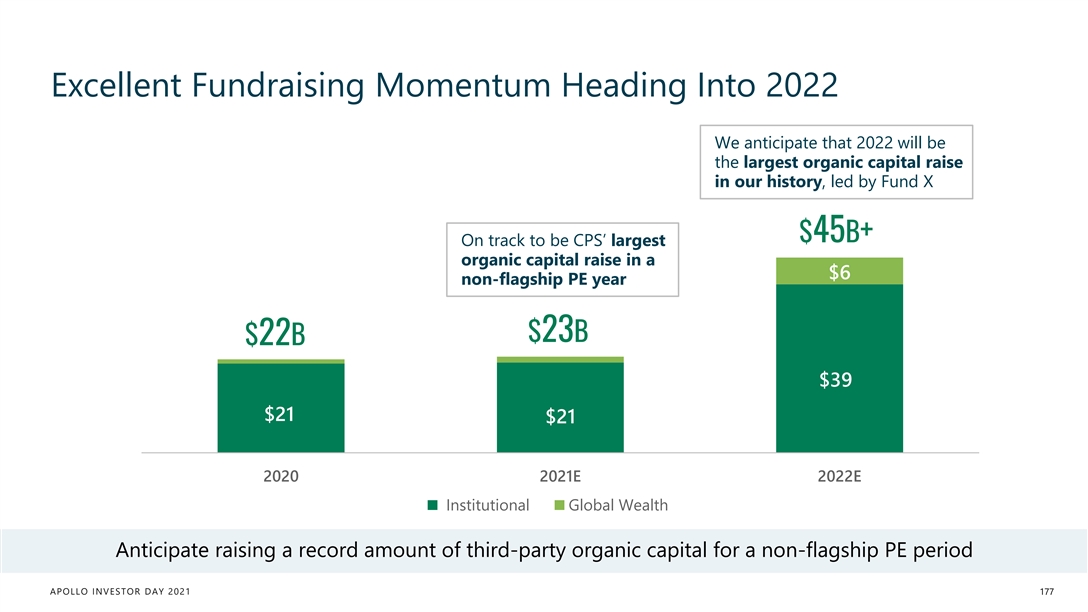
Excellent Fundraising Momentum Heading Into 2022 We anticipate that 2022 will be the largest organic capital raise in our history, led by Fund X $45B+ On track to be CPS’ largest organic capital raise in a $6 non-flagship PE year $23B $22B $39 $21 $21 2020 2021E 2022E Institutional Global Wealth Anticipate raising a record amount of third-party organic capital for a non-flagship PE period APOLLO INVESTOR DAY 2021 177Excellent Fundraising Momentum Heading Into 2022 We anticipate that 2022 will be the largest organic capital raise in our history, led by Fund X $45B+ On track to be CPS’ largest organic capital raise in a $6 non-flagship PE year $23B $22B $39 $21 $21 2020 2021E 2022E Institutional Global Wealth Anticipate raising a record amount of third-party organic capital for a non-flagship PE period APOLLO INVESTOR DAY 2021 177
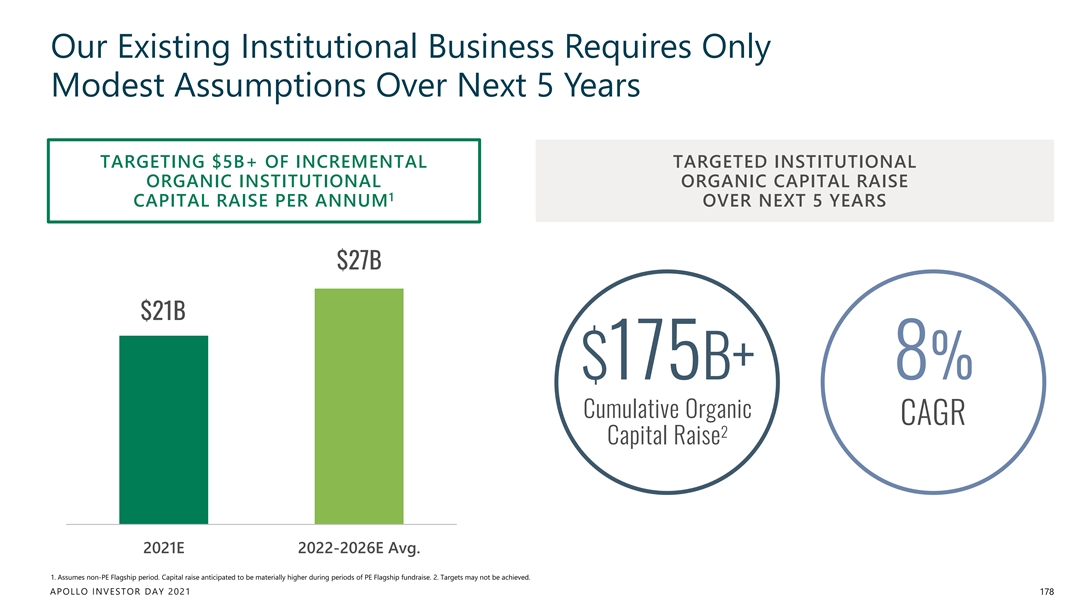
Our Existing Institutional Business Requires Only Modest Assumptions Over Next 5 Years TARGETING $5B+ OF INCREMENTAL TARGETED INSTITUTIONAL ORGANIC INSTITUTIONAL ORGANIC CAPITAL RAISE 1 CAPITAL RAISE PER ANNUM OVER NEXT 5 YEARS $27B $21B $175B+ 8% Cumulative Organic CAGR 2 Capital Raise 2021E 2022-2026E Avg. 1. Assumes non-PE Flagship period. Capital raise anticipated to be materially higher during periods of PE Flagship fundraise. 2. Targets may not be achieved. APOLLO INVESTOR DAY 2021 178
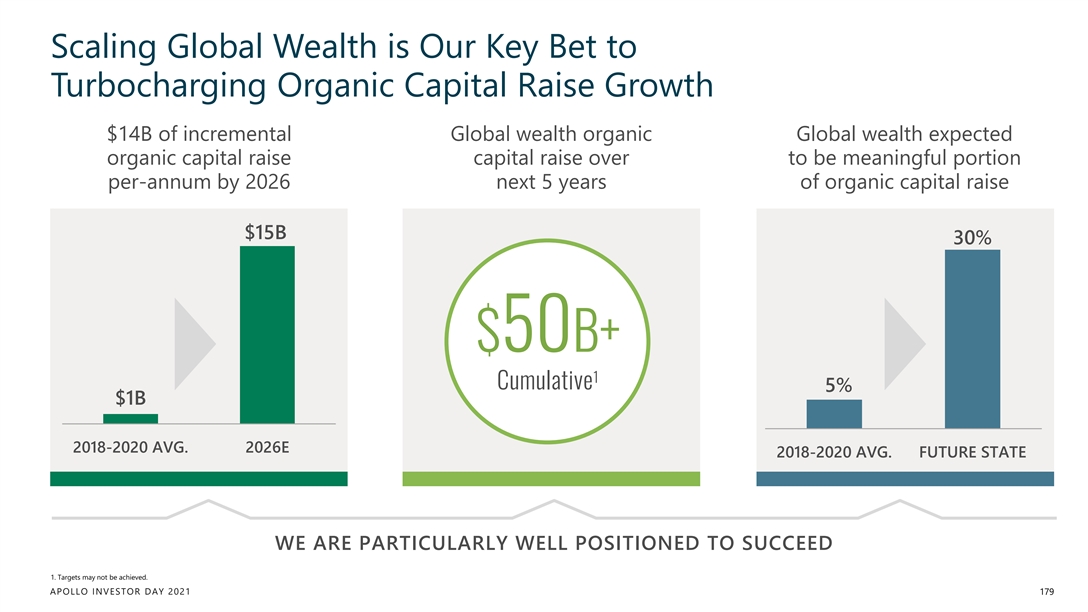
Scaling Global Wealth is Our Key Bet to Turbocharging Organic Capital Raise Growth $14B of incremental Global wealth organic Global wealth expected organic capital raise capital raise over to be meaningful portion per-annum by 2026 next 5 years of organic capital raise $15B 30% $50B+ 1 Cumulative 5% $1B 2018-2020 AVG. 2026E 2018-2020 AVG. FUTURE STATE WE ARE PARTICULARLY WELL POSITIONED TO SUCCEED 1. Targets may not be achieved. APOLLO INVESTOR DAY 2021 179Scaling Global Wealth is Our Key Bet to Turbocharging Organic Capital Raise Growth $14B of incremental Global wealth organic Global wealth expected organic capital raise capital raise over to be meaningful portion per-annum by 2026 next 5 years of organic capital raise $15B 30% $50B+ 1 Cumulative 5% $1B 2018-2020 AVG. 2026E 2018-2020 AVG. FUTURE STATE WE ARE PARTICULARLY WELL POSITIONED TO SUCCEED 1. Targets may not be achieved. APOLLO INVESTOR DAY 2021 179
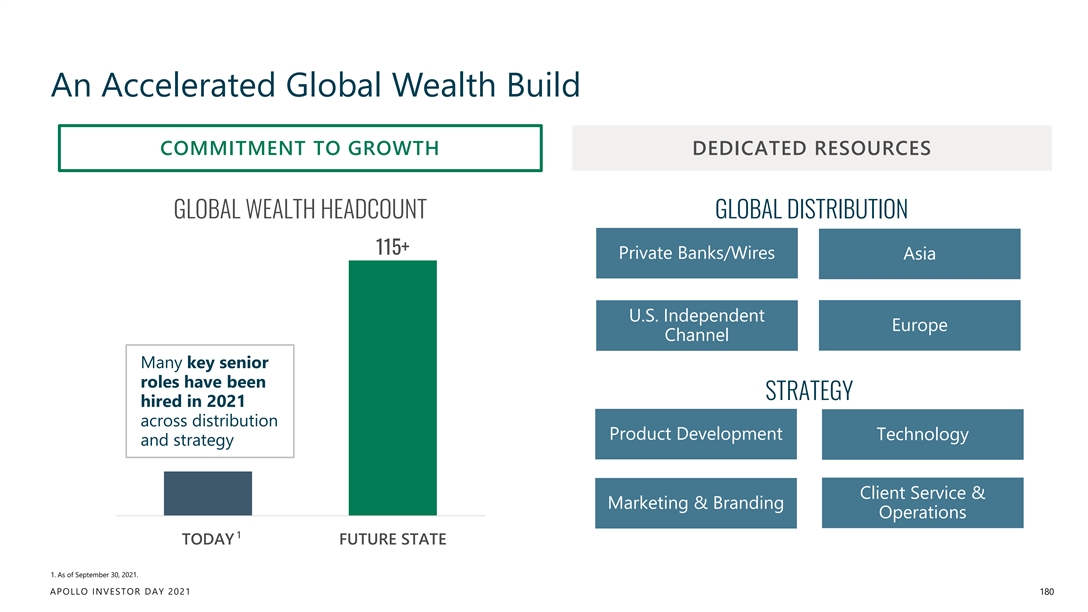
An Accelerated Global Wealth Build COMMITMENT TO GROWTH DEDICATED RESOURCES GLOBAL WEALTH HEADCOUNT GLOBAL DISTRIBUTION 115+ Private Banks/Wires Asia U.S. Independent Europe Channel Many key senior roles have been STRATEGY hired in 2021 across distribution Product Development Technology and strategy Client Service & Marketing & Branding Operations 1 TODAY FUTURE STATE 1. As of September 30, 2021. APOLLO INVESTOR DAY 2021 180An Accelerated Global Wealth Build COMMITMENT TO GROWTH DEDICATED RESOURCES GLOBAL WEALTH HEADCOUNT GLOBAL DISTRIBUTION 115+ Private Banks/Wires Asia U.S. Independent Europe Channel Many key senior roles have been STRATEGY hired in 2021 across distribution Product Development Technology and strategy Client Service & Marketing & Branding Operations 1 TODAY FUTURE STATE 1. As of September 30, 2021. APOLLO INVESTOR DAY 2021 180
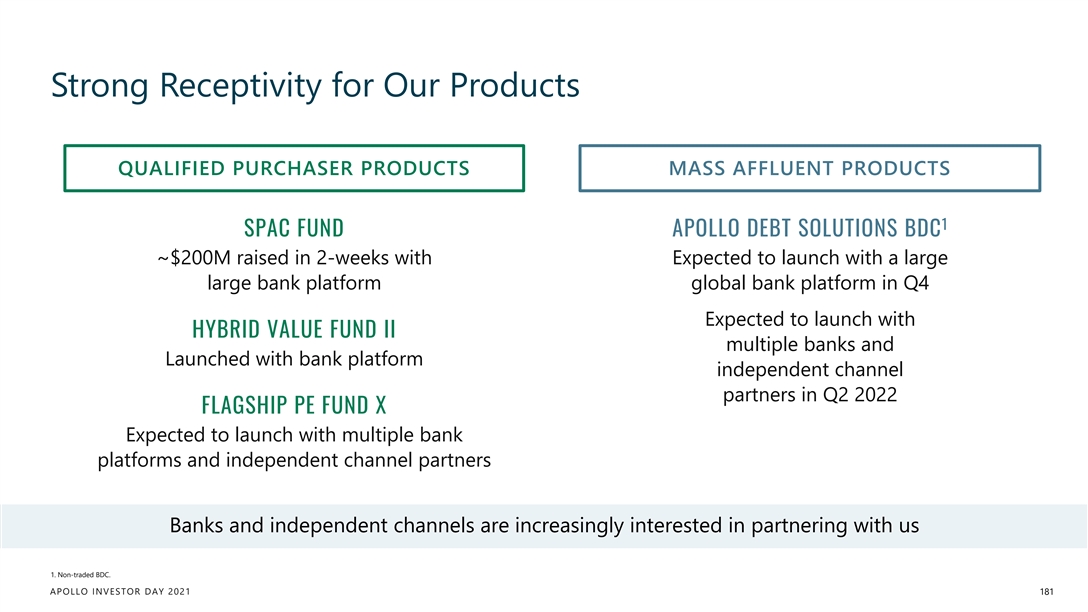
Strong Receptivity for Our Products QUALIFIED PURCHASER PRODUCTS MASS AFFLUENT PRODUCTS 1 SPAC FUND APOLLO DEBT SOLUTIONS BDC ~$200M raised in 2-weeks with Expected to launch with a large large bank platform global bank platform in Q4 Expected to launch with HYBRID VALUE FUND II multiple banks and Launched with bank platform independent channel partners in Q2 2022 FLAGSHIP PE FUND X Expected to launch with multiple bank platforms and independent channel partners Banks and independent channels are increasingly interested in partnering with us 1. Non-traded BDC. APOLLO INVESTOR DAY 2021 181Strong Receptivity for Our Products QUALIFIED PURCHASER PRODUCTS MASS AFFLUENT PRODUCTS 1 SPAC FUND APOLLO DEBT SOLUTIONS BDC ~$200M raised in 2-weeks with Expected to launch with a large large bank platform global bank platform in Q4 Expected to launch with HYBRID VALUE FUND II multiple banks and Launched with bank platform independent channel partners in Q2 2022 FLAGSHIP PE FUND X Expected to launch with multiple bank platforms and independent channel partners Banks and independent channels are increasingly interested in partnering with us 1. Non-traded BDC. APOLLO INVESTOR DAY 2021 181
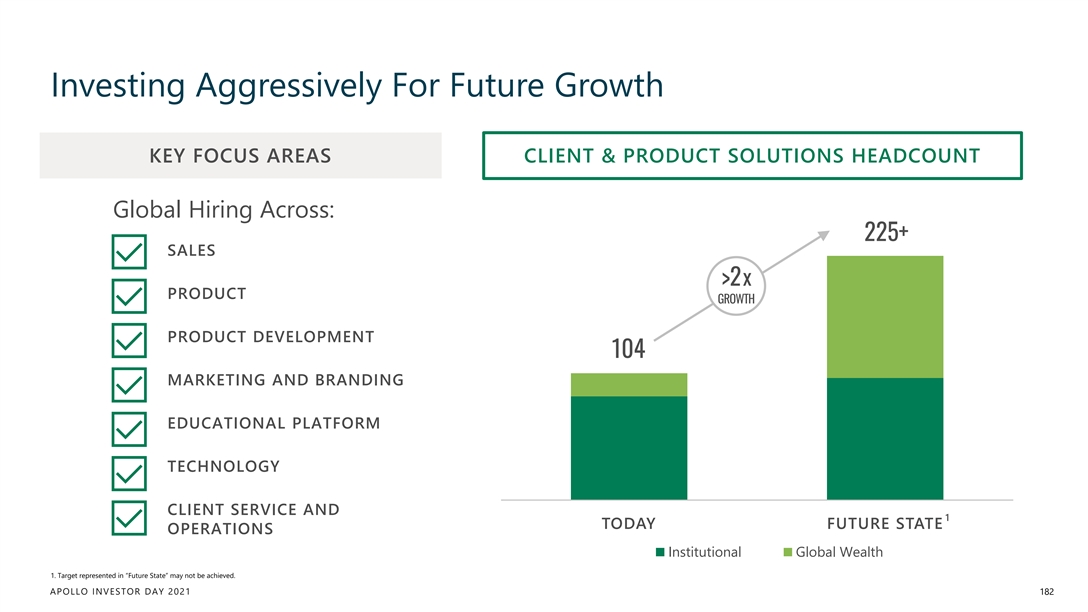
Investing Aggressively For Future Growth KEY FOCUS AREAS CLIENT & PRODUCT SOLUTIONS HEADCOUNT Global Hiring Across: 225+ SALES >2x PRODUCT GROWTH PRODUCT DEVELOPMENT 104 MARKETING AND BRANDING EDUCATIONAL PLATFORM TECHNOLOGY CLIENT SERVICE AND 1 TODAY FUTURE STATE OPERATIONS Institutional Global Wealth 1. Target represented in “Future State” may not be achieved. APOLLO INVESTOR DAY 2021 182Investing Aggressively For Future Growth KEY FOCUS AREAS CLIENT & PRODUCT SOLUTIONS HEADCOUNT Global Hiring Across: 225+ SALES >2x PRODUCT GROWTH PRODUCT DEVELOPMENT 104 MARKETING AND BRANDING EDUCATIONAL PLATFORM TECHNOLOGY CLIENT SERVICE AND 1 TODAY FUTURE STATE OPERATIONS Institutional Global Wealth 1. Target represented in “Future State” may not be achieved. APOLLO INVESTOR DAY 2021 182
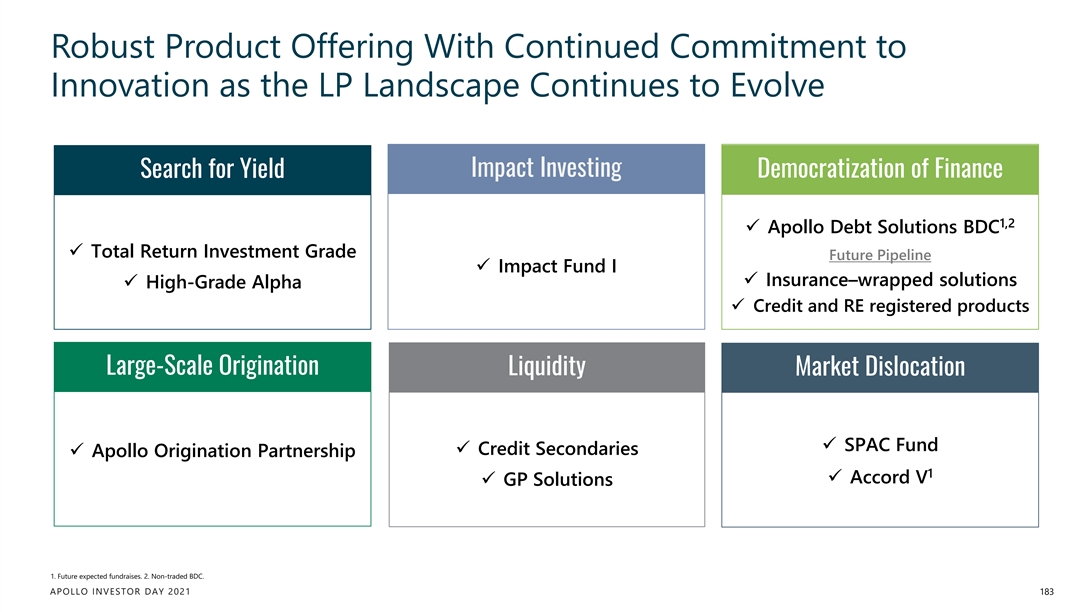
Robust Product Offering With Continued Commitment to Innovation as the LP Landscape Continues to Evolve Impact Investing Search for Yield Democratization of Finance 1,2 ü Apollo Debt Solutions BDC ü Total Return Investment Grade Future Pipeline ü Impact Fund I ü Insurance–wrapped solutions ü High-Grade Alpha ü Credit and RE registered products Large-Scale Origination Liquidity Market Dislocation ü SPAC Fund ü Credit Secondaries ü Apollo Origination Partnership 1 ü Accord V ü GP Solutions 1. Future expected fundraises. 2. Non-traded BDC. APOLLO INVESTOR DAY 2021 183Robust Product Offering With Continued Commitment to Innovation as the LP Landscape Continues to Evolve Impact Investing Search for Yield Democratization of Finance 1,2 ü Apollo Debt Solutions BDC ü Total Return Investment Grade Future Pipeline ü Impact Fund I ü Insurance–wrapped solutions ü High-Grade Alpha ü Credit and RE registered products Large-Scale Origination Liquidity Market Dislocation ü SPAC Fund ü Credit Secondaries ü Apollo Origination Partnership 1 ü Accord V ü GP Solutions 1. Future expected fundraises. 2. Non-traded BDC. APOLLO INVESTOR DAY 2021 183
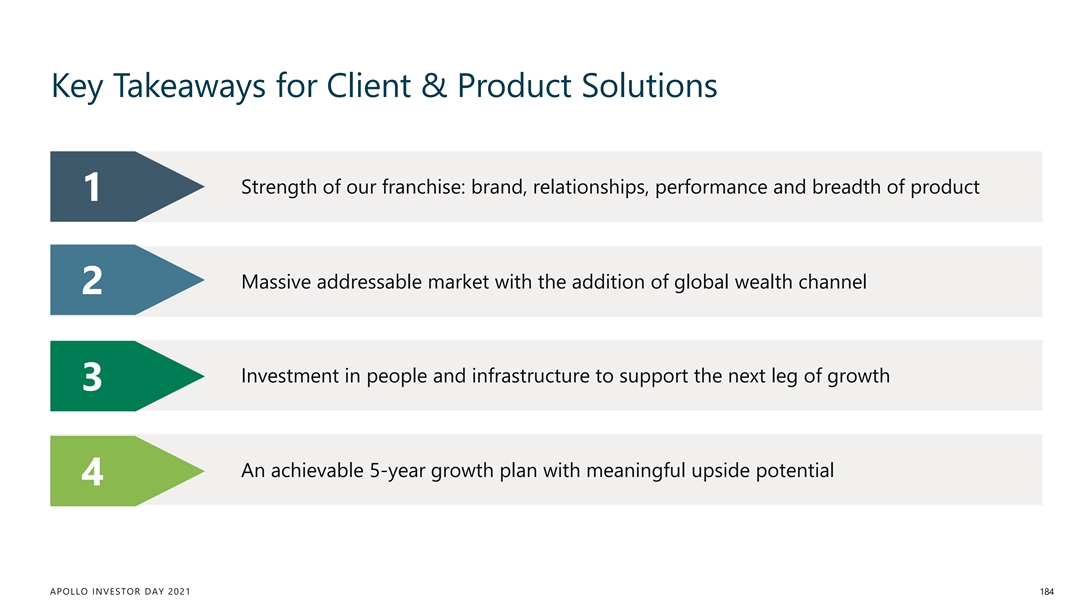
Key Takeaways for Client & Product Solutions Strength of our franchise: brand, relationships, performance and breadth of product 1 Massive addressable market with the addition of global wealth channel 2 Investment in people and infrastructure to support the next leg of growth 3 An achievable 5-year growth plan with meaningful upside potential 4 APOLLO INVESTOR DAY 2021 184
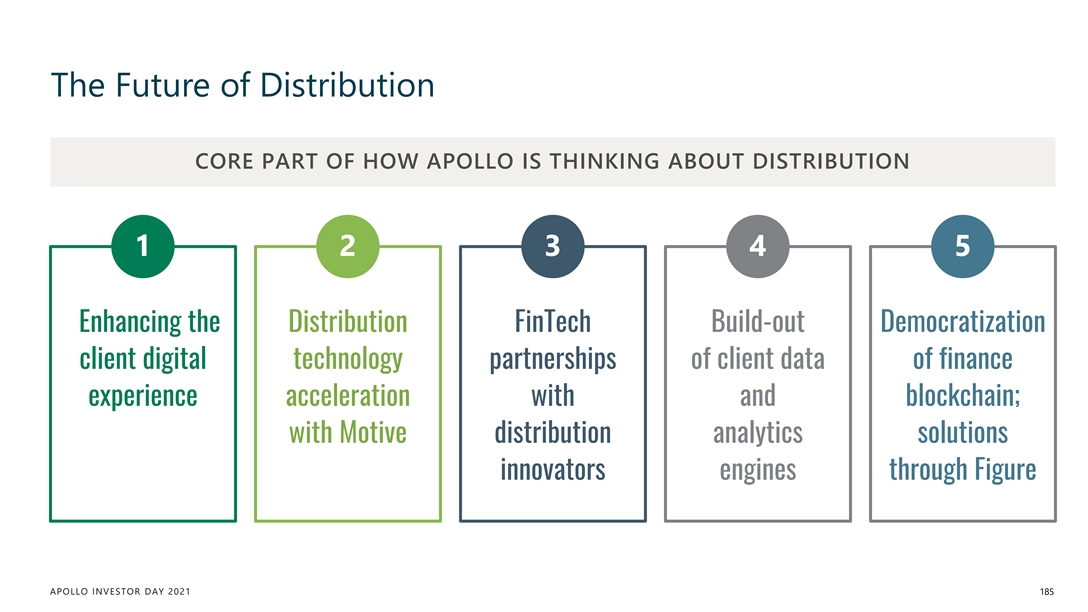
The Future of Distribution CORE PART OF HOW APOLLO IS THINKING ABOUT DISTRIBUTION 1 2 3 4 5 Enhancing the Distribution FinTech Build-out Democratization client digital technology partnerships of client data of finance experience acceleration with and blockchain; with Motive distribution analytics solutions innovators engines through Figure APOLLO INVESTOR DAY 2021 185The Future of Distribution CORE PART OF HOW APOLLO IS THINKING ABOUT DISTRIBUTION 1 2 3 4 5 Enhancing the Distribution FinTech Build-out Democratization client digital technology partnerships of client data of finance experience acceleration with and blockchain; with Motive distribution analytics solutions innovators engines through Figure APOLLO INVESTOR DAY 2021 185

FinTech BLYTHE MASTERS Founding Partner, Motive Partners APOLLO INVESTOR DAY 2021FinTech BLYTHE MASTERS Founding Partner, Motive Partners APOLLO INVESTOR DAY 2021
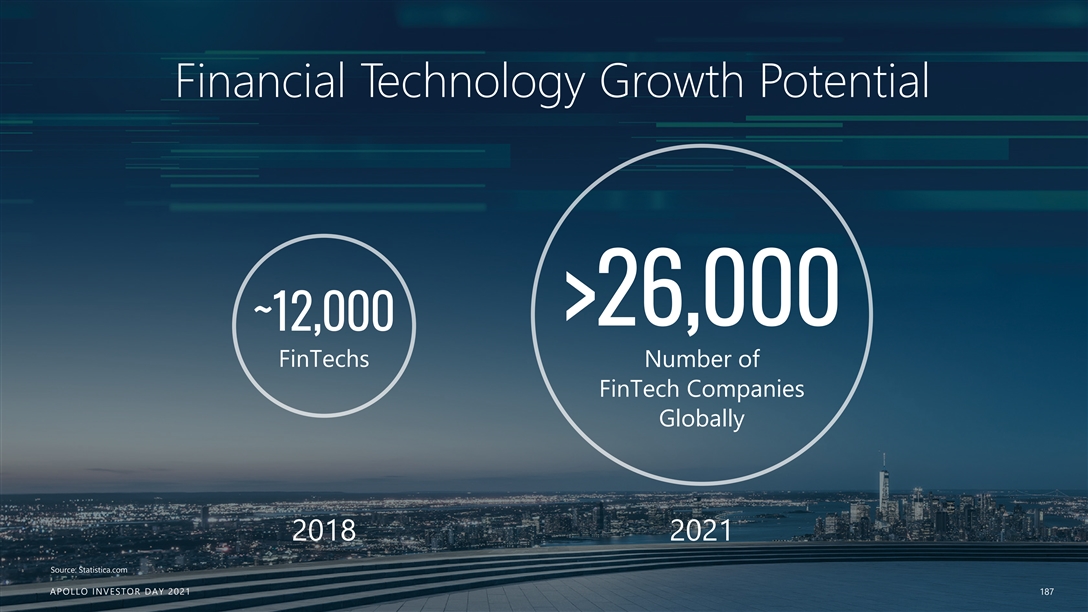
Financial Technology Growth Potential >26,000 ~12,000 FinTechs Number of FinTech Companies Globally 2018 2021 Source: Statistica.com A AP PO OL LL LO O IIN NV VE ES ST TO OR R D DA AY Y 2021 2021 187Financial Technology Growth Potential >26,000 ~12,000 FinTechs Number of FinTech Companies Globally 2018 2021 Source: Statistica.com A AP PO OL LL LO O IIN NV VE ES ST TO OR R D DA AY Y 2021 2021 187
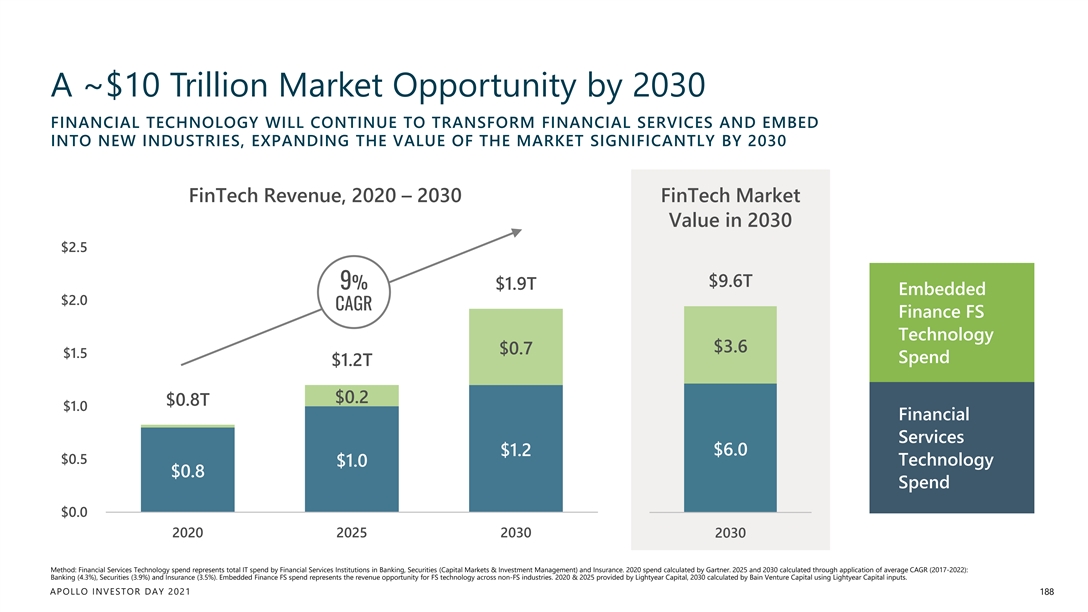
A ~$10 Trillion Market Opportunity by 2030 FINANCIAL TECHNOLOGY WILL CONTINUE TO TRANSFORM FINANCIAL SERVICES AND EMBED INTO NEW INDUSTRIES, EXPANDING THE VALUE OF THE MARKET SIGNIFICANTLY BY 2030 FinTech Revenue, 2020 – 2030 FinTech Market Value in 2030 $2.5 $9.6T 9% $1.9T Embedded $2.0 CAGR Finance FS Technology $3.6 $0.7 $1.5 Spend $1.2T $0.2 $0.8T $1.0 Financial Services $1.2 $6.0 $0.5 Technology $1.0 $0.8 Spend $0.0 2020 2025 2030 2030 Method: Financial Services Technology spend represents total IT spend by Financial Services Institutions in Banking, Securities (Capital Markets & Investment Management) and Insurance. 2020 spend calculated by Gartner. 2025 and 2030 calculated through application of average CAGR (2017-2022): Banking (4.3%), Securities (3.9%) and Insurance (3.5%). Embedded Finance FS spend represents the revenue opportunity for FS technology across non-FS industries. 2020 & 2025 provided by Lightyear Capital, 2030 calculated by Bain Venture Capital using Lightyear Capital inputs. APOLLO INVESTOR DAY 2021 188A ~$10 Trillion Market Opportunity by 2030 FINANCIAL TECHNOLOGY WILL CONTINUE TO TRANSFORM FINANCIAL SERVICES AND EMBED INTO NEW INDUSTRIES, EXPANDING THE VALUE OF THE MARKET SIGNIFICANTLY BY 2030 FinTech Revenue, 2020 – 2030 FinTech Market Value in 2030 $2.5 $9.6T 9% $1.9T Embedded $2.0 CAGR Finance FS Technology $3.6 $0.7 $1.5 Spend $1.2T $0.2 $0.8T $1.0 Financial Services $1.2 $6.0 $0.5 Technology $1.0 $0.8 Spend $0.0 2020 2025 2030 2030 Method: Financial Services Technology spend represents total IT spend by Financial Services Institutions in Banking, Securities (Capital Markets & Investment Management) and Insurance. 2020 spend calculated by Gartner. 2025 and 2030 calculated through application of average CAGR (2017-2022): Banking (4.3%), Securities (3.9%) and Insurance (3.5%). Embedded Finance FS spend represents the revenue opportunity for FS technology across non-FS industries. 2020 & 2025 provided by Lightyear Capital, 2030 calculated by Bain Venture Capital using Lightyear Capital inputs. APOLLO INVESTOR DAY 2021 188
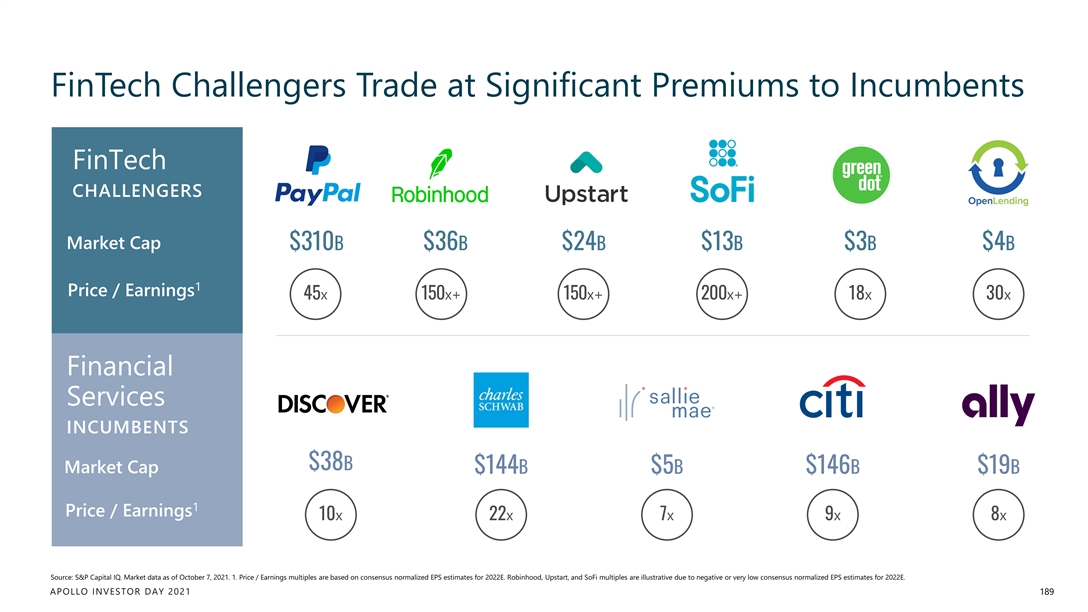
FinTech Challengers Trade at Significant Premiums to Incumbents FinTech CHALLENGERS Market Cap $310B $36B $24B $13B $3B $4B 1 Price / Earnings 45x 150x+ 150x+ 200x+ 18x 30x Financial Services INCUMBENTS $38B Market Cap $144B $5B $146B $19B 1 Price / Earnings 10x 22x 7x 9x 8x Source: S&P Capital IQ. Market data as of October 7, 2021. 1. Price / Earnings multiples are based on consensus normalized EPS estimates for 2022E. Robinhood, Upstart, and SoFi multiples are illustrative due to negative or very low consensus normalized EPS estimates for 2022E. APOLLO INVESTOR DAY 2021 189
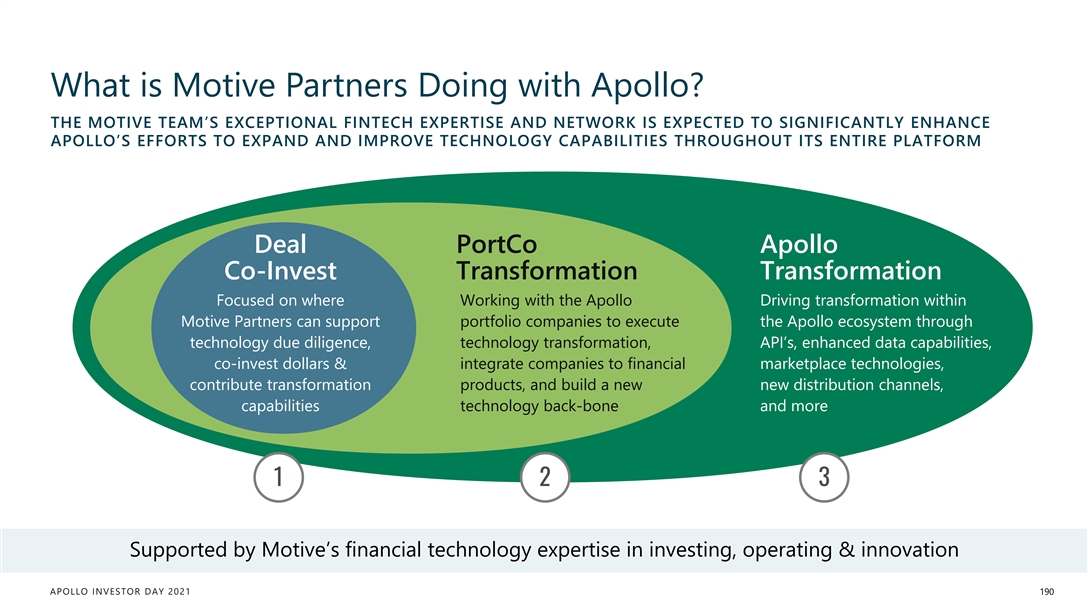
What is Motive Partners Doing with Apollo? THE MOTIVE TEAM’S EXCEPTIONAL FINTECH EXPERTISE AND NETWORK IS EXPECTED TO SIGNIFICANTLY ENHANCE APOLLO’S EFFORTS TO EXPAND AND IMPROVE TECHNOLOGY CAPABILITIES THROUGHOUT ITS ENTIRE PLATFORM Deal PortCo Apollo Co-Invest Transformation Transformation Focused on where Working with the Apollo Driving transformation within Motive Partners can support portfolio companies to execute the Apollo ecosystem through technology due diligence, technology transformation, API’s, enhanced data capabilities, co-invest dollars & integrate companies to financial marketplace technologies, contribute transformation products, and build a new new distribution channels, capabilities technology back-bone and more 1 2 3 Supported by Motive’s financial technology expertise in investing, operating & innovation APOLLO INVESTOR DAY 2021 190What is Motive Partners Doing with Apollo? THE MOTIVE TEAM’S EXCEPTIONAL FINTECH EXPERTISE AND NETWORK IS EXPECTED TO SIGNIFICANTLY ENHANCE APOLLO’S EFFORTS TO EXPAND AND IMPROVE TECHNOLOGY CAPABILITIES THROUGHOUT ITS ENTIRE PLATFORM Deal PortCo Apollo Co-Invest Transformation Transformation Focused on where Working with the Apollo Driving transformation within Motive Partners can support portfolio companies to execute the Apollo ecosystem through technology due diligence, technology transformation, API’s, enhanced data capabilities, co-invest dollars & integrate companies to financial marketplace technologies, contribute transformation products, and build a new new distribution channels, capabilities technology back-bone and more 1 2 3 Supported by Motive’s financial technology expertise in investing, operating & innovation APOLLO INVESTOR DAY 2021 190
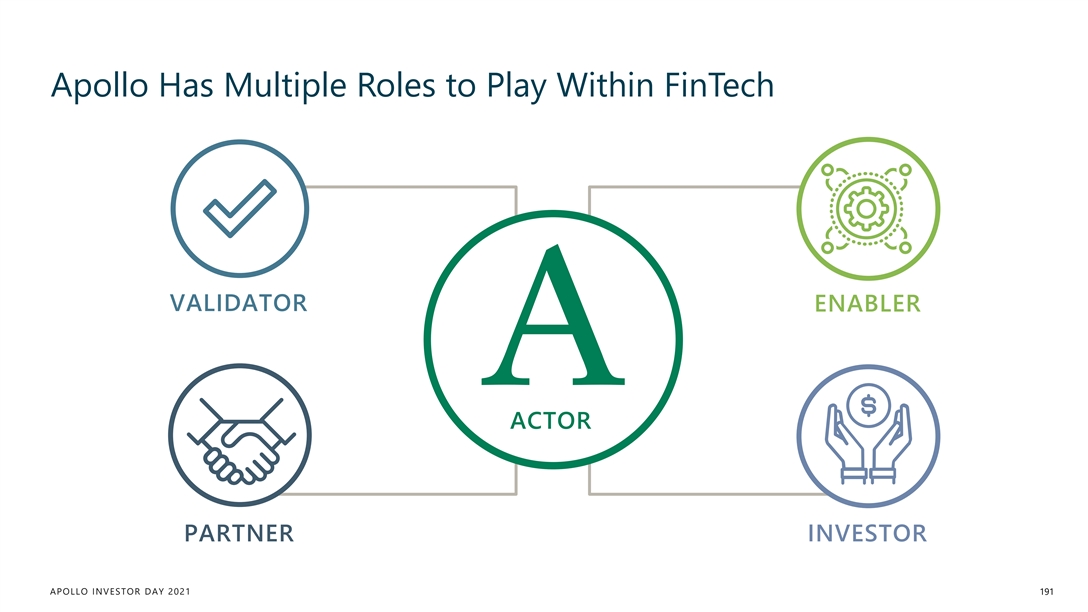
Apollo Has Multiple Roles to Play Within FinTech VALIDATOR ENABLER ACTOR PARTNER INVESTOR APOLLO INVESTOR DAY 2021 191Apollo Has Multiple Roles to Play Within FinTech VALIDATOR ENABLER ACTOR PARTNER INVESTOR APOLLO INVESTOR DAY 2021 191
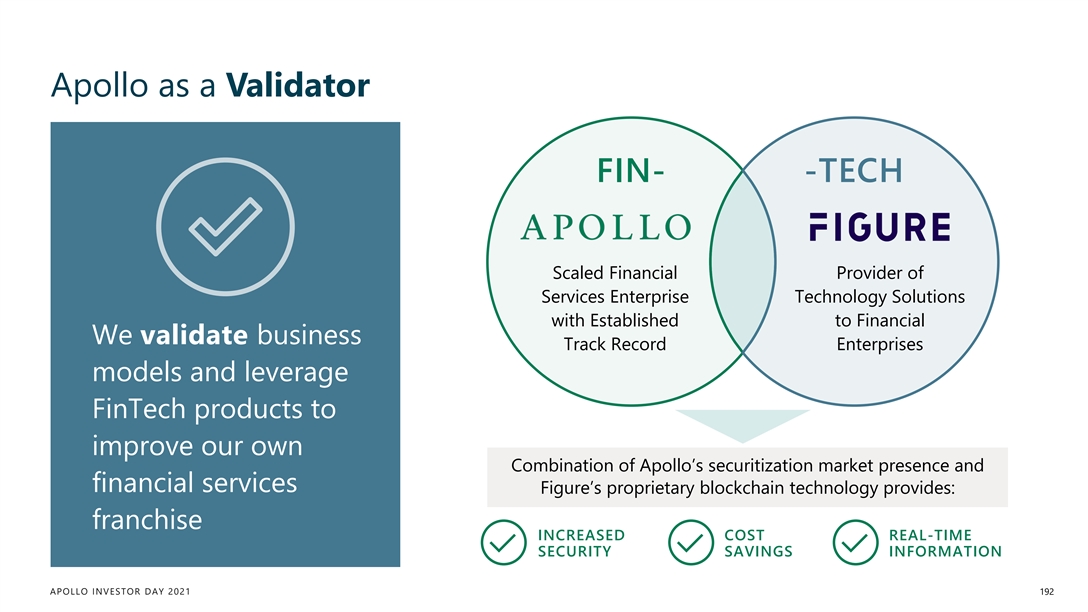
Apollo as a Validator FIN- -TECH Scaled Financial Provider of Services Enterprise Technology Solutions with Established to Financial We validate business Track Record Enterprises models and leverage FinTech products to improve our own Combination of Apollo’s securitization market presence and financial services Figure’s proprietary blockchain technology provides: franchise INCREASED COST REAL-TIME SECURITY SAVINGS INFORMATION APOLLO INVESTOR DAY 2021 192Apollo as a Validator FIN- -TECH Scaled Financial Provider of Services Enterprise Technology Solutions with Established to Financial We validate business Track Record Enterprises models and leverage FinTech products to improve our own Combination of Apollo’s securitization market presence and financial services Figure’s proprietary blockchain technology provides: franchise INCREASED COST REAL-TIME SECURITY SAVINGS INFORMATION APOLLO INVESTOR DAY 2021 192
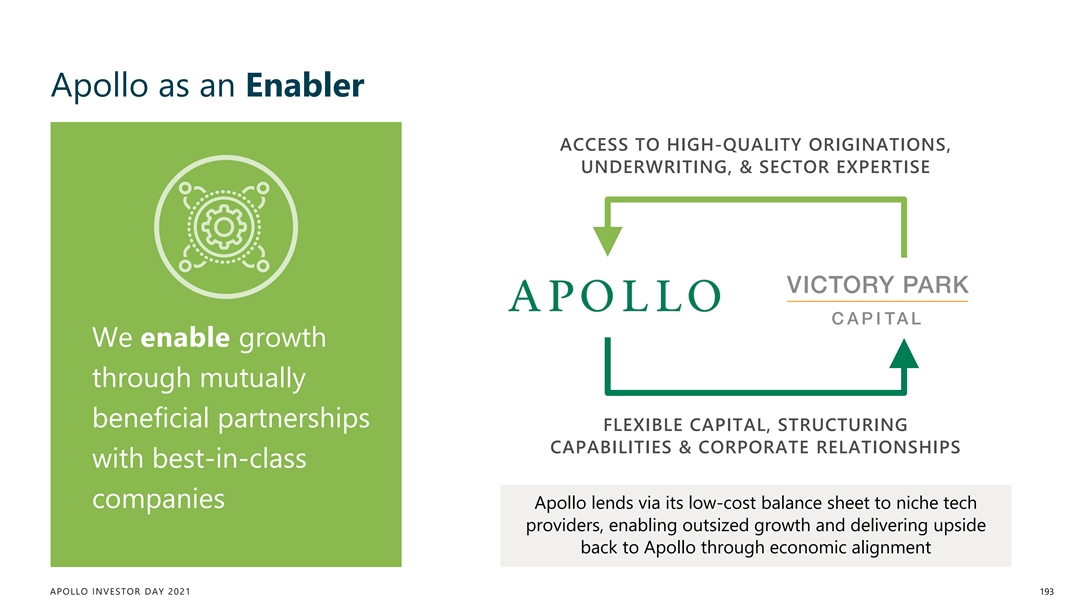
Apollo as an Enabler ACCESS TO HIGH-QUALITY ORIGINATIONS, UNDERWRITING, & SECTOR EXPERTISE We enable growth through mutually beneficial partnerships FLEXIBLE CAPITAL, STRUCTURING CAPABILITIES & CORPORATE RELATIONSHIPS with best-in-class companies Apollo lends via its low-cost balance sheet to niche tech providers, enabling outsized growth and delivering upside back to Apollo through economic alignment APOLLO INVESTOR DAY 2021 193Apollo as an Enabler ACCESS TO HIGH-QUALITY ORIGINATIONS, UNDERWRITING, & SECTOR EXPERTISE We enable growth through mutually beneficial partnerships FLEXIBLE CAPITAL, STRUCTURING CAPABILITIES & CORPORATE RELATIONSHIPS with best-in-class companies Apollo lends via its low-cost balance sheet to niche tech providers, enabling outsized growth and delivering upside back to Apollo through economic alignment APOLLO INVESTOR DAY 2021 193
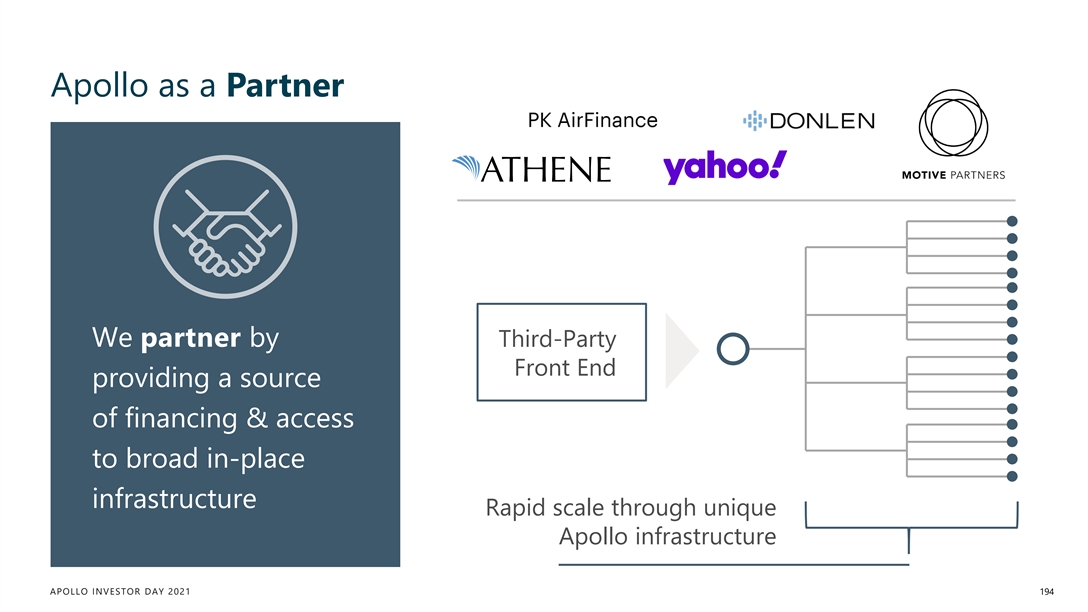
Apollo as a Partner We partner by Third-Party Front End providing a source of financing & access to broad in-place infrastructure Rapid scale through unique Apollo infrastructure APOLLO INVESTOR DAY 2021 194Apollo as a Partner We partner by Third-Party Front End providing a source of financing & access to broad in-place infrastructure Rapid scale through unique Apollo infrastructure APOLLO INVESTOR DAY 2021 194
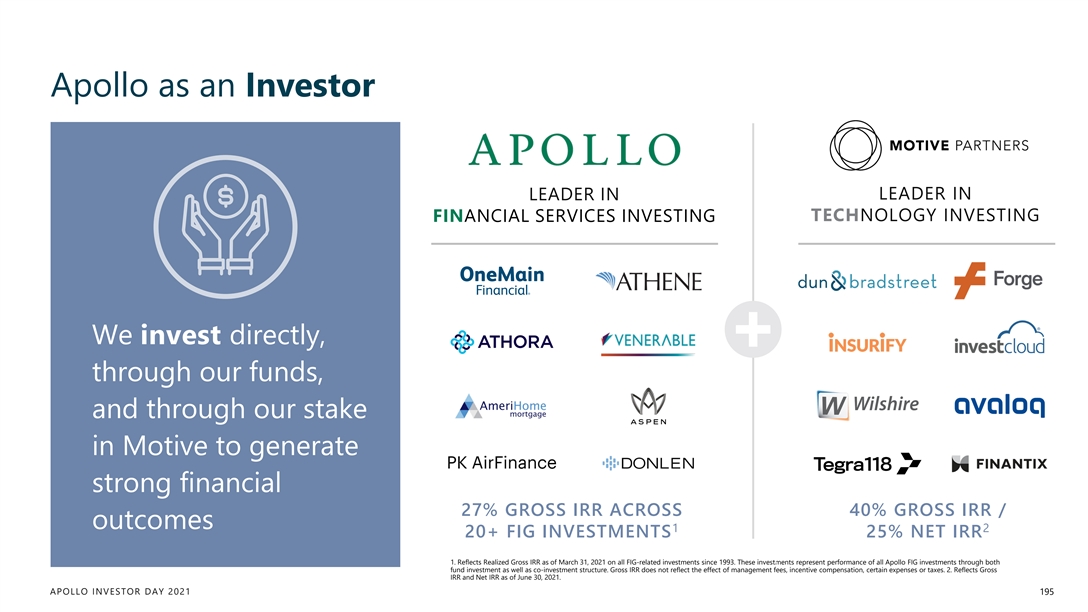
Apollo as an Investor LEADER IN LEADER IN TECHNOLOGY INVESTING FINANCIAL SERVICES INVESTING We invest directly, through our funds, and through our stake in Motive to generate strong financial 27% GROSS IRR ACROSS 40% GROSS IRR / outcomes 1 2 20+ FIG INVESTMENTS 25% NET IRR 1. Reflects Realized Gross IRR as of March 31, 2021 on all FIG-related investments since 1993. These investments represent performance of all Apollo FIG investments through both fund investment as well as co-investment structure. Gross IRR does not reflect the effect of management fees, incentive compensation, certain expenses or taxes. 2. Reflects Gross IRR and Net IRR as of June 30, 2021. APOLLO INVESTOR DAY 2021 195Apollo as an Investor LEADER IN LEADER IN TECHNOLOGY INVESTING FINANCIAL SERVICES INVESTING We invest directly, through our funds, and through our stake in Motive to generate strong financial 27% GROSS IRR ACROSS 40% GROSS IRR / outcomes 1 2 20+ FIG INVESTMENTS 25% NET IRR 1. Reflects Realized Gross IRR as of March 31, 2021 on all FIG-related investments since 1993. These investments represent performance of all Apollo FIG investments through both fund investment as well as co-investment structure. Gross IRR does not reflect the effect of management fees, incentive compensation, certain expenses or taxes. 2. Reflects Gross IRR and Net IRR as of June 30, 2021. APOLLO INVESTOR DAY 2021 195
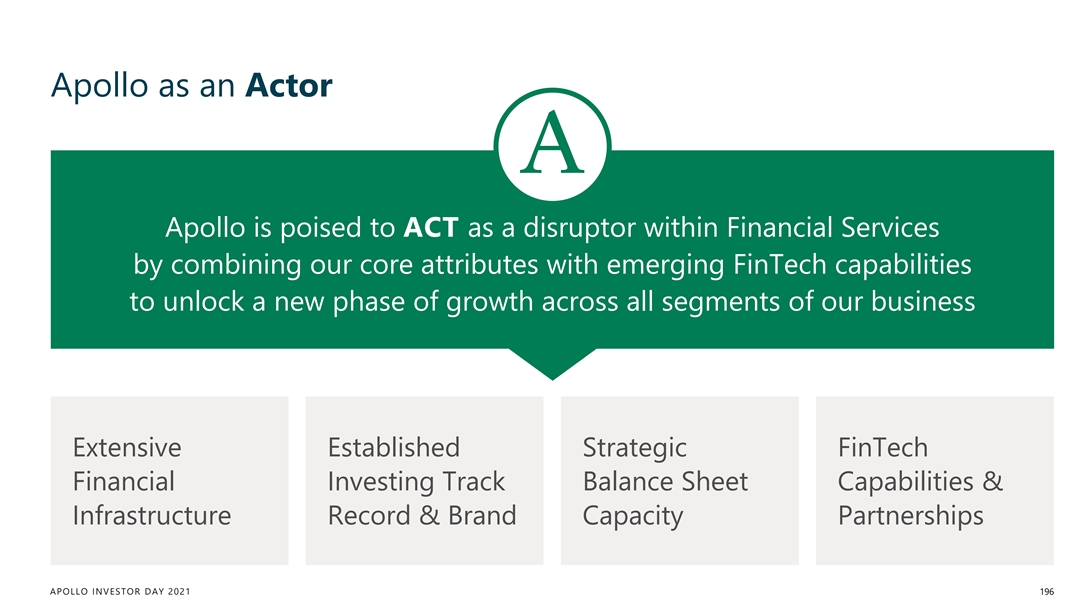
Apollo as an Actor Apollo is poised to ACT as a disruptor within Financial Services by combining our core attributes with emerging FinTech capabilities to unlock a new phase of growth across all segments of our business Extensive Established Strategic FinTech Financial Investing Track Balance Sheet Capabilities & Infrastructure Record & Brand Capacity Partnerships APOLLO INVESTOR DAY 2021 196

Expanding Opportunity JONATHAN SIMON Head of Leadership Development & Diversity, Equity and Inclusion APOLLO INVESTOR DAY 2021Expanding Opportunity JONATHAN SIMON Head of Leadership Development & Diversity, Equity and Inclusion APOLLO INVESTOR DAY 2021
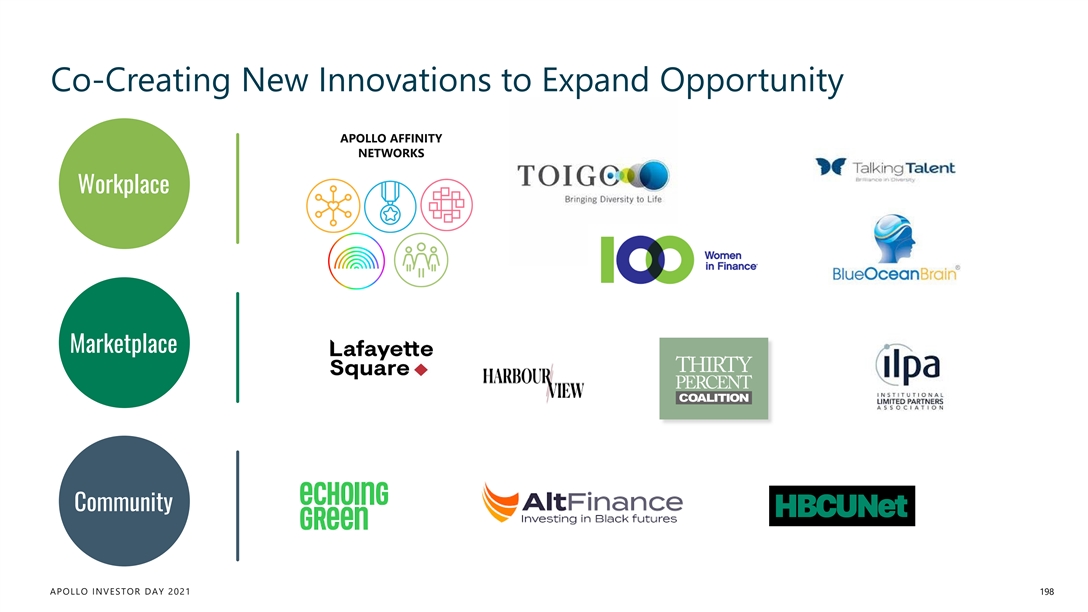
Co-Creating New Innovations to Expand Opportunity APOLLO AFFINITY NETWORKS Workplace Marketplace Community APOLLO INVESTOR DAY 2021 198

Expanding Opportunity VIDEO MODULE APOLLO INVESTOR DAY 2021Expanding Opportunity VIDEO MODULE APOLLO INVESTOR DAY 2021
Financial Overview & Strategy MARTIN KELLY Chief Financial Officer & Co-Chief Operating Officer APOLLO INVESTOR DAY 2021Financial Overview & Strategy MARTIN KELLY Chief Financial Officer & Co-Chief Operating Officer APOLLO INVESTOR DAY 2021
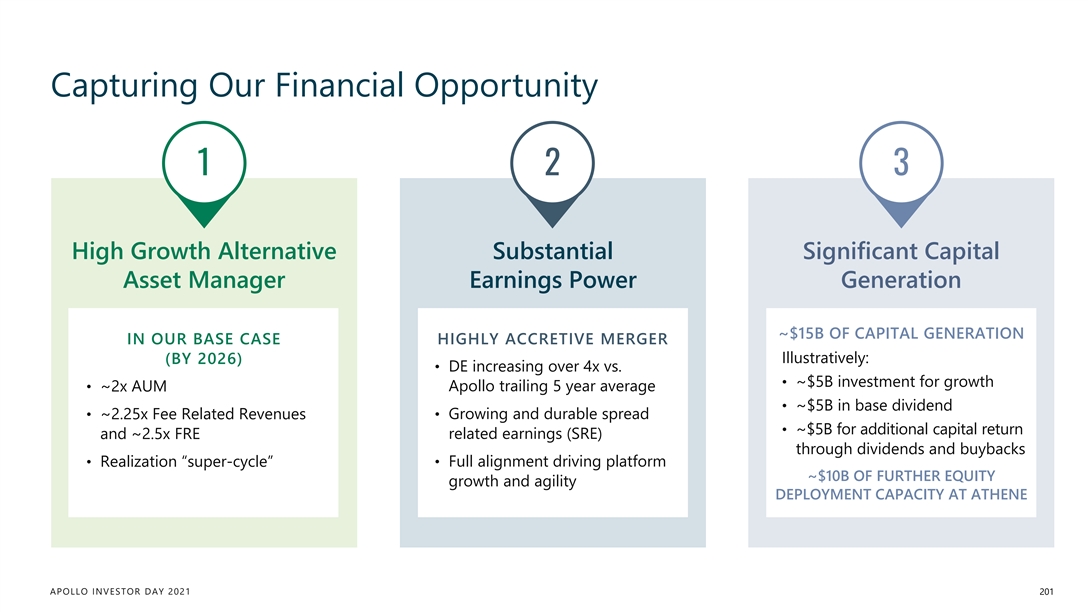
Capturing Our Financial Opportunity 1 2 3 High Growth Alternative Substantial Significant Capital Asset Manager Earnings Power Generation ~$15B OF CAPITAL GENERATION IN OUR BASE CASE HIGHLY ACCRETIVE MERGER Illustratively: (BY 2026) • DE increasing over 4x vs. • ~$5B investment for growth Apollo trailing 5 year average • ~2x AUM • ~$5B in base dividend • ~2.25x Fee Related Revenues • Growing and durable spread • ~$5B for additional capital return and ~2.5x FRE related earnings (SRE) through dividends and buybacks • Realization “super-cycle” • Full alignment driving platform ~$10B OF FURTHER EQUITY growth and agility DEPLOYMENT CAPACITY AT ATHENE APOLLO INVESTOR DAY 2021 201Capturing Our Financial Opportunity 1 2 3 High Growth Alternative Substantial Significant Capital Asset Manager Earnings Power Generation ~$15B OF CAPITAL GENERATION IN OUR BASE CASE HIGHLY ACCRETIVE MERGER Illustratively: (BY 2026) • DE increasing over 4x vs. • ~$5B investment for growth Apollo trailing 5 year average • ~2x AUM • ~$5B in base dividend • ~2.25x Fee Related Revenues • Growing and durable spread • ~$5B for additional capital return and ~2.5x FRE related earnings (SRE) through dividends and buybacks • Realization “super-cycle” • Full alignment driving platform ~$10B OF FURTHER EQUITY growth and agility DEPLOYMENT CAPACITY AT ATHENE APOLLO INVESTOR DAY 2021 201
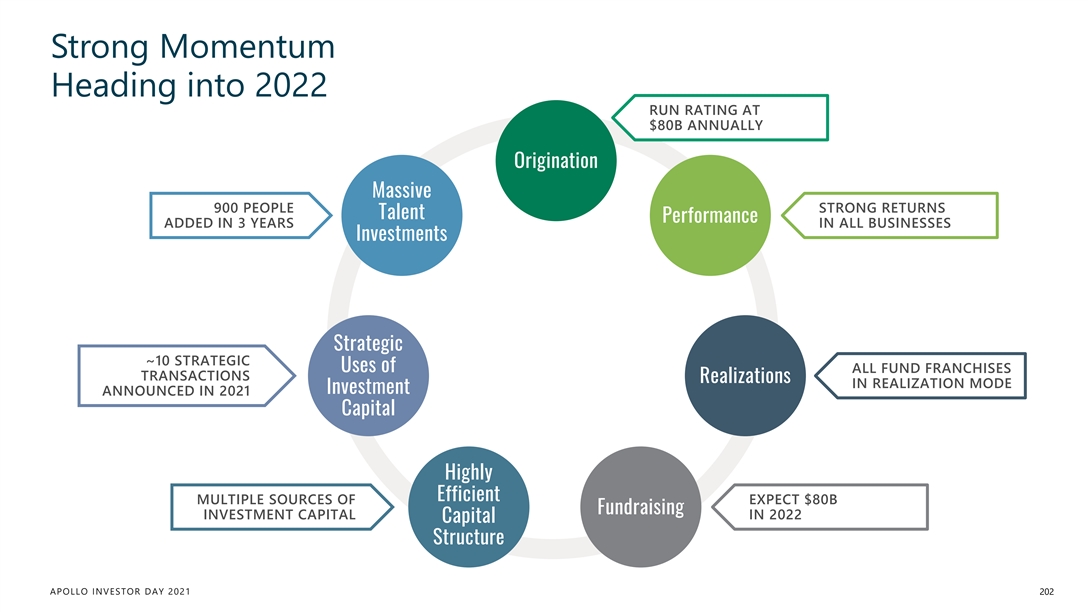
Strong Momentum Heading into 2022 RUN RATING AT $80B ANNUALLY Origination Massive 900 PEOPLE STRONG RETURNS Talent Performance ADDED IN 3 YEARS IN ALL BUSINESSES Investments Strategic ~10 STRATEGIC Uses of ALL FUND FRANCHISES TRANSACTIONS Realizations IN REALIZATION MODE Investment ANNOUNCED IN 2021 Capital Highly Efficient MULTIPLE SOURCES OF EXPECT $80B Fundraising INVESTMENT CAPITAL IN 2022 Capital Structure APOLLO INVESTOR DAY 2021 202Strong Momentum Heading into 2022 RUN RATING AT $80B ANNUALLY Origination Massive 900 PEOPLE STRONG RETURNS Talent Performance ADDED IN 3 YEARS IN ALL BUSINESSES Investments Strategic ~10 STRATEGIC Uses of ALL FUND FRANCHISES TRANSACTIONS Realizations IN REALIZATION MODE Investment ANNOUNCED IN 2021 Capital Highly Efficient MULTIPLE SOURCES OF EXPECT $80B Fundraising INVESTMENT CAPITAL IN 2022 Capital Structure APOLLO INVESTOR DAY 2021 202
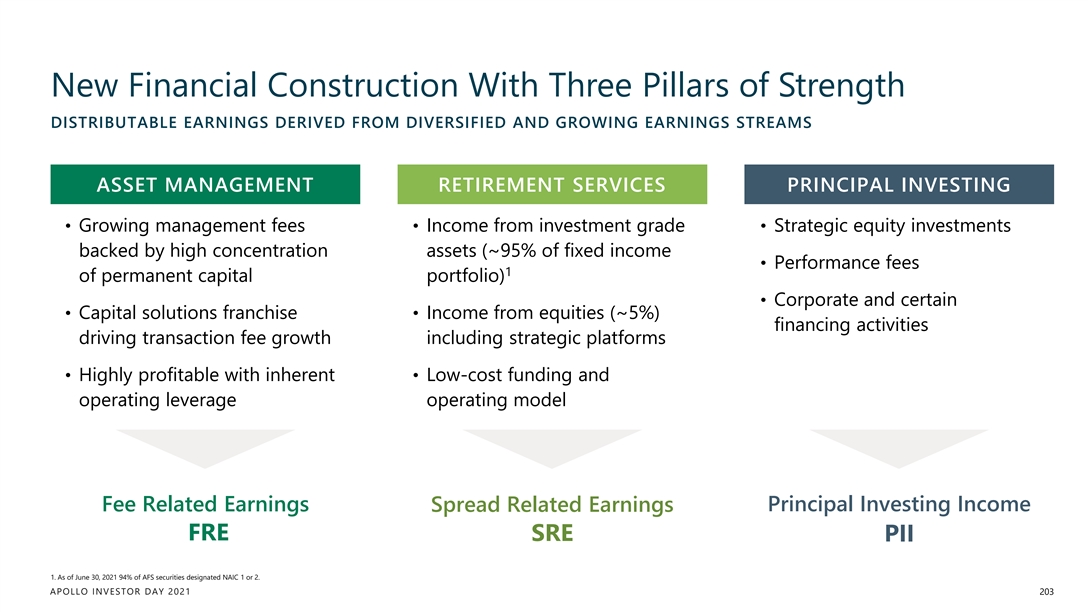
New Financial Construction With Three Pillars of Strength DISTRIBUTABLE EARNINGS DERIVED FROM DIVERSIFIED AND GROWING EARNINGS STREAMS ASSET MANAGEMENT RETIREMENT SERVICES PRINCIPAL INVESTING • Growing management fees • Income from investment grade • Strategic equity investments backed by high concentration assets (~95% of fixed income • Performance fees 1 of permanent capital portfolio) • Corporate and certain • Capital solutions franchise • Income from equities (~5%) financing activities driving transaction fee growth including strategic platforms • Highly profitable with inherent • Low-cost funding and operating leverage operating model Fee Related Earnings Principal Investing Income Spread Related Earnings FRE SRE PII 1. As of June 30, 2021 94% of AFS securities designated NAIC 1 or 2. APOLLO INVESTOR DAY 2021 203
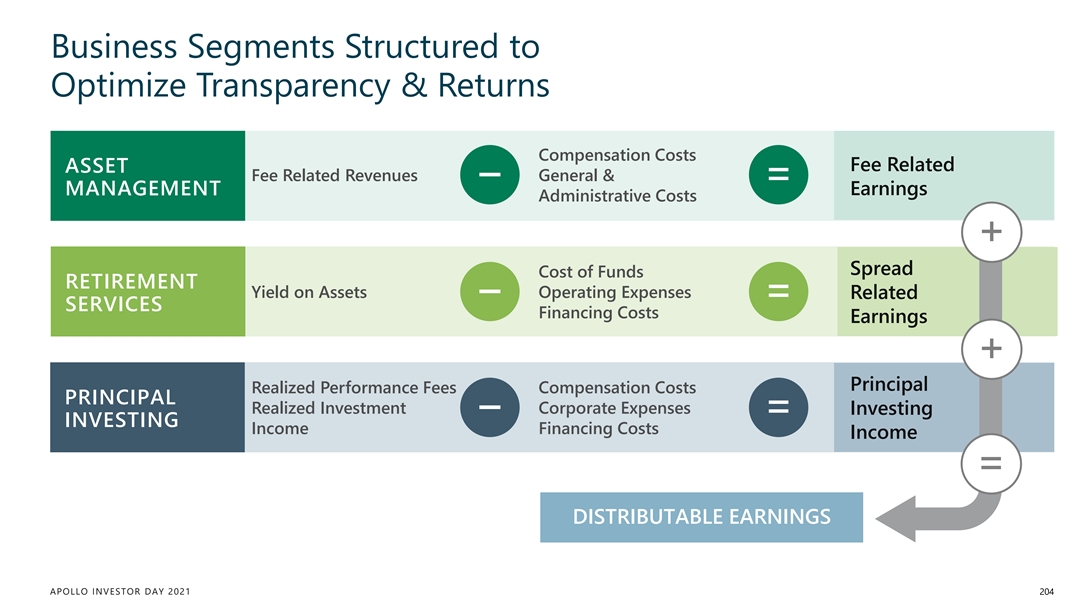
Business Segments Structured to Optimize Transparency & Returns Compensation Costs Fee Related ASSET Fee Related Revenues General & – = MANAGEMENT Earnings Administrative Costs + Spread Cost of Funds RETIREMENT Yield on Assets Operating Expenses Related – = SERVICES Financing Costs Earnings + Principal Realized Performance Fees Compensation Costs PRINCIPAL Realized Investment Corporate Expenses Investing – = INVESTING Income Financing Costs Income = DISTRIBUTABLE EARNINGS APOLLO INVESTOR DAY 2021 204Business Segments Structured to Optimize Transparency & Returns Compensation Costs Fee Related ASSET Fee Related Revenues General & – = MANAGEMENT Earnings Administrative Costs + Spread Cost of Funds RETIREMENT Yield on Assets Operating Expenses Related – = SERVICES Financing Costs Earnings + Principal Realized Performance Fees Compensation Costs PRINCIPAL Realized Investment Corporate Expenses Investing – = INVESTING Income Financing Costs Income = DISTRIBUTABLE EARNINGS APOLLO INVESTOR DAY 2021 204
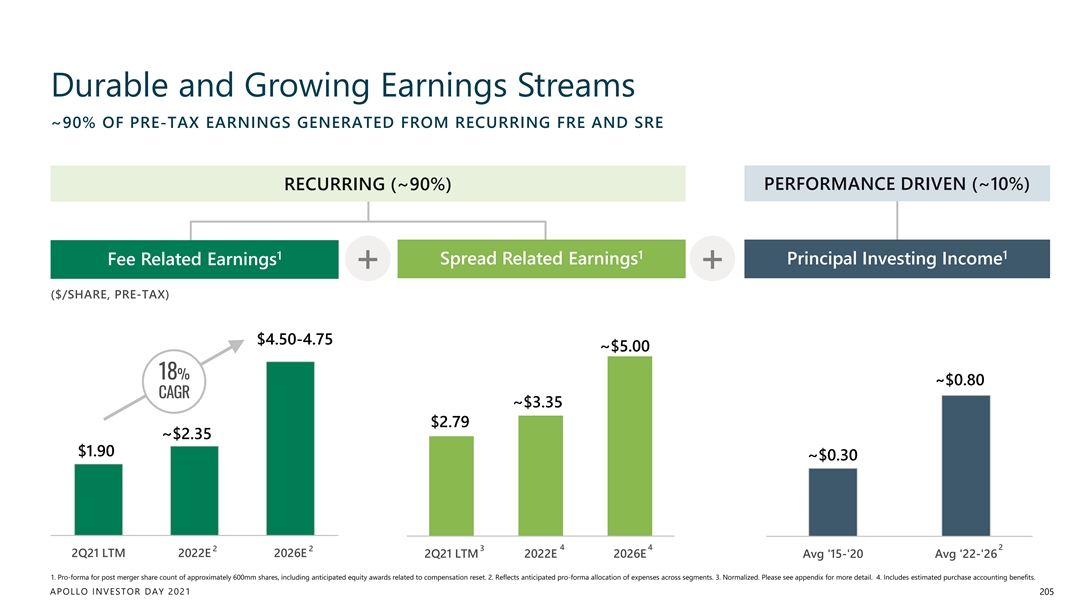
Durable and Growing Earnings Streams ~90% OF PRE-TAX EARNINGS GENERATED FROM RECURRING FRE AND SRE RECURRING (~90%) PERFORMANCE DRIVEN (~10%) 1 1 1 Fee Related Earnings Spread Related Earnings Principal Investing Income + + ($/SHARE, PRE-TAX) $4.50-4.75 ~$5.00 18% ~$0.80 CAGR ~$3.35 $2.79 ~$2.35 $1.90 ~$0.30 4 4 2 2 2 3 2Q21 LTM 2022E 2026E 2Q21 LTM 2022E 2026E Avg '15-'20 Avg '22-'26 1. Pro-forma for post merger share count of approximately 600mm shares, including anticipated equity awards related to compensation reset. 2. Reflects anticipated pro-forma allocation of expenses across segments. 3. Normalized. Please see appendix for more detail. 4. Includes estimated purchase accounting benefits. APOLLO INVESTOR DAY 2021 205Durable and Growing Earnings Streams ~90% OF PRE-TAX EARNINGS GENERATED FROM RECURRING FRE AND SRE RECURRING (~90%) PERFORMANCE DRIVEN (~10%) 1 1 1 Fee Related Earnings Spread Related Earnings Principal Investing Income + + ($/SHARE, PRE-TAX) $4.50-4.75 ~$5.00 18% ~$0.80 CAGR ~$3.35 $2.79 ~$2.35 $1.90 ~$0.30 4 4 2 2 2 3 2Q21 LTM 2022E 2026E 2Q21 LTM 2022E 2026E Avg '15-'20 Avg '22-'26 1. Pro-forma for post merger share count of approximately 600mm shares, including anticipated equity awards related to compensation reset. 2. Reflects anticipated pro-forma allocation of expenses across segments. 3. Normalized. Please see appendix for more detail. 4. Includes estimated purchase accounting benefits. APOLLO INVESTOR DAY 2021 205
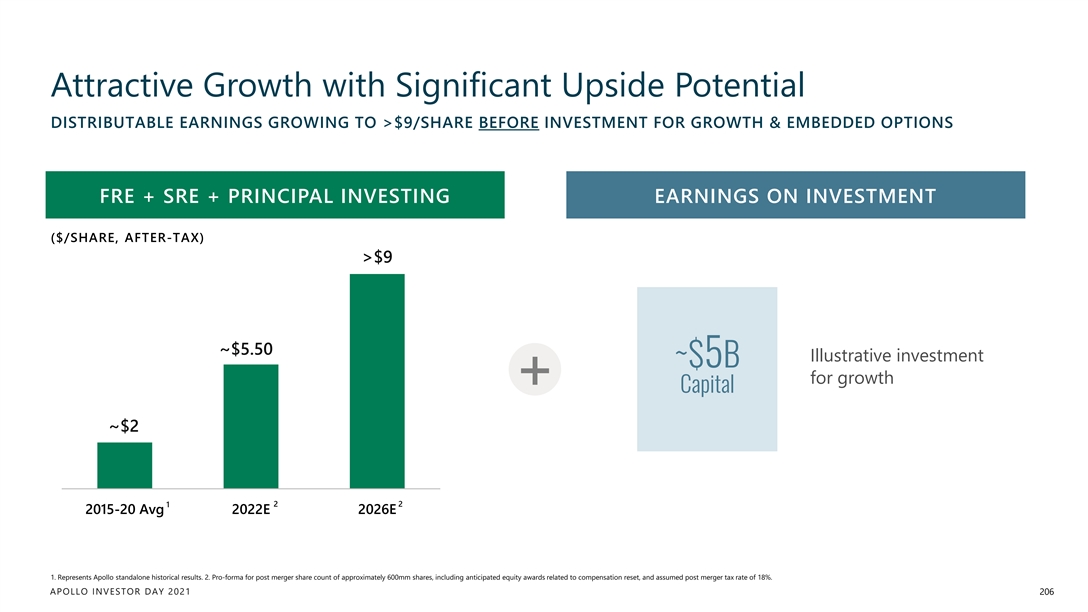
Attractive Growth with Significant Upside Potential DISTRIBUTABLE EARNINGS GROWING TO >$9/SHARE BEFORE INVESTMENT FOR GROWTH & EMBEDDED OPTIONS FRE + SRE + PRINCIPAL INVESTING EARNINGS ON INVESTMENT ($/SHARE, AFTER-TAX) >$9 ~$5.50 Illustrative investment ~$5B for growth + Capital ~$2 1 2 2 2015-20 Avg 2022E 2026E 1. Represents Apollo standalone historical results. 2. Pro-forma for post merger share count of approximately 600mm shares, including anticipated equity awards related to compensation reset, and assumed post merger tax rate of 18%. APOLLO INVESTOR DAY 2021 206Attractive Growth with Significant Upside Potential DISTRIBUTABLE EARNINGS GROWING TO >$9/SHARE BEFORE INVESTMENT FOR GROWTH & EMBEDDED OPTIONS FRE + SRE + PRINCIPAL INVESTING EARNINGS ON INVESTMENT ($/SHARE, AFTER-TAX) >$9 ~$5.50 Illustrative investment ~$5B for growth + Capital ~$2 1 2 2 2015-20 Avg 2022E 2026E 1. Represents Apollo standalone historical results. 2. Pro-forma for post merger share count of approximately 600mm shares, including anticipated equity awards related to compensation reset, and assumed post merger tax rate of 18%. APOLLO INVESTOR DAY 2021 206
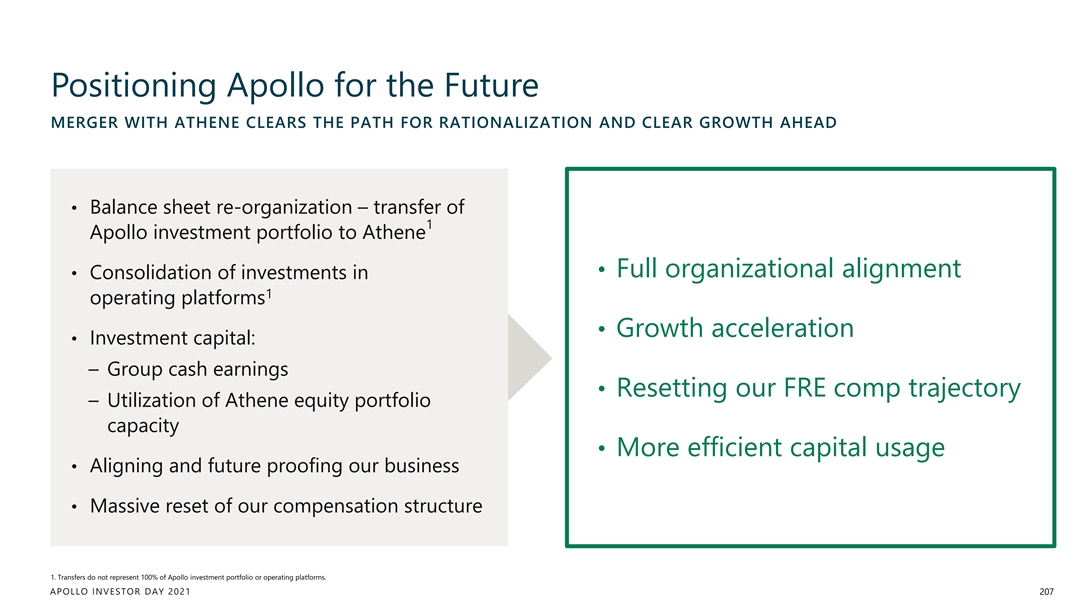
Positioning Apollo for the Future MERGER WITH ATHENE CLEARS THE PATH FOR RATIONALIZATION AND CLEAR GROWTH AHEAD • Balance sheet re-organization – transfer of 1 Apollo investment portfolio to Athene • Full organizational alignment • Consolidation of investments in 1 operating platforms • Growth acceleration • Investment capital: – Group cash earnings • Resetting our FRE comp trajectory – Utilization of Athene equity portfolio capacity • More efficient capital usage • Aligning and future proofing our business • Massive reset of our compensation structure 1. Transfers do not represent 100% of Apollo investment portfolio or operating platforms. APOLLO INVESTOR DAY 2021 207Positioning Apollo for the Future MERGER WITH ATHENE CLEARS THE PATH FOR RATIONALIZATION AND CLEAR GROWTH AHEAD • Balance sheet re-organization – transfer of 1 Apollo investment portfolio to Athene • Full organizational alignment • Consolidation of investments in 1 operating platforms • Growth acceleration • Investment capital: – Group cash earnings • Resetting our FRE comp trajectory – Utilization of Athene equity portfolio capacity • More efficient capital usage • Aligning and future proofing our business • Massive reset of our compensation structure 1. Transfers do not represent 100% of Apollo investment portfolio or operating platforms. APOLLO INVESTOR DAY 2021 207
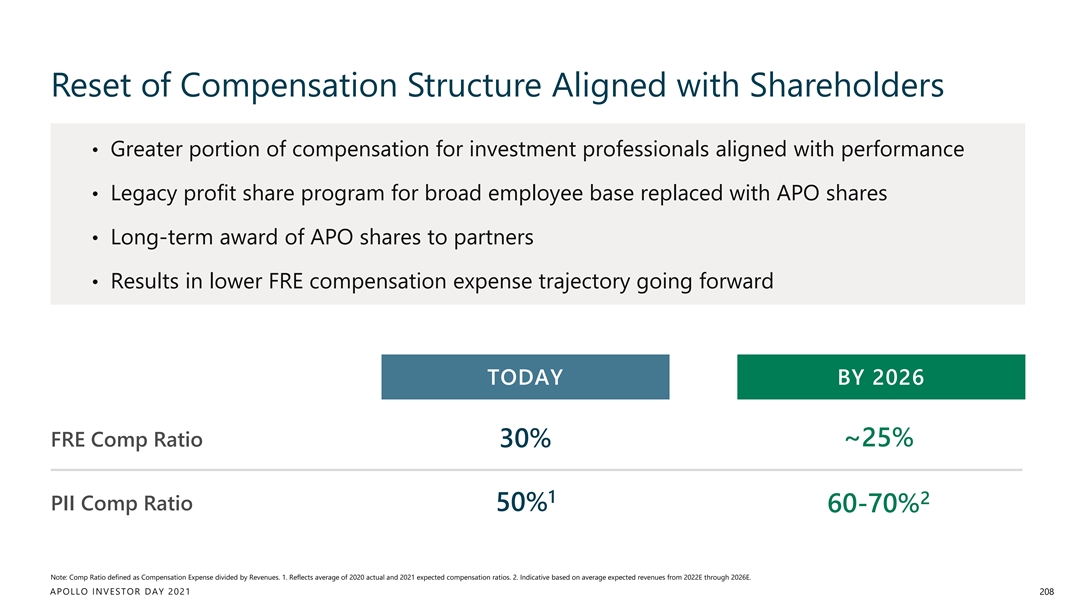
Reset of Compensation Structure Aligned with Shareholders • Greater portion of compensation for investment professionals aligned with performance • Legacy profit share program for broad employee base replaced with APO shares • Long-term award of APO shares to partners • Results in lower FRE compensation expense trajectory going forward TODAY BY 2026 ~25% FRE Comp Ratio 30% 1 2 PII Comp Ratio 50% 60-70% Note: Comp Ratio defined as Compensation Expense divided by Revenues. 1. Reflects average of 2020 actual and 2021 expected compensation ratios. 2. Indicative based on average expected revenues from 2022E through 2026E. APOLLO INVESTOR DAY 2021 208Reset of Compensation Structure Aligned with Shareholders • Greater portion of compensation for investment professionals aligned with performance • Legacy profit share program for broad employee base replaced with APO shares • Long-term award of APO shares to partners • Results in lower FRE compensation expense trajectory going forward TODAY BY 2026 ~25% FRE Comp Ratio 30% 1 2 PII Comp Ratio 50% 60-70% Note: Comp Ratio defined as Compensation Expense divided by Revenues. 1. Reflects average of 2020 actual and 2021 expected compensation ratios. 2. Indicative based on average expected revenues from 2022E through 2026E. APOLLO INVESTOR DAY 2021 208
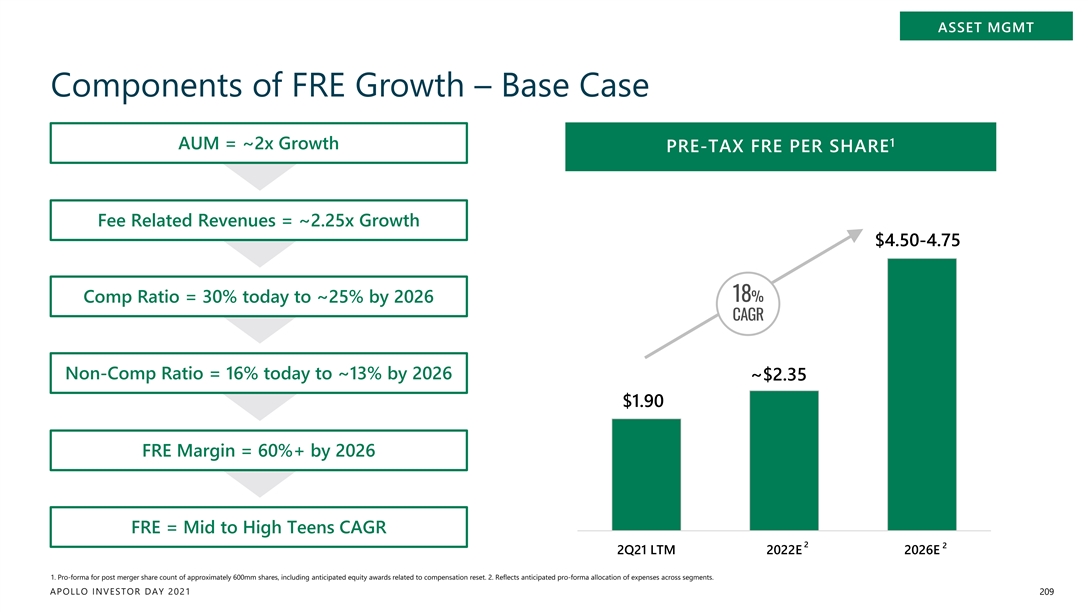
ASSET MGMT Components of FRE Growth – Base Case 1 AUM = ~2x Growth PRE-TAX FRE PER SHARE Fee Related Revenues = ~2.25x Growth $4.50-4.75 18% Comp Ratio = 30% today to ~25% by 2026 CAGR Non-Comp Ratio = 16% today to ~13% by 2026 ~$2.35 $1.90 FRE Margin = 60%+ by 2026 FRE = Mid to High Teens CAGR 2 2 2Q21 LTM 2022E 2026E 1. Pro-forma for post merger share count of approximately 600mm shares, including anticipated equity awards related to compensation reset. 2. Reflects anticipated pro-forma allocation of expenses across segments. APOLLO INVESTOR DAY 2021 209
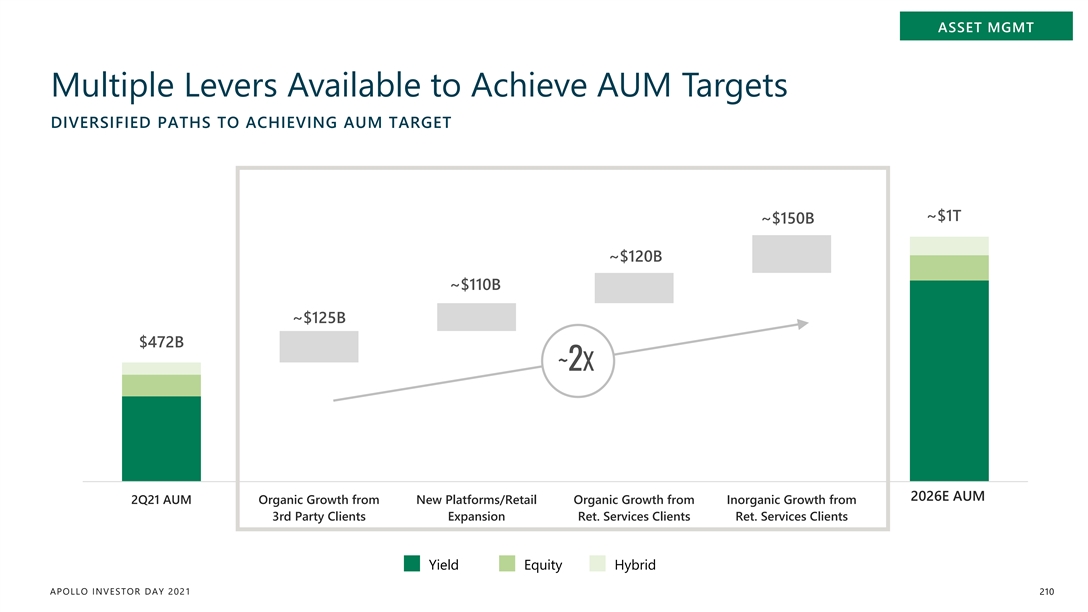
ASSET MGMT Multiple Levers Available to Achieve AUM Targets DIVERSIFIED PATHS TO ACHIEVING AUM TARGET ~$1T ~$150B ~$120B ~$110B ~$125B $472B ~2X 2026E AUM 2Q21 AUM Organic Growth from New Platforms/Retail Organic Growth from Inorganic Growth from 3rd Party Clients Expansion Ret. Services Clients Ret. Services Clients Yield Equity Hybrid APOLLO INVESTOR DAY 2021 210ASSET MGMT Multiple Levers Available to Achieve AUM Targets DIVERSIFIED PATHS TO ACHIEVING AUM TARGET ~$1T ~$150B ~$120B ~$110B ~$125B $472B ~2X 2026E AUM 2Q21 AUM Organic Growth from New Platforms/Retail Organic Growth from Inorganic Growth from 3rd Party Clients Expansion Ret. Services Clients Ret. Services Clients Yield Equity Hybrid APOLLO INVESTOR DAY 2021 210
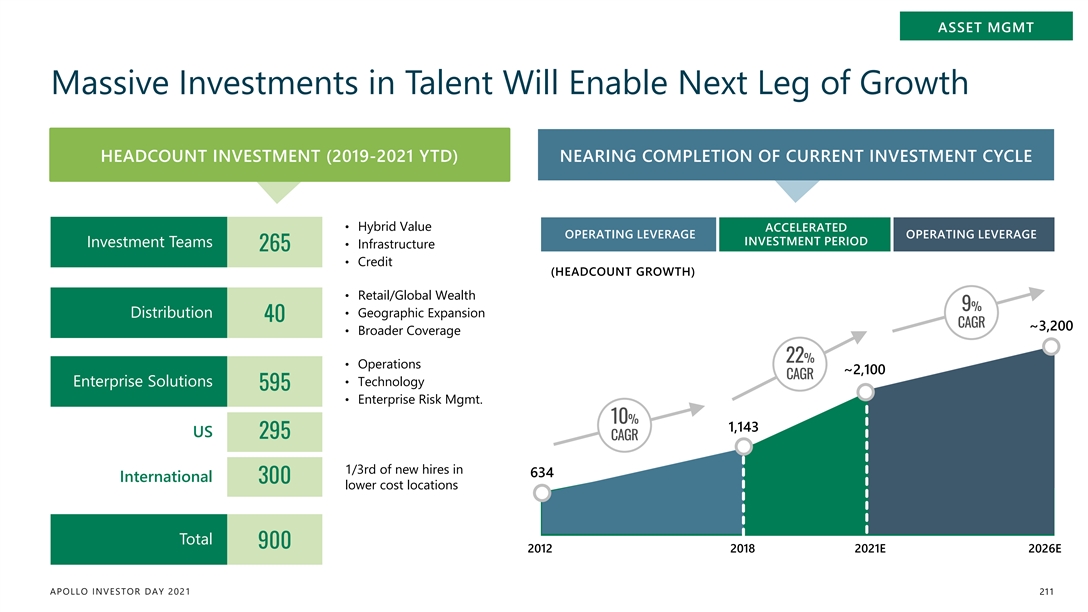
ASSET MGMT Massive Investments in Talent Will Enable Next Leg of Growth HEADCOUNT INVESTMENT (2019-2021 YTD) NEARING COMPLETION OF CURRENT INVESTMENT CYCLE • Hybrid Value ACCELERATED OPERATING LEVERAGE OPERATING LEVERAGE INVESTMENT PERIOD Investment Teams • Infrastructure 265 • Credit (HEADCOUNT GROWTH) • Retail/Global Wealth 9% • Geographic Expansion Distribution 40 CAGR ~3,200 • Broader Coverage 22% • Operations ~2,100 CAGR • Technology Enterprise Solutions 595 • Enterprise Risk Mgmt. 10% 1,143 US 295 CAGR 1/3rd of new hires in 634 International 300 lower cost locations Total 900 2012 2018 2021E 2026E 2012 2018 2021E 2026E APOLLO INVESTOR DAY 2021 211ASSET MGMT Massive Investments in Talent Will Enable Next Leg of Growth HEADCOUNT INVESTMENT (2019-2021 YTD) NEARING COMPLETION OF CURRENT INVESTMENT CYCLE • Hybrid Value ACCELERATED OPERATING LEVERAGE OPERATING LEVERAGE INVESTMENT PERIOD Investment Teams • Infrastructure 265 • Credit (HEADCOUNT GROWTH) • Retail/Global Wealth 9% • Geographic Expansion Distribution 40 CAGR ~3,200 • Broader Coverage 22% • Operations ~2,100 CAGR • Technology Enterprise Solutions 595 • Enterprise Risk Mgmt. 10% 1,143 US 295 CAGR 1/3rd of new hires in 634 International 300 lower cost locations Total 900 2012 2018 2021E 2026E 2012 2018 2021E 2026E APOLLO INVESTOR DAY 2021 211
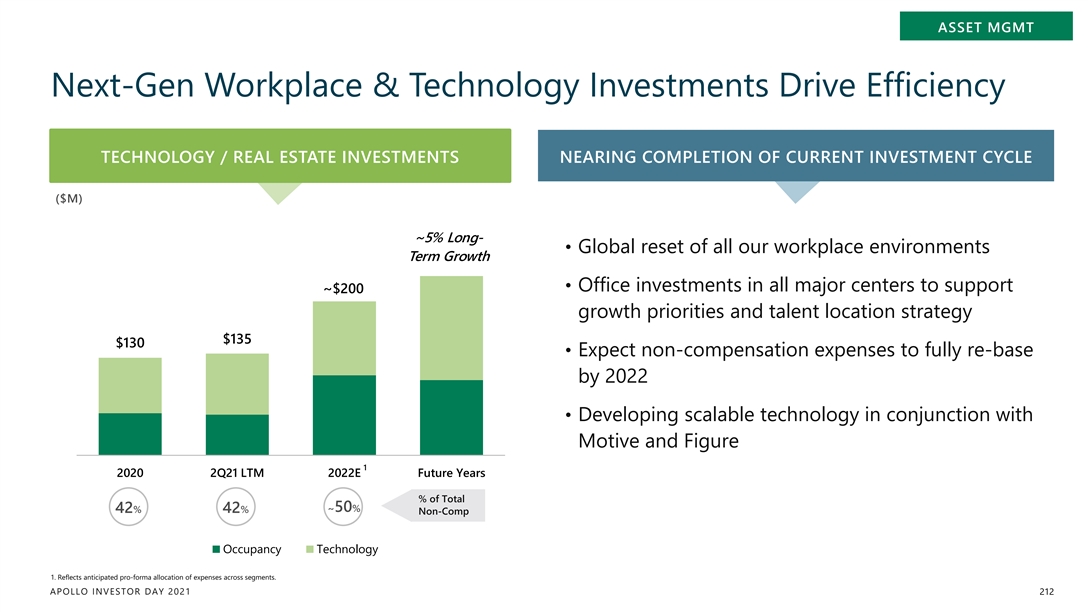
ASSET MGMT Next-Gen Workplace & Technology Investments Drive Efficiency TECHNOLOGY / REAL ESTATE INVESTMENTS NEARING COMPLETION OF CURRENT INVESTMENT CYCLE ($M) ~5% Long- • Global reset of all our workplace environments Term Growth • Office investments in all major centers to support ~$200 growth priorities and talent location strategy $135 $130 • Expect non-compensation expenses to fully re-base by 2022 • Developing scalable technology in conjunction with Motive and Figure 1 2020 2Q21 LTM 2022E Future Years % of Total ~50% 42% 42% Non-Comp Occupancy Technology 1. Reflects anticipated pro-forma allocation of expenses across segments. APOLLO INVESTOR DAY 2021 212ASSET MGMT Next-Gen Workplace & Technology Investments Drive Efficiency TECHNOLOGY / REAL ESTATE INVESTMENTS NEARING COMPLETION OF CURRENT INVESTMENT CYCLE ($M) ~5% Long- • Global reset of all our workplace environments Term Growth • Office investments in all major centers to support ~$200 growth priorities and talent location strategy $135 $130 • Expect non-compensation expenses to fully re-base by 2022 • Developing scalable technology in conjunction with Motive and Figure 1 2020 2Q21 LTM 2022E Future Years % of Total ~50% 42% 42% Non-Comp Occupancy Technology 1. Reflects anticipated pro-forma allocation of expenses across segments. APOLLO INVESTOR DAY 2021 212
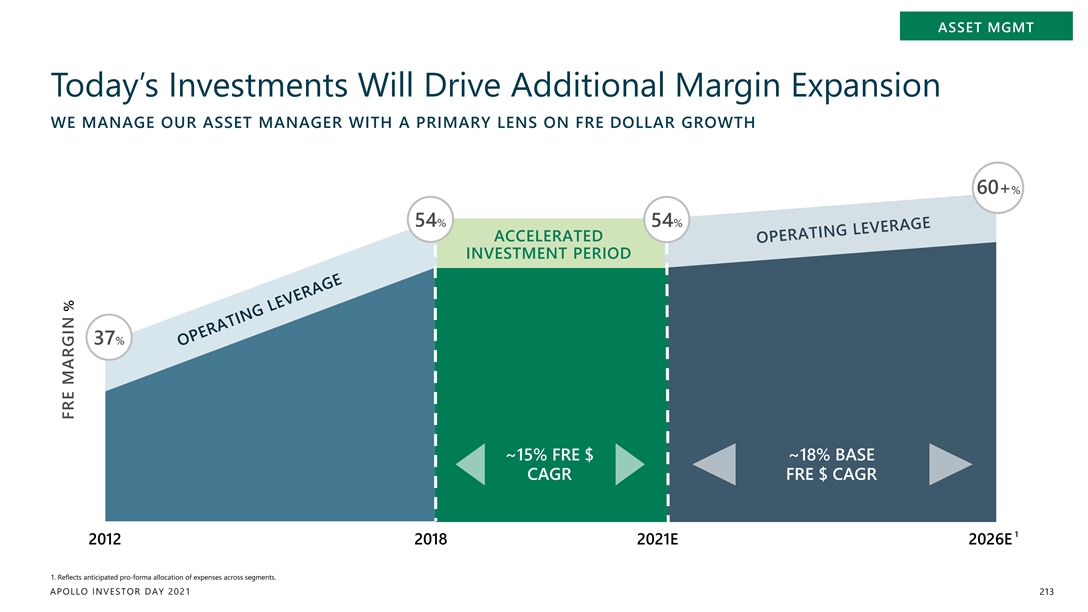
ASSET MGMT Today’s Investments Will Drive Additional Margin Expansion WE MANAGE OUR ASSET MANAGER WITH A PRIMARY LENS ON FRE DOLLAR GROWTH 60+% 54% 54% ACCELERATED INVESTMENT PERIOD 37% ~15% FRE $ ~18% BASE CAGR FRE $ CAGR 1 2012 2018 2021E 2026E 1. Reflects anticipated pro-forma allocation of expenses across segments. APOLLO INVESTOR DAY 2021 213 FRE MARGIN %ASSET MGMT Today’s Investments Will Drive Additional Margin Expansion WE MANAGE OUR ASSET MANAGER WITH A PRIMARY LENS ON FRE DOLLAR GROWTH 60+% 54% 54% ACCELERATED INVESTMENT PERIOD 37% ~15% FRE $ ~18% BASE CAGR FRE $ CAGR 1 2012 2018 2021E 2026E 1. Reflects anticipated pro-forma allocation of expenses across segments. APOLLO INVESTOR DAY 2021 213 FRE MARGIN %
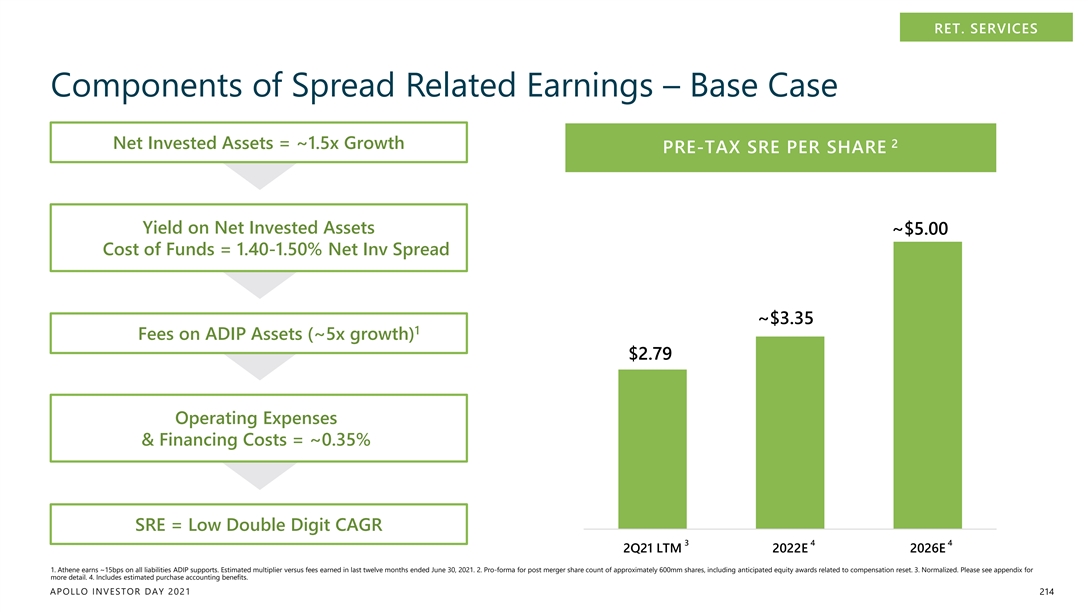
RET. SERVICES Components of Spread Related Earnings – Base Case 2 Net Invested Assets = ~1.5x Growth PRE-TAX SRE PER SHARE Yield on Net Invested Assets ~$5.00 Cost of Funds = 1.40-1.50% Net Inv Spread ~$3.35 1 Fees on ADIP Assets (~5x growth) $2.79 Operating Expenses & Financing Costs = ~0.35% SRE = Low Double Digit CAGR 3 4 4 2Q21 LTM 2022E 2026E 1. Athene earns ~15bps on all liabilities ADIP supports. Estimated multiplier versus fees earned in last twelve months ended June 30, 2021. 2. Pro-forma for post merger share count of approximately 600mm shares, including anticipated equity awards related to compensation reset. 3. Normalized. Please see appendix for more detail. 4. Includes estimated purchase accounting benefits. APOLLO INVESTOR DAY 2021 214RET. SERVICES Components of Spread Related Earnings – Base Case 2 Net Invested Assets = ~1.5x Growth PRE-TAX SRE PER SHARE Yield on Net Invested Assets ~$5.00 Cost of Funds = 1.40-1.50% Net Inv Spread ~$3.35 1 Fees on ADIP Assets (~5x growth) $2.79 Operating Expenses & Financing Costs = ~0.35% SRE = Low Double Digit CAGR 3 4 4 2Q21 LTM 2022E 2026E 1. Athene earns ~15bps on all liabilities ADIP supports. Estimated multiplier versus fees earned in last twelve months ended June 30, 2021. 2. Pro-forma for post merger share count of approximately 600mm shares, including anticipated equity awards related to compensation reset. 3. Normalized. Please see appendix for more detail. 4. Includes estimated purchase accounting benefits. APOLLO INVESTOR DAY 2021 214
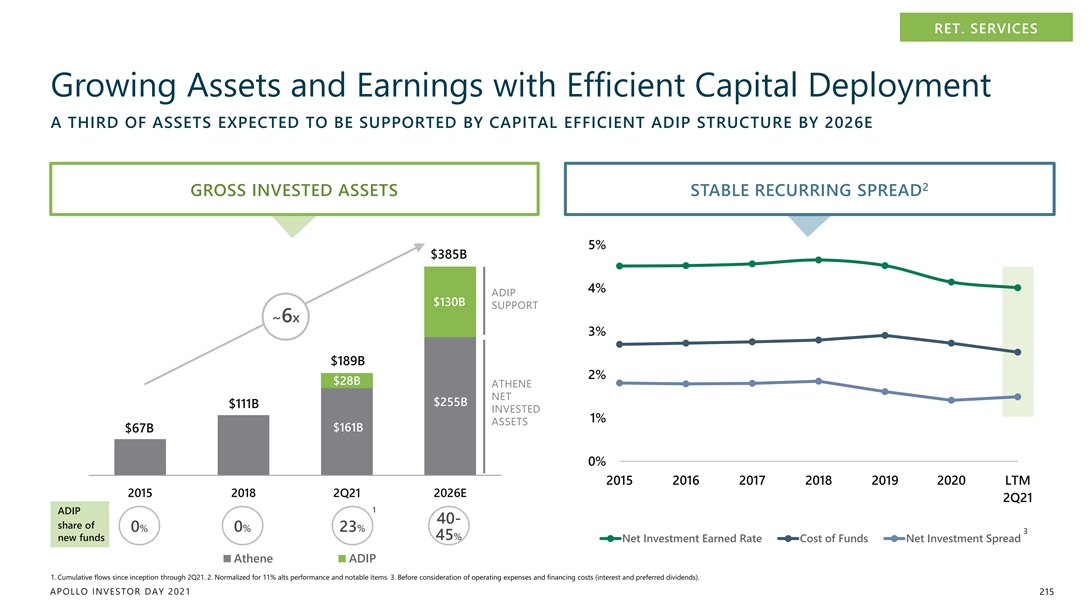
RET. SERVICES Growing Assets and Earnings with Efficient Capital Deployment A THIRD OF ASSETS EXPECTED TO BE SUPPORTED BY CAPITAL EFFICIENT ADIP STRUCTURE BY 2026E 2 GROSS INVESTED ASSETS STABLE RECURRING SPREAD 5% $385B 4% ADIP $130B SUPPORT ~6x 3% $189B 2% $28B ATHENE NET $255B $111B INVESTED 1% ASSETS $161B $67B 0% 2015 2016 2017 2018 2019 2020 LTM 2015 2018 2Q21 2026E 2Q21 1 ADIP 40- share of 0% 0% 23% 3 45% new funds Net Investment Earned Rate Cost of Funds Net Investment Spread Athene ADIP 1. Cumulative flows since inception through 2Q21. 2. Normalized for 11% alts performance and notable items. 3. Before consideration of operating expenses and financing costs (interest and preferred dividends). APOLLO INVESTOR DAY 2021 215
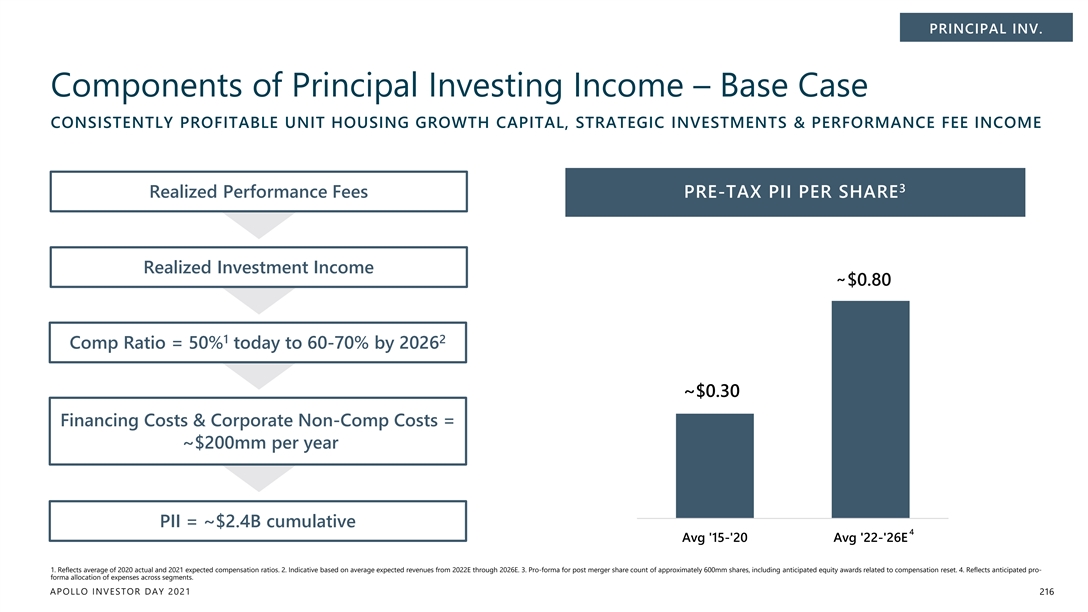
PRINCIPAL INV. Components of Principal Investing Income – Base Case CONSISTENTLY PROFITABLE UNIT HOUSING GROWTH CAPITAL, STRATEGIC INVESTMENTS & PERFORMANCE FEE INCOME 3 Realized Performance Fees PRE-TAX PII PER SHARE Realized Investment Income ~ $0.80 1 2 Comp Ratio = 50% today to 60-70% by 2026 ~$0.30 Financing Costs & Corporate Non-Comp Costs = ~$200mm per year PII = ~$2.4B cumulative 4 Avg '15-'20 Avg '22-'26E 1. Reflects average of 2020 actual and 2021 expected compensation ratios. 2. Indicative based on average expected revenues from 2022E through 2026E. 3. Pro-forma for post merger share count of approximately 600mm shares, including anticipated equity awards related to compensation reset. 4. Reflects anticipated pro- forma allocation of expenses across segments. APOLLO INVESTOR DAY 2021 216PRINCIPAL INV. Components of Principal Investing Income – Base Case CONSISTENTLY PROFITABLE UNIT HOUSING GROWTH CAPITAL, STRATEGIC INVESTMENTS & PERFORMANCE FEE INCOME 3 Realized Performance Fees PRE-TAX PII PER SHARE Realized Investment Income ~ $0.80 1 2 Comp Ratio = 50% today to 60-70% by 2026 ~$0.30 Financing Costs & Corporate Non-Comp Costs = ~$200mm per year PII = ~$2.4B cumulative 4 Avg '15-'20 Avg '22-'26E 1. Reflects average of 2020 actual and 2021 expected compensation ratios. 2. Indicative based on average expected revenues from 2022E through 2026E. 3. Pro-forma for post merger share count of approximately 600mm shares, including anticipated equity awards related to compensation reset. 4. Reflects anticipated pro- forma allocation of expenses across segments. APOLLO INVESTOR DAY 2021 216
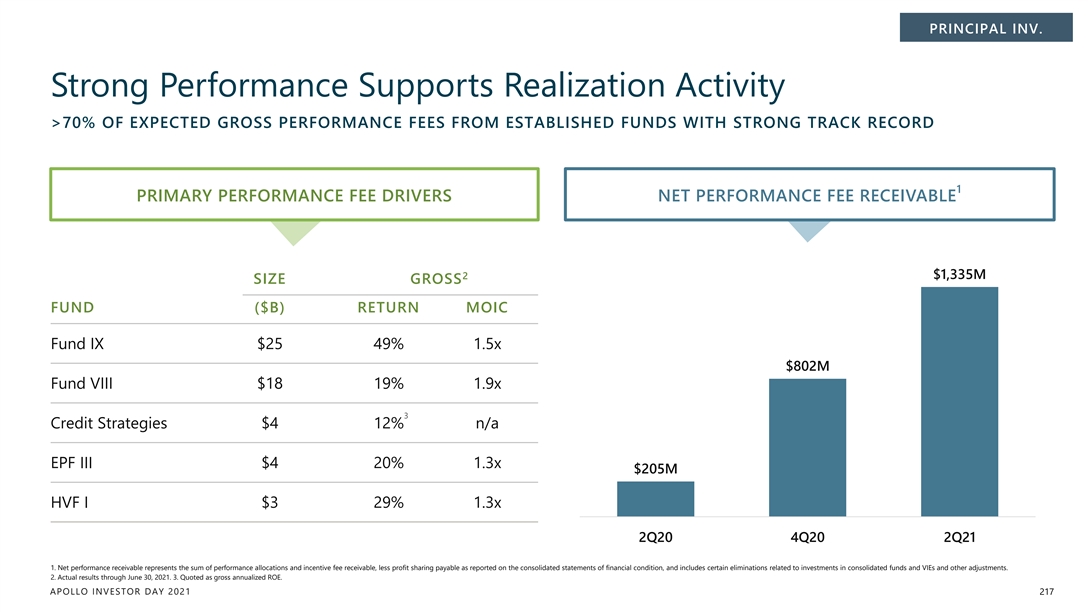
PRINCIPAL INV. Strong Performance Supports Realization Activity >70% OF EXPECTED GROSS PERFORMANCE FEES FROM ESTABLISHED FUNDS WITH STRONG TRACK RECORD 1 PRIMARY PERFORMANCE FEE DRIVERS NET PERFORMANCE FEE RECEIVABLE 2 $1,335M SIZE GROSS FUND ($B) RETURN MOIC Fund IX $25 49% 1.5x $802M Fund VIII $18 19% 1.9x 3 Credit Strategies $4 12% n/a EPF III $4 20% 1.3x $205M HVF I $3 29% 1.3x 2Q20 4Q20 2Q21 1. Net performance receivable represents the sum of performance allocations and incentive fee receivable, less profit sharing payable as reported on the consolidated statements of financial condition, and includes certain eliminations related to investments in consolidated funds and VIEs and other adjustments. 2. Actual results through June 30, 2021. 3. Quoted as gross annualized ROE. APOLLO INVESTOR DAY 2021 217PRINCIPAL INV. Strong Performance Supports Realization Activity >70% OF EXPECTED GROSS PERFORMANCE FEES FROM ESTABLISHED FUNDS WITH STRONG TRACK RECORD 1 PRIMARY PERFORMANCE FEE DRIVERS NET PERFORMANCE FEE RECEIVABLE 2 $1,335M SIZE GROSS FUND ($B) RETURN MOIC Fund IX $25 49% 1.5x $802M Fund VIII $18 19% 1.9x 3 Credit Strategies $4 12% n/a EPF III $4 20% 1.3x $205M HVF I $3 29% 1.3x 2Q20 4Q20 2Q21 1. Net performance receivable represents the sum of performance allocations and incentive fee receivable, less profit sharing payable as reported on the consolidated statements of financial condition, and includes certain eliminations related to investments in consolidated funds and VIEs and other adjustments. 2. Actual results through June 30, 2021. 3. Quoted as gross annualized ROE. APOLLO INVESTOR DAY 2021 217
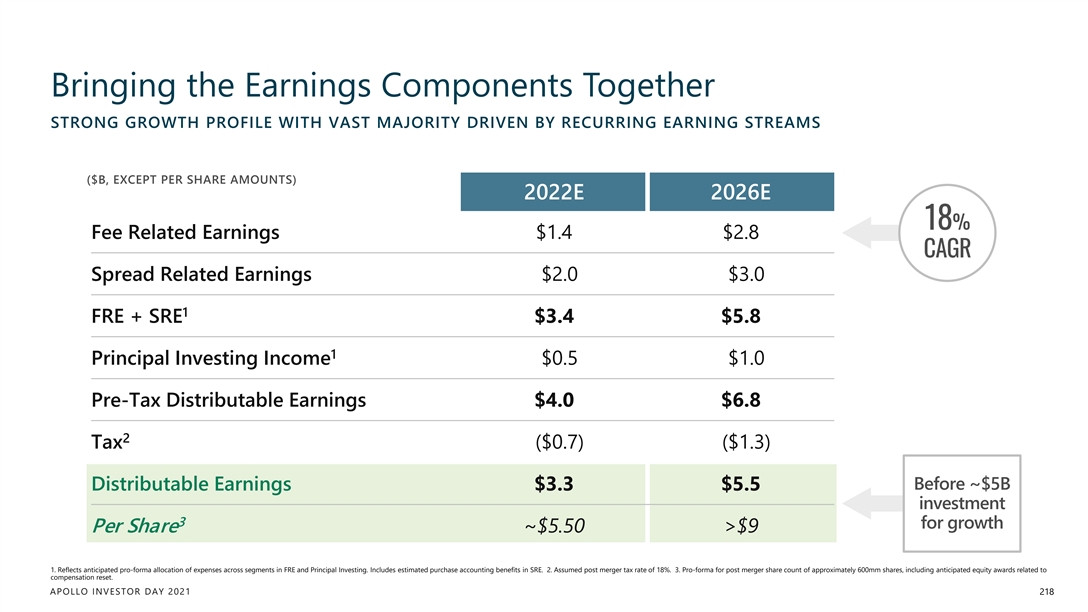
Bringing the Earnings Components Together STRONG GROWTH PROFILE WITH VAST MAJORITY DRIVEN BY RECURRING EARNING STREAMS ($B, EXCEPT PER SHARE AMOUNTS) 2022E 2026E 18% Fee Related Earnings $1.4 $2.8 CAGR Spread Related Earnings $2.0 $3.0 1 FRE + SRE $3.4 $5.8 1 Principal Investing Income $0.5 $1.0 Pre-Tax Distributable Earnings $4.0 $6.8 2 Tax ($0.7) ($1.3) Before ~$5B Distributable Earnings $3.3 $5.5 investment 3 for growth Per Share ~$5.50 >$9 1. Reflects anticipated pro-forma allocation of expenses across segments in FRE and Principal Investing. Includes estimated purchase accounting benefits in SRE. 2. Assumed post merger tax rate of 18%. 3. Pro-forma for post merger share count of approximately 600mm shares, including anticipated equity awards related to compensation reset. APOLLO INVESTOR DAY 2021 218Bringing the Earnings Components Together STRONG GROWTH PROFILE WITH VAST MAJORITY DRIVEN BY RECURRING EARNING STREAMS ($B, EXCEPT PER SHARE AMOUNTS) 2022E 2026E 18% Fee Related Earnings $1.4 $2.8 CAGR Spread Related Earnings $2.0 $3.0 1 FRE + SRE $3.4 $5.8 1 Principal Investing Income $0.5 $1.0 Pre-Tax Distributable Earnings $4.0 $6.8 2 Tax ($0.7) ($1.3) Before ~$5B Distributable Earnings $3.3 $5.5 investment 3 for growth Per Share ~$5.50 >$9 1. Reflects anticipated pro-forma allocation of expenses across segments in FRE and Principal Investing. Includes estimated purchase accounting benefits in SRE. 2. Assumed post merger tax rate of 18%. 3. Pro-forma for post merger share count of approximately 600mm shares, including anticipated equity awards related to compensation reset. APOLLO INVESTOR DAY 2021 218
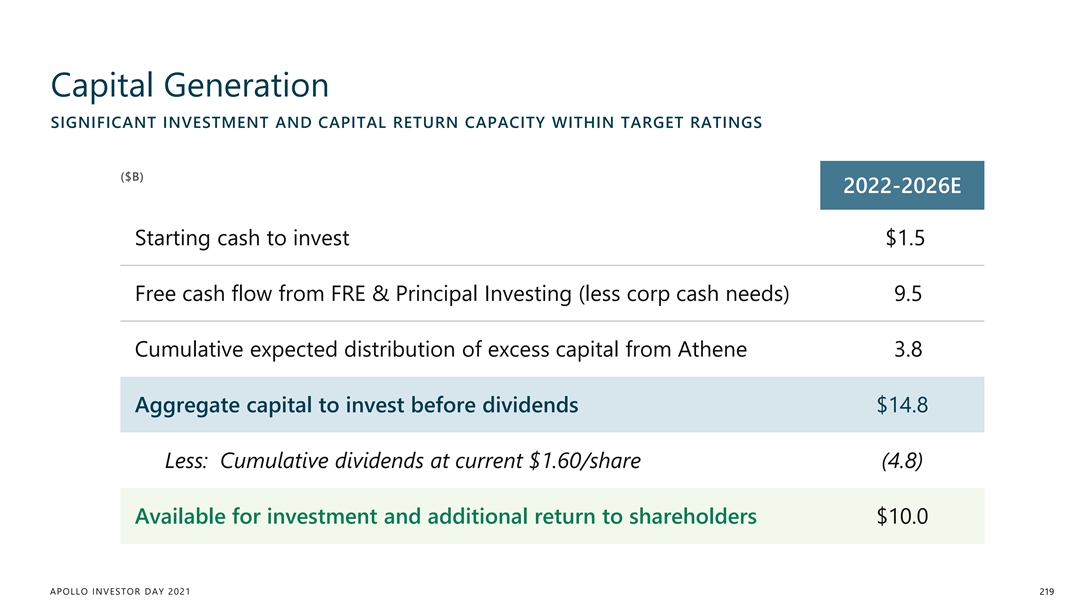
Capital Generation SIGNIFICANT INVESTMENT AND CAPITAL RETURN CAPACITY WITHIN TARGET RATINGS ($B) 2022-2026E Starting cash to invest $1.5 Free cash flow from FRE & Principal Investing (less corp cash needs) 9.5 Cumulative expected distribution of excess capital from Athene 3.8 Aggregate capital to invest before dividends $14.8 Less: Cumulative dividends at current $1.60/share (4.8) Available for investment and additional return to shareholders $10.0 APOLLO INVESTOR DAY 2021 219Capital Generation SIGNIFICANT INVESTMENT AND CAPITAL RETURN CAPACITY WITHIN TARGET RATINGS ($B) 2022-2026E Starting cash to invest $1.5 Free cash flow from FRE & Principal Investing (less corp cash needs) 9.5 Cumulative expected distribution of excess capital from Athene 3.8 Aggregate capital to invest before dividends $14.8 Less: Cumulative dividends at current $1.60/share (4.8) Available for investment and additional return to shareholders $10.0 APOLLO INVESTOR DAY 2021 219
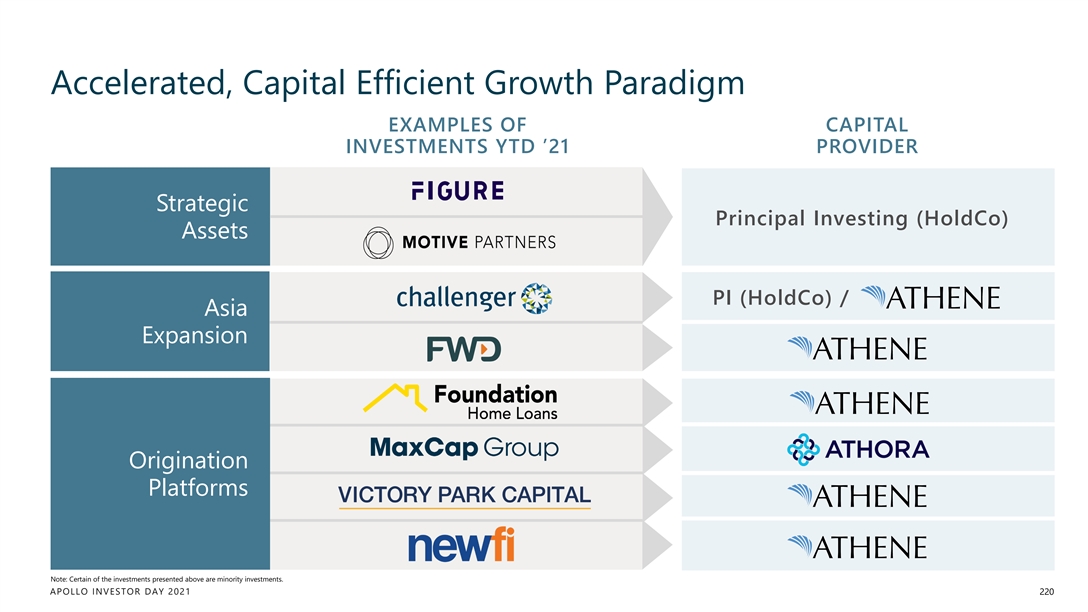
Accelerated, Capital Efficient Growth Paradigm EXAMPLES OF CAPITAL INVESTMENTS YTD ’21 PROVIDER Strategic Principal Investing (HoldCo) Assets PI (HoldCo) / Asia Expansion Origination Platforms Note: Certain of the investments presented above are minority investments. APOLLO INVESTOR DAY 2021 220Accelerated, Capital Efficient Growth Paradigm EXAMPLES OF CAPITAL INVESTMENTS YTD ’21 PROVIDER Strategic Principal Investing (HoldCo) Assets PI (HoldCo) / Asia Expansion Origination Platforms Note: Certain of the investments presented above are minority investments. APOLLO INVESTOR DAY 2021 220
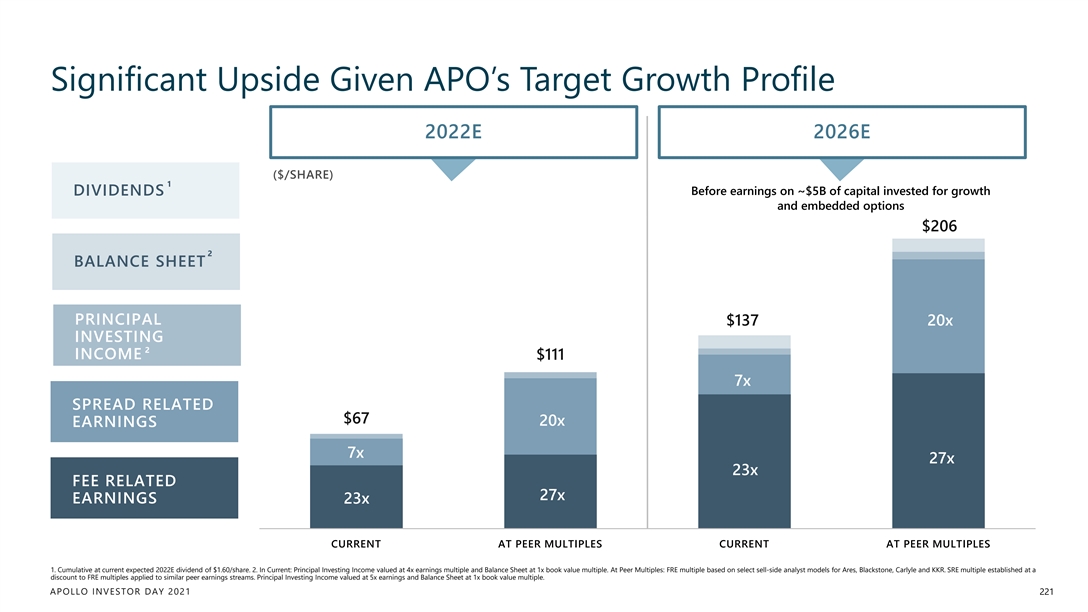
Significant Upside Given APO’s Target Growth Profile 2022E 2026E ($/SHARE) 1 Before earnings on ~$5B of capital invested for growth DIVIDENDS and embedded options $206 2 BALANCE SHEET PRINCIPAL $137 20x 16x INVESTING 2 INCOME $111 7x SPREAD RELATED 16x $67 20x EARNINGS 25x 7x 27x 23x FEE RELATED 25x 27x EARNINGS 23x CURRENT AT PEER MULTIPLES CURRENT AT PEER MULTIPLES 1. Cumulative at current expected 2022E dividend of $1.60/share. 2. In Current: Principal Investing Income valued at 4x earnings multiple and Balance Sheet at 1x book value multiple. At Peer Multiples: FRE multiple based on select sell-side analyst models for Ares, Blackstone, Carlyle and KKR. SRE multiple established at a discount to FRE multiples applied to similar peer earnings streams. Principal Investing Income valued at 5x earnings and Balance Sheet at 1x book value multiple. APOLLO INVESTOR DAY 2021 221
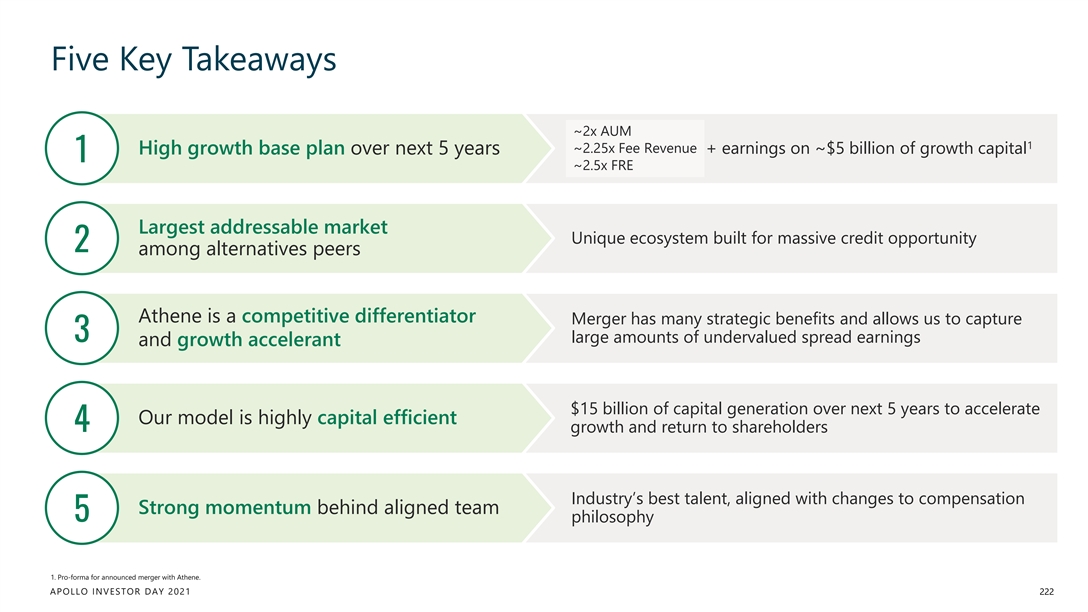
Five Key Takeaways ~2x AUM 1 ~2.25x Fee Revenue + earnings on ~$5 billion of growth capital High growth base plan over next 5 years 1 ~2.5x FRE Largest addressable market Unique ecosystem built for massive credit opportunity 2 among alternatives peers Athene is a competitive differentiator Merger has many strategic benefits and allows us to capture 3 large amounts of undervalued spread earnings and growth accelerant $15 billion of capital generation over next 5 years to accelerate Our model is highly capital efficient 4 growth and return to shareholders Industry’s best talent, aligned with changes to compensation Strong momentum behind aligned team 5 philosophy 1. Pro-forma for announced merger with Athene. APOLLO INVESTOR DAY 2021 222Five Key Takeaways ~2x AUM 1 ~2.25x Fee Revenue + earnings on ~$5 billion of growth capital High growth base plan over next 5 years 1 ~2.5x FRE Largest addressable market Unique ecosystem built for massive credit opportunity 2 among alternatives peers Athene is a competitive differentiator Merger has many strategic benefits and allows us to capture 3 large amounts of undervalued spread earnings and growth accelerant $15 billion of capital generation over next 5 years to accelerate Our model is highly capital efficient 4 growth and return to shareholders Industry’s best talent, aligned with changes to compensation Strong momentum behind aligned team 5 philosophy 1. Pro-forma for announced merger with Athene. APOLLO INVESTOR DAY 2021 222
Closing and Q&A MARC ROWAN, JIM ZELTER, SCOTT KLEINMAN, AND MARTIN KELLY APOLLO INVESTOR DAY 2021Closing and Q&A MARC ROWAN, JIM ZELTER, SCOTT KLEINMAN, AND MARTIN KELLY APOLLO INVESTOR DAY 2021
Appendix & Supplements APOLLO INVESTOR DAY 2021Appendix & Supplements APOLLO INVESTOR DAY 2021
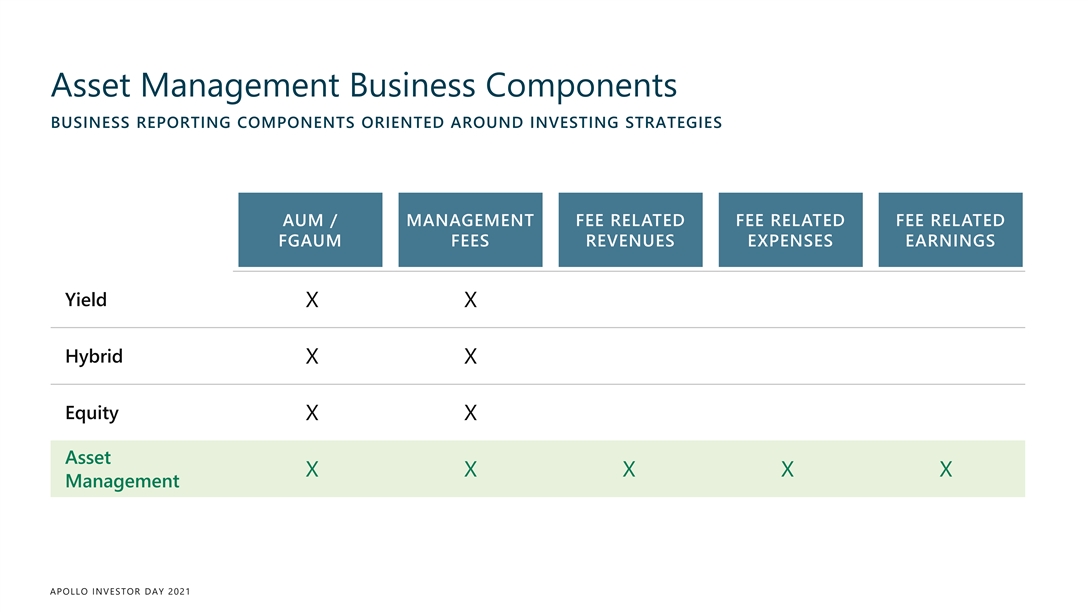
Asset Management Business Components BUSINESS REPORTING COMPONENTS ORIENTED AROUND INVESTING STRATEGIES AUM / MANAGEMENT FEE RELATED FEE RELATED FEE RELATED FGAUM FEES REVENUES EXPENSES EARNINGS Yield X X Hybrid X X Equity X X Asset X X X X X Management APOLLO INVESTOR DAY 2021Asset Management Business Components BUSINESS REPORTING COMPONENTS ORIENTED AROUND INVESTING STRATEGIES AUM / MANAGEMENT FEE RELATED FEE RELATED FEE RELATED FGAUM FEES REVENUES EXPENSES EARNINGS Yield X X Hybrid X X Equity X X Asset X X X X X Management APOLLO INVESTOR DAY 2021
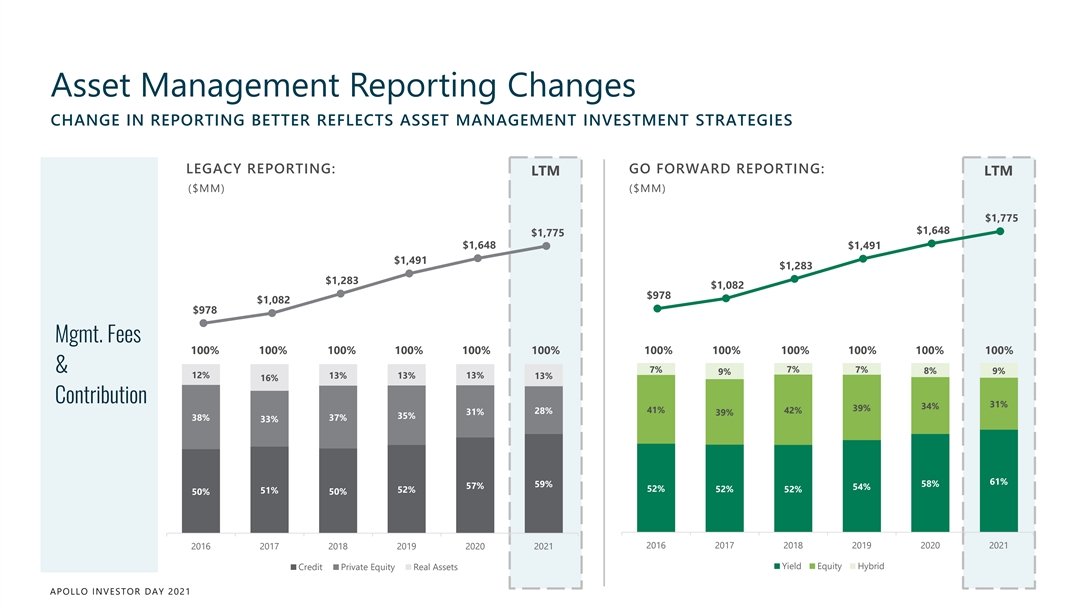
Asset Management Reporting Changes CHANGE IN REPORTING BETTER REFLECTS ASSET MANAGEMENT INVESTMENT STRATEGIES LEGACY REPORTING: GO FORWARD REPORTING: LTM LTM ($MM) ($MM) $1,775 $1,648 $1,775 $1,648 $1,491 $1,491 $1,283 $1,283 $1,082 $978 $1,082 $978 Mgmt. Fees 100% 100% 100% 100% 100% 100% 100% 100% 100% 100% 100% 100% & 7% 7% 7% 8% 9% 9% 12% 13% 13% 13% 13% 16% Contribution 31% 34% 39% 41% 28% 42% 31% 39% 35% 38% 37% 33% 61% 59% 58% 57% 54% 52% 52% 52% 52% 51% 50% 50% 2016 2017 2018 2019 2020 2021 2016 2017 2018 2019 2020 2021 Yield Equity Hybrid Credit Private Equity Real Assets APOLLO INVESTOR DAY 2021
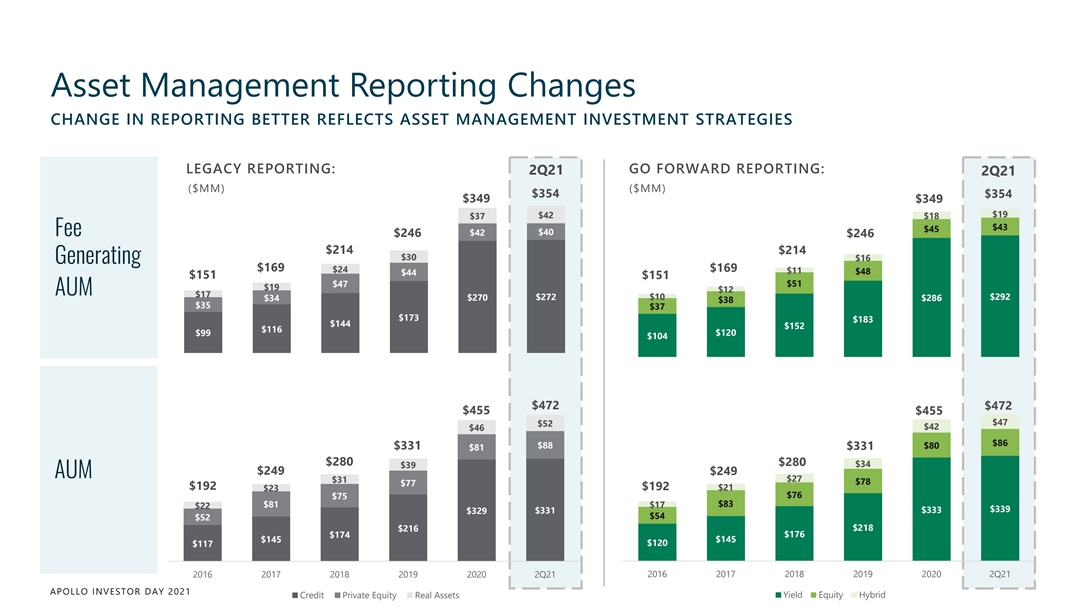
Asset Management Reporting Changes CHANGE IN REPORTING BETTER REFLECTS ASSET MANAGEMENT INVESTMENT STRATEGIES LEGACY REPORTING: GO FORWARD REPORTING: 2Q21 2Q21 ($MM) ($MM) $354 $354 $349 $349 $19 $42 $37 $18 $43 $45 $40 Fee $42 $246 $246 $214 $214 $30 $16 Generating $169 $169 $24 $11 $48 $44 $151 $151 $47 $51 $19 $12 AUM $17 $272 $10 $292 $34 $270 $286 $38 $35 $37 $173 $183 $144 $152 $116 $99 $120 $104 $472 $472 $455 $455 $47 $52 $42 $46 $86 $88 $80 $331 $331 $81 $280 $280 $34 $39 $249 $249 AUM $27 $31 $78 $77 $192 $192 $23 $21 $76 $75 $83 $81 $17 $22 $339 $333 $329 $331 $54 $52 $218 $216 $176 $174 $145 $145 $120 $117 2016 2017 2018 2019 2020 2Q21 2016 2017 2018 2019 2020 2Q21 APOLLO INVESTOR DAY 2021 Credit Private Equity Real Assets Yield Equity HybridAsset Management Reporting Changes CHANGE IN REPORTING BETTER REFLECTS ASSET MANAGEMENT INVESTMENT STRATEGIES LEGACY REPORTING: GO FORWARD REPORTING: 2Q21 2Q21 ($MM) ($MM) $354 $354 $349 $349 $19 $42 $37 $18 $43 $45 $40 Fee $42 $246 $246 $214 $214 $30 $16 Generating $169 $169 $24 $11 $48 $44 $151 $151 $47 $51 $19 $12 AUM $17 $272 $10 $292 $34 $270 $286 $38 $35 $37 $173 $183 $144 $152 $116 $99 $120 $104 $472 $472 $455 $455 $47 $52 $42 $46 $86 $88 $80 $331 $331 $81 $280 $280 $34 $39 $249 $249 AUM $27 $31 $78 $77 $192 $192 $23 $21 $76 $75 $83 $81 $17 $22 $339 $333 $329 $331 $54 $52 $218 $216 $176 $174 $145 $145 $120 $117 2016 2017 2018 2019 2020 2Q21 2016 2017 2018 2019 2020 2Q21 APOLLO INVESTOR DAY 2021 Credit Private Equity Real Assets Yield Equity Hybrid
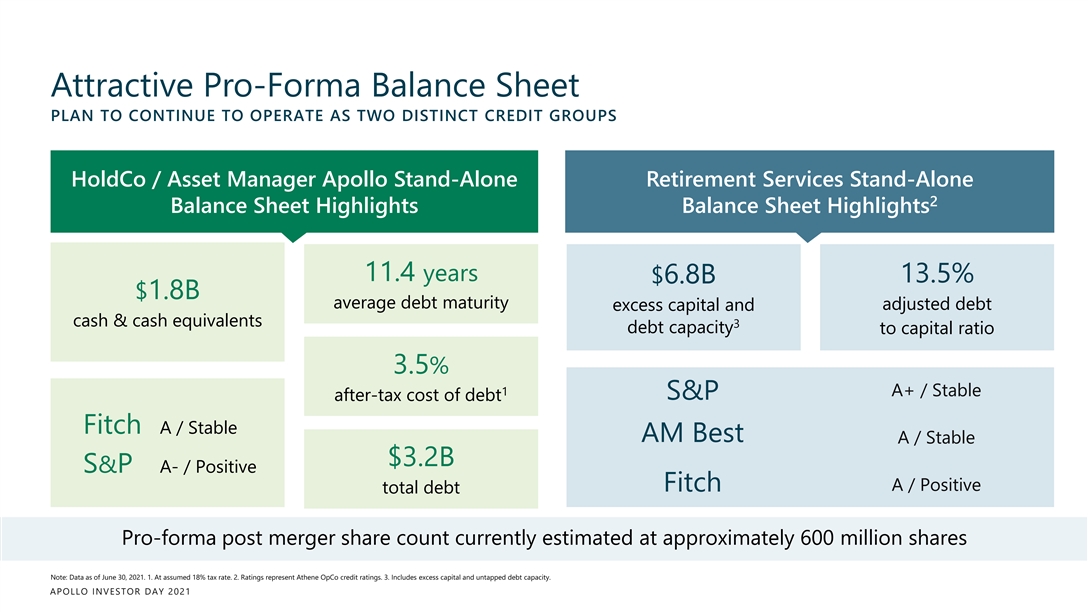
Attractive Pro-Forma Balance Sheet PLAN TO CONTINUE TO OPERATE AS TWO DISTINCT CREDIT GROUPS HoldCo / Asset Manager Apollo Stand-Alone Retirement Services Stand-Alone 2 Balance Sheet Highlights Balance Sheet Highlights 11.4 years 13.5% $6.8B $1.8B average debt maturity adjusted debt excess capital and cash & cash equivalents 3 debt capacity to capital ratio 3.5% 1 A+ / Stable S&P after-tax cost of debt Fitch A / Stable AM Best A / Stable $3.2B S&P A- / Positive A / Positive Fitch total debt Pro-forma post merger share count currently estimated at approximately 600 million shares Note: Data as of June 30, 2021. 1. At assumed 18% tax rate. 2. Ratings represent Athene OpCo credit ratings. 3. Includes excess capital and untapped debt capacity. APOLLO INVESTOR DAY 2021
Reconciliation of GAAP to Non-GAAP Measures APOLLO INVESTOR DAY 2021Reconciliation of GAAP to Non-GAAP Measures APOLLO INVESTOR DAY 2021
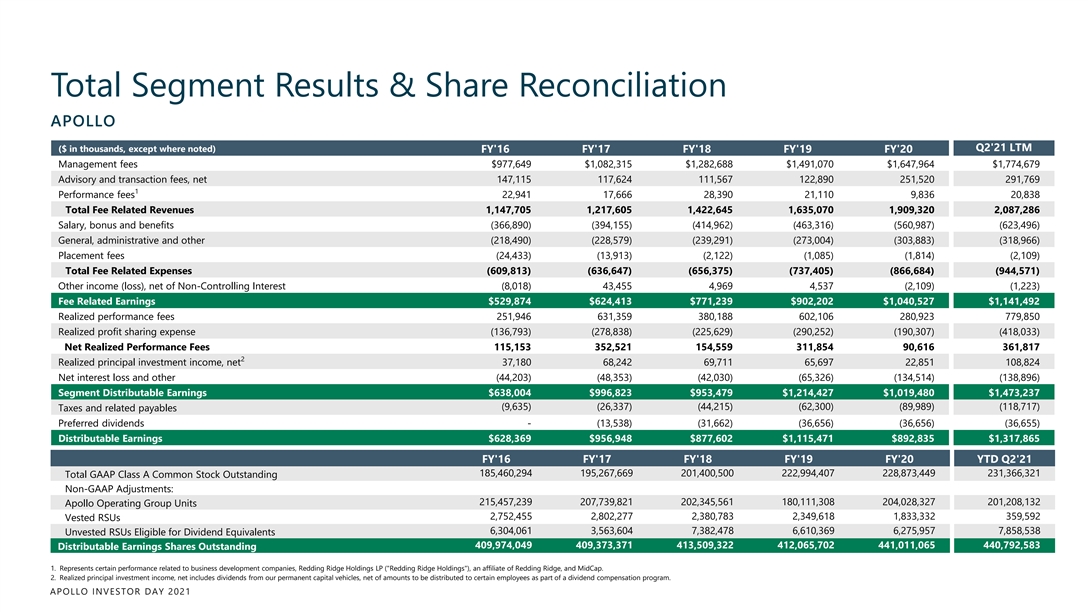
Total Segment Results & Share Reconciliation APOLLO Q2'21 LTM ($ in thousands, except where noted) FY'16 FY'17 FY'18 FY'19 FY'20 Management fees $977,649 $1,082,315 $1,282,688 $1,491,070 $1,647,964 $1,774,679 Advisory and transaction fees, net 147,115 117,624 111,567 122,890 251,520 291,769 1 Performance fees 22,941 17,666 28,390 21,110 9,836 20,838 Total Fee Related Revenues 1,147,705 1,217,605 1,422,645 1,635,070 1,909,320 2,087,286 Salary, bonus and benefits (366,890) (394,155) (414,962) (463,316) (560,987) (623,496) General, administrative and other (218,490) (228,579) (239,291) (273,004) (303,883) (318,966) Placement fees (24,433) (13,913) (2,122) (1,085) (1,814) (2,109) Total Fee Related Expenses (609,813) (636,647) (656,375) (737,405) (866,684) (944,571) Other income (loss), net of Non-Controlling Interest (8,018) 43,455 4,969 4,537 (2,109) (1,223) Fee Related Earnings $529,874 $624,413 $771,239 $902,202 $1,040,527 $1,141,492 Realized performance fees 251,946 631,359 380,188 602,106 280,923 779,850 Realized profit sharing expense (136,793) (278,838) (225,629) (290,252) (190,307) (418,033) Net Realized Performance Fees 115,153 352,521 154,559 311,854 90,616 361,817 2 Realized principal investment income, net 37,180 68,242 69,711 65,697 22,851 108,824 Net interest loss and other (44,203) (48,353) (42,030) (65,326) (134,514) (138,896) Segment Distributable Earnings $638,004 $996,823 $953,479 $1,214,427 $1,019,480 $1,473,237 (9,635) (26,337) (44,215) (62,300) (89,989) (118,717) Taxes and related payables Preferred dividends - (13,538) (31,662) (36,656) (36,656) (36,655) Distributable Earnings $628,369 $956,948 $877,602 $1,115,471 $892,835 $1,317,865 FY'16 FY'17 FY'18 FY'19 FY'20 YTD Q2'21 185,460,294 195,267,669 201,400,500 222,994,407 228,873,449 231,366,321 Total GAAP Class A Common Stock Outstanding Non-GAAP Adjustments: 215,457,239 207,739,821 202,345,561 180,111,308 204,028,327 201,208,132 Apollo Operating Group Units 2,752,455 2,802,277 2,380,783 2,349,618 1,833,332 359,592 Vested RSUs 6,304,061 3,563,604 7,382,478 6,610,369 6,275,957 7,858,538 Unvested RSUs Eligible for Dividend Equivalents 409,974,049 409,373,371 413,509,322 412,065,702 441,011,065 440,792,583 Distributable Earnings Shares Outstanding 1. Represents certain performance related to business development companies, Redding Ridge Holdings LP ( Redding Ridge Holdings ), an affiliate of Redding Ridge, and MidCap. 2. Realized principal investment income, net includes dividends from our permanent capital vehicles, net of amounts to be distributed to certain employees as part of a dividend compensation program. APOLLO INVESTOR DAY 2021Total Segment Results & Share Reconciliation APOLLO Q2'21 LTM ($ in thousands, except where noted) FY'16 FY'17 FY'18 FY'19 FY'20 Management fees $977,649 $1,082,315 $1,282,688 $1,491,070 $1,647,964 $1,774,679 Advisory and transaction fees, net 147,115 117,624 111,567 122,890 251,520 291,769 1 Performance fees 22,941 17,666 28,390 21,110 9,836 20,838 Total Fee Related Revenues 1,147,705 1,217,605 1,422,645 1,635,070 1,909,320 2,087,286 Salary, bonus and benefits (366,890) (394,155) (414,962) (463,316) (560,987) (623,496) General, administrative and other (218,490) (228,579) (239,291) (273,004) (303,883) (318,966) Placement fees (24,433) (13,913) (2,122) (1,085) (1,814) (2,109) Total Fee Related Expenses (609,813) (636,647) (656,375) (737,405) (866,684) (944,571) Other income (loss), net of Non-Controlling Interest (8,018) 43,455 4,969 4,537 (2,109) (1,223) Fee Related Earnings $529,874 $624,413 $771,239 $902,202 $1,040,527 $1,141,492 Realized performance fees 251,946 631,359 380,188 602,106 280,923 779,850 Realized profit sharing expense (136,793) (278,838) (225,629) (290,252) (190,307) (418,033) Net Realized Performance Fees 115,153 352,521 154,559 311,854 90,616 361,817 2 Realized principal investment income, net 37,180 68,242 69,711 65,697 22,851 108,824 Net interest loss and other (44,203) (48,353) (42,030) (65,326) (134,514) (138,896) Segment Distributable Earnings $638,004 $996,823 $953,479 $1,214,427 $1,019,480 $1,473,237 (9,635) (26,337) (44,215) (62,300) (89,989) (118,717) Taxes and related payables Preferred dividends - (13,538) (31,662) (36,656) (36,656) (36,655) Distributable Earnings $628,369 $956,948 $877,602 $1,115,471 $892,835 $1,317,865 FY'16 FY'17 FY'18 FY'19 FY'20 YTD Q2'21 185,460,294 195,267,669 201,400,500 222,994,407 228,873,449 231,366,321 Total GAAP Class A Common Stock Outstanding Non-GAAP Adjustments: 215,457,239 207,739,821 202,345,561 180,111,308 204,028,327 201,208,132 Apollo Operating Group Units 2,752,455 2,802,277 2,380,783 2,349,618 1,833,332 359,592 Vested RSUs 6,304,061 3,563,604 7,382,478 6,610,369 6,275,957 7,858,538 Unvested RSUs Eligible for Dividend Equivalents 409,974,049 409,373,371 413,509,322 412,065,702 441,011,065 440,792,583 Distributable Earnings Shares Outstanding 1. Represents certain performance related to business development companies, Redding Ridge Holdings LP ( Redding Ridge Holdings ), an affiliate of Redding Ridge, and MidCap. 2. Realized principal investment income, net includes dividends from our permanent capital vehicles, net of amounts to be distributed to certain employees as part of a dividend compensation program. APOLLO INVESTOR DAY 2021

Reconciliation of GAAP to Non-GAAP Financial Measures APOLLO ($ in thousands, except where noted) FY'16 FY'17 FY'18 FY'19 FY'20 Q2'21 LTM Net Income (Loss) Attributable to AGM Class A Common Stockholders $402,850 $615,566 ($42,038) $806,537 $119,958 $2,006,465 - 13,538 31,662 36,656 36,656 36,655 Preferred dividends 5,789 8,891 31,648 30,504 118,378 428,573 Net income (loss) attributable to Non-Controlling Interests in consolidated entities 561,668 805,644 (2,021) 663,146 191,810 2,303,830 Net income (loss) attributable to Non-Controlling Interests in the Apollo Operating Group GAAP Net Income $970,307 $1,443,639 $19,251 $1,536,843 $466,802 $4,775,523 90,707 325,945 86,021 (128,994) 86,966 639,793 Income tax provision (benefit) GAAP Income Before Income Tax Provision (Benefit) $1,061,014 $1,769,584 $105,272 $1,407,849 $553,768 $5,415,316 1 55,302 17,496 (5,631) 49,213 39,186 80,141 Transaction related charges - - - 21,987 3,893 2,829 Charges associated with corporate conversion (3,208) (200,240) (35,405) 50,307 (12,426) (14,367) (Gains) losses from remeasurement of tax receivable agreement liability (5,789) (8,891) (31,648) (30,504) (118,378) (428,573) Net (income) loss attributable to Non-Controlling Interests in consolidated entities (510,999) (688,565) 782,888 (434,582) (34,796) (2,497,570) Unrealized performance fees 179,857 226,319 (274,812) 207,592 33,350 1,060,979 Unrealized profit sharing expense 2 3,127 6,980 91,051 96,208 129,084 117,997 Equity-based profit sharing expense and other 63,081 64,954 68,229 70,962 67,852 71,684 Equity-based compensation (65,401) (94,709) 62,097 (88,576) (62,485) (529,338) Unrealized principal investment (income) loss (138,980) (96,105) 191,438 (136,029) 420,432 (1,805,861) Unrealized net (gains) losses from investment activities and other $638,004 $996,823 $953,479 $1,214,427 $1,019,480 $1,473,237 Segment Distributable Earnings (9,635) (26,337) (44,215) (62,300) (89,989) (118,717) Taxes and related payables - (13,538) (31,662) (36,656) (36,656) (36,655) Preferred dividends $628,369 $956,948 $877,602 $1,115,471 $892,835 $1,317,865 Distributable Earnings - 13,538 31,662 36,656 36,656 36,655 Preferred dividends 9,635 26,337 44,215 62,300 89,989 118,717 Taxes and related payables (251,946) (631,359) (380,188) (602,106) (280,923) (779,850) Realized performance fees 136,793 278,838 225,629 290,252 190,307 418,033 Realized profit sharing expense (37,180) (68,242) (69,711) (65,697) (22,851) (108,824) Realized principal investment income, net 44,203 48,353 42,030 65,326 134,514 138,896 Net interest loss and other $529,874 $624,413 $771,239 $902,202 $1,040,527 $1,141,492 Fee Related Earnings 1. Transaction-related charges include equity-based compensation charges, the amortization of intangible assets, contingent consideration and certain other charges associated with acquisitions, and restructuring charges. 2. Equity-based profit sharing expense and other includes certain profit sharing arrangements in which a portion of performance fees distributed to the general partner are allocated by issuance of equity-based awards, rather than cash, to employees of Apollo. Equity-based profit sharing expense and other also includes non-cash expenses related to equity awards granted by unconsolidated related parties to employees of Apollo. APOLLO INVESTOR DAY 2021Reconciliation of GAAP to Non-GAAP Financial Measures APOLLO ($ in thousands, except where noted) FY'16 FY'17 FY'18 FY'19 FY'20 Q2'21 LTM Net Income (Loss) Attributable to AGM Class A Common Stockholders $402,850 $615,566 ($42,038) $806,537 $119,958 $2,006,465 - 13,538 31,662 36,656 36,656 36,655 Preferred dividends 5,789 8,891 31,648 30,504 118,378 428,573 Net income (loss) attributable to Non-Controlling Interests in consolidated entities 561,668 805,644 (2,021) 663,146 191,810 2,303,830 Net income (loss) attributable to Non-Controlling Interests in the Apollo Operating Group GAAP Net Income $970,307 $1,443,639 $19,251 $1,536,843 $466,802 $4,775,523 90,707 325,945 86,021 (128,994) 86,966 639,793 Income tax provision (benefit) GAAP Income Before Income Tax Provision (Benefit) $1,061,014 $1,769,584 $105,272 $1,407,849 $553,768 $5,415,316 1 55,302 17,496 (5,631) 49,213 39,186 80,141 Transaction related charges - - - 21,987 3,893 2,829 Charges associated with corporate conversion (3,208) (200,240) (35,405) 50,307 (12,426) (14,367) (Gains) losses from remeasurement of tax receivable agreement liability (5,789) (8,891) (31,648) (30,504) (118,378) (428,573) Net (income) loss attributable to Non-Controlling Interests in consolidated entities (510,999) (688,565) 782,888 (434,582) (34,796) (2,497,570) Unrealized performance fees 179,857 226,319 (274,812) 207,592 33,350 1,060,979 Unrealized profit sharing expense 2 3,127 6,980 91,051 96,208 129,084 117,997 Equity-based profit sharing expense and other 63,081 64,954 68,229 70,962 67,852 71,684 Equity-based compensation (65,401) (94,709) 62,097 (88,576) (62,485) (529,338) Unrealized principal investment (income) loss (138,980) (96,105) 191,438 (136,029) 420,432 (1,805,861) Unrealized net (gains) losses from investment activities and other $638,004 $996,823 $953,479 $1,214,427 $1,019,480 $1,473,237 Segment Distributable Earnings (9,635) (26,337) (44,215) (62,300) (89,989) (118,717) Taxes and related payables - (13,538) (31,662) (36,656) (36,656) (36,655) Preferred dividends $628,369 $956,948 $877,602 $1,115,471 $892,835 $1,317,865 Distributable Earnings - 13,538 31,662 36,656 36,656 36,655 Preferred dividends 9,635 26,337 44,215 62,300 89,989 118,717 Taxes and related payables (251,946) (631,359) (380,188) (602,106) (280,923) (779,850) Realized performance fees 136,793 278,838 225,629 290,252 190,307 418,033 Realized profit sharing expense (37,180) (68,242) (69,711) (65,697) (22,851) (108,824) Realized principal investment income, net 44,203 48,353 42,030 65,326 134,514 138,896 Net interest loss and other $529,874 $624,413 $771,239 $902,202 $1,040,527 $1,141,492 Fee Related Earnings 1. Transaction-related charges include equity-based compensation charges, the amortization of intangible assets, contingent consideration and certain other charges associated with acquisitions, and restructuring charges. 2. Equity-based profit sharing expense and other includes certain profit sharing arrangements in which a portion of performance fees distributed to the general partner are allocated by issuance of equity-based awards, rather than cash, to employees of Apollo. Equity-based profit sharing expense and other also includes non-cash expenses related to equity awards granted by unconsolidated related parties to employees of Apollo. APOLLO INVESTOR DAY 2021
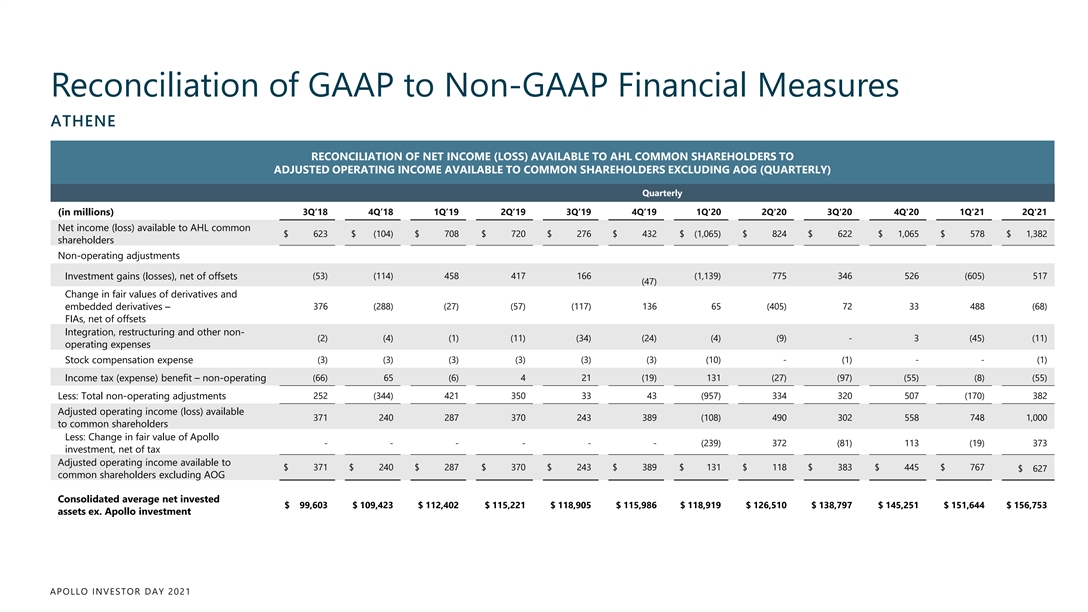
Reconciliation of GAAP to Non-GAAP Financial Measures ATHENE RECONCILIATION OF NET INCOME (LOSS) AVAILABLE TO AHL COMMON SHAREHOLDERS TO ADJUSTED OPERATING INCOME AVAILABLE TO COMMON SHAREHOLDERS EXCLUDING AOG (QUARTERLY) Quarterly (in millions) 3Q’18 4Q’18 1Q’19 2Q’19 3Q’19 4Q’19 1Q'20 2Q'20 3Q'20 4Q'20 1Q'21 2Q'21 Net income (loss) available to AHL common $ 623 $ (104) $ 708 $ 720 $ 276 $ 432 $ (1,065) $ 824 $ 622 $ 1,065 $ 578 $ 1,382 shareholders Non-operating adjustments (53) (114) 458 417 166 (1,139) 775 346 526 (605) 517 Investment gains (losses), net of offsets (47) Change in fair values of derivatives and embedded derivatives – 376 (288) (27) (57) (117) 136 65 (405) 72 33 488 (68) FIAs, net of offsets Integration, restructuring and other non- (2) (4) (1) (11) (34) (24) (4) (9) - 3 (45) (11) operating expenses Stock compensation expense (3) (3) (3) (3) (3) (3) (10) - (1) - - (1) Income tax (expense) benefit – non-operating (66) 65 (6) 4 21 (19) 131 (27) (97) (55) (8) (55) Less: Total non-operating adjustments 252 (344) 421 350 33 43 (957) 334 320 507 (170) 382 Adjusted operating income (loss) available 371 240 287 370 243 389 (108) 490 302 558 748 1,000 to common shareholders Less: Change in fair value of Apollo - - - - - - (239) 372 (81) 113 (19) 373 investment, net of tax Adjusted operating income available to $ 371 $ 240 $ 287 $ 370 $ 243 $ 389 $ 131 $ 118 $ 383 $ 445 $ 767 $ 627 common shareholders excluding AOG Consolidated average net invested $ 99,603 $ 109,423 $ 112,402 $ 115,221 $ 118,905 $ 115,986 $ 118,919 $ 126,510 $ 138,797 $ 145,251 $ 151,644 $ 156,753 assets ex. Apollo investment APOLLO INVESTOR DAY 2021Reconciliation of GAAP to Non-GAAP Financial Measures ATHENE RECONCILIATION OF NET INCOME (LOSS) AVAILABLE TO AHL COMMON SHAREHOLDERS TO ADJUSTED OPERATING INCOME AVAILABLE TO COMMON SHAREHOLDERS EXCLUDING AOG (QUARTERLY) Quarterly (in millions) 3Q’18 4Q’18 1Q’19 2Q’19 3Q’19 4Q’19 1Q'20 2Q'20 3Q'20 4Q'20 1Q'21 2Q'21 Net income (loss) available to AHL common $ 623 $ (104) $ 708 $ 720 $ 276 $ 432 $ (1,065) $ 824 $ 622 $ 1,065 $ 578 $ 1,382 shareholders Non-operating adjustments (53) (114) 458 417 166 (1,139) 775 346 526 (605) 517 Investment gains (losses), net of offsets (47) Change in fair values of derivatives and embedded derivatives – 376 (288) (27) (57) (117) 136 65 (405) 72 33 488 (68) FIAs, net of offsets Integration, restructuring and other non- (2) (4) (1) (11) (34) (24) (4) (9) - 3 (45) (11) operating expenses Stock compensation expense (3) (3) (3) (3) (3) (3) (10) - (1) - - (1) Income tax (expense) benefit – non-operating (66) 65 (6) 4 21 (19) 131 (27) (97) (55) (8) (55) Less: Total non-operating adjustments 252 (344) 421 350 33 43 (957) 334 320 507 (170) 382 Adjusted operating income (loss) available 371 240 287 370 243 389 (108) 490 302 558 748 1,000 to common shareholders Less: Change in fair value of Apollo - - - - - - (239) 372 (81) 113 (19) 373 investment, net of tax Adjusted operating income available to $ 371 $ 240 $ 287 $ 370 $ 243 $ 389 $ 131 $ 118 $ 383 $ 445 $ 767 $ 627 common shareholders excluding AOG Consolidated average net invested $ 99,603 $ 109,423 $ 112,402 $ 115,221 $ 118,905 $ 115,986 $ 118,919 $ 126,510 $ 138,797 $ 145,251 $ 151,644 $ 156,753 assets ex. Apollo investment APOLLO INVESTOR DAY 2021
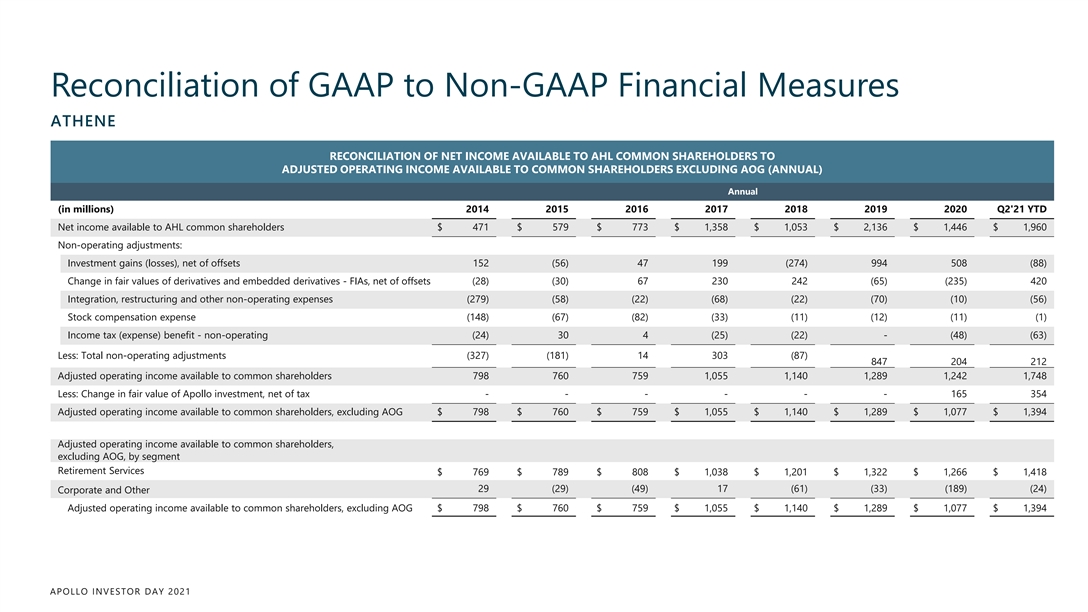
Reconciliation of GAAP to Non-GAAP Financial Measures ATHENE RECONCILIATION OF NET INCOME AVAILABLE TO AHL COMMON SHAREHOLDERS TO ADJUSTED OPERATING INCOME AVAILABLE TO COMMON SHAREHOLDERS EXCLUDING AOG (ANNUAL) Annual (in millions) 2014 2015 2016 2017 2018 2019 2020 Q2'21 YTD Net income available to AHL common shareholders $ 471 $ 579 $ 773 $ 1,358 $ 1,053 $ 2,136 $ 1,446 $ 1,960 Non-operating adjustments: Investment gains (losses), net of offsets 152 (56) 47 199 (274) 994 508 (88) Change in fair values of derivatives and embedded derivatives - FIAs, net of offsets (28) (30) 67 230 242 (65) (235) 420 Integration, restructuring and other non-operating expenses (279) (58) (22) (68) (22) (70) (10) (56) Stock compensation expense (148) (67) (82) (33) (11) (12) (11) (1) Income tax (expense) benefit - non-operating (24) 30 4 (25) (22) - (48) (63) Less: Total non-operating adjustments (327) (181) 14 303 (87) 847 204 212 Adjusted operating income available to common shareholders 798 760 759 1,055 1,140 1,289 1,242 1,748 Less: Change in fair value of Apollo investment, net of tax - - - - - - 165 354 Adjusted operating income available to common shareholders, excluding AOG $ 798 $ 760 $ 759 $ 1,055 $ 1,140 $ 1,289 $ 1,077 $ 1,394 Adjusted operating income available to common shareholders, excluding AOG, by segment Retirement Services $ 769 $ 789 $ 808 $ 1,038 $ 1,201 $ 1,322 $ 1,266 $ 1,418 29 (29) (49) 17 (61) (33) (189) (24) Corporate and Other Adjusted operating income available to common shareholders, excluding AOG $ 798 $ 760 $ 759 $ 1,055 $ 1,140 $ 1,289 $ 1,077 $ 1,394 APOLLO INVESTOR DAY 2021Reconciliation of GAAP to Non-GAAP Financial Measures ATHENE RECONCILIATION OF NET INCOME AVAILABLE TO AHL COMMON SHAREHOLDERS TO ADJUSTED OPERATING INCOME AVAILABLE TO COMMON SHAREHOLDERS EXCLUDING AOG (ANNUAL) Annual (in millions) 2014 2015 2016 2017 2018 2019 2020 Q2'21 YTD Net income available to AHL common shareholders $ 471 $ 579 $ 773 $ 1,358 $ 1,053 $ 2,136 $ 1,446 $ 1,960 Non-operating adjustments: Investment gains (losses), net of offsets 152 (56) 47 199 (274) 994 508 (88) Change in fair values of derivatives and embedded derivatives - FIAs, net of offsets (28) (30) 67 230 242 (65) (235) 420 Integration, restructuring and other non-operating expenses (279) (58) (22) (68) (22) (70) (10) (56) Stock compensation expense (148) (67) (82) (33) (11) (12) (11) (1) Income tax (expense) benefit - non-operating (24) 30 4 (25) (22) - (48) (63) Less: Total non-operating adjustments (327) (181) 14 303 (87) 847 204 212 Adjusted operating income available to common shareholders 798 760 759 1,055 1,140 1,289 1,242 1,748 Less: Change in fair value of Apollo investment, net of tax - - - - - - 165 354 Adjusted operating income available to common shareholders, excluding AOG $ 798 $ 760 $ 759 $ 1,055 $ 1,140 $ 1,289 $ 1,077 $ 1,394 Adjusted operating income available to common shareholders, excluding AOG, by segment Retirement Services $ 769 $ 789 $ 808 $ 1,038 $ 1,201 $ 1,322 $ 1,266 $ 1,418 29 (29) (49) 17 (61) (33) (189) (24) Corporate and Other Adjusted operating income available to common shareholders, excluding AOG $ 798 $ 760 $ 759 $ 1,055 $ 1,140 $ 1,289 $ 1,077 $ 1,394 APOLLO INVESTOR DAY 2021
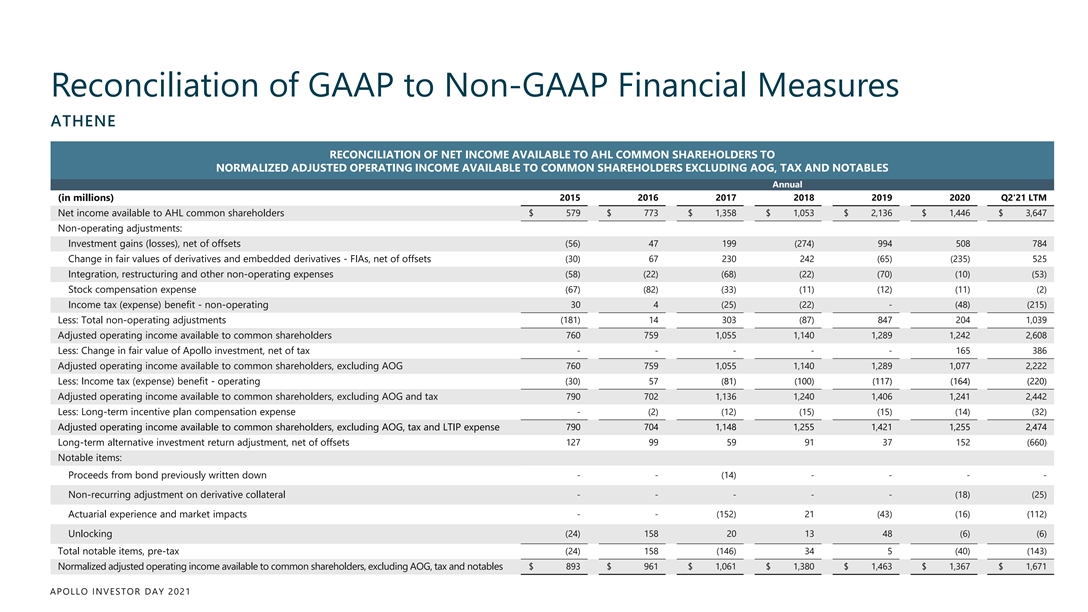
Reconciliation of GAAP to Non-GAAP Financial Measures ATHENE RECONCILIATION OF NET INCOME AVAILABLE TO AHL COMMON SHAREHOLDERS TO NORMALIZED ADJUSTED OPERATING INCOME AVAILABLE TO COMMON SHAREHOLDERS EXCLUDING AOG, TAX AND NOTABLES Annual (in millions) 2015 2016 2017 2018 2019 2020 Q2'21 LTM Net income available to AHL common shareholders $ 579 $ 773 $ 1,358 $ 1,053 $ 2,136 $ 1,446 $ 3,647 Non-operating adjustments: Investment gains (losses), net of offsets (56) 47 199 (274) 994 508 784 Change in fair values of derivatives and embedded derivatives - FIAs, net of offsets (30) 67 230 242 (65) (235) 525 (58) (22) (68) (22) (70) (10) (53) Integration, restructuring and other non-operating expenses Stock compensation expense (67) (82) (33) (11) (12) (11) (2) Income tax (expense) benefit - non-operating 30 4 (25) (22) - (48) (215) Less: Total non-operating adjustments (181) 14 303 (87) 847 204 1,039 Adjusted operating income available to common shareholders 760 759 1,055 1,140 1,289 1,242 2,608 Less: Change in fair value of Apollo investment, net of tax - - - - - 165 386 Adjusted operating income available to common shareholders, excluding AOG 760 759 1,055 1,140 1,289 1,077 2,222 (30) 57 (81) (100) (117) (164) (220) Less: Income tax (expense) benefit - operating Adjusted operating income available to common shareholders, excluding AOG and tax 790 702 1,136 1,240 1,406 1,241 2,442 Less: Long-term incentive plan compensation expense - (2) (12) (15) (15) (14) (32) Adjusted operating income available to common shareholders, excluding AOG, tax and LTIP expense 790 704 1,148 1,255 1,421 1,255 2,474 Long-term alternative investment return adjustment, net of offsets 127 99 59 91 37 152 (660) Notable items: - - (14) - - - - Proceeds from bond previously written down Non-recurring adjustment on derivative collateral - - - - - (18) (25) - - (152) 21 (43) (16) (112) Actuarial experience and market impacts Unlocking (24) 158 20 13 48 (6) (6) (24) 158 (146) 34 5 (40) (143) Total notable items, pre-tax Normalized adjusted operating income available to common shareholders, excluding AOG, tax and notables $ 893 $ 961 $ 1,061 $ 1,380 $ 1,463 $ 1,367 $ 1,671 APOLLO INVESTOR DAY 2021Reconciliation of GAAP to Non-GAAP Financial Measures ATHENE RECONCILIATION OF NET INCOME AVAILABLE TO AHL COMMON SHAREHOLDERS TO NORMALIZED ADJUSTED OPERATING INCOME AVAILABLE TO COMMON SHAREHOLDERS EXCLUDING AOG, TAX AND NOTABLES Annual (in millions) 2015 2016 2017 2018 2019 2020 Q2'21 LTM Net income available to AHL common shareholders $ 579 $ 773 $ 1,358 $ 1,053 $ 2,136 $ 1,446 $ 3,647 Non-operating adjustments: Investment gains (losses), net of offsets (56) 47 199 (274) 994 508 784 Change in fair values of derivatives and embedded derivatives - FIAs, net of offsets (30) 67 230 242 (65) (235) 525 (58) (22) (68) (22) (70) (10) (53) Integration, restructuring and other non-operating expenses Stock compensation expense (67) (82) (33) (11) (12) (11) (2) Income tax (expense) benefit - non-operating 30 4 (25) (22) - (48) (215) Less: Total non-operating adjustments (181) 14 303 (87) 847 204 1,039 Adjusted operating income available to common shareholders 760 759 1,055 1,140 1,289 1,242 2,608 Less: Change in fair value of Apollo investment, net of tax - - - - - 165 386 Adjusted operating income available to common shareholders, excluding AOG 760 759 1,055 1,140 1,289 1,077 2,222 (30) 57 (81) (100) (117) (164) (220) Less: Income tax (expense) benefit - operating Adjusted operating income available to common shareholders, excluding AOG and tax 790 702 1,136 1,240 1,406 1,241 2,442 Less: Long-term incentive plan compensation expense - (2) (12) (15) (15) (14) (32) Adjusted operating income available to common shareholders, excluding AOG, tax and LTIP expense 790 704 1,148 1,255 1,421 1,255 2,474 Long-term alternative investment return adjustment, net of offsets 127 99 59 91 37 152 (660) Notable items: - - (14) - - - - Proceeds from bond previously written down Non-recurring adjustment on derivative collateral - - - - - (18) (25) - - (152) 21 (43) (16) (112) Actuarial experience and market impacts Unlocking (24) 158 20 13 48 (6) (6) (24) 158 (146) 34 5 (40) (143) Total notable items, pre-tax Normalized adjusted operating income available to common shareholders, excluding AOG, tax and notables $ 893 $ 961 $ 1,061 $ 1,380 $ 1,463 $ 1,367 $ 1,671 APOLLO INVESTOR DAY 2021
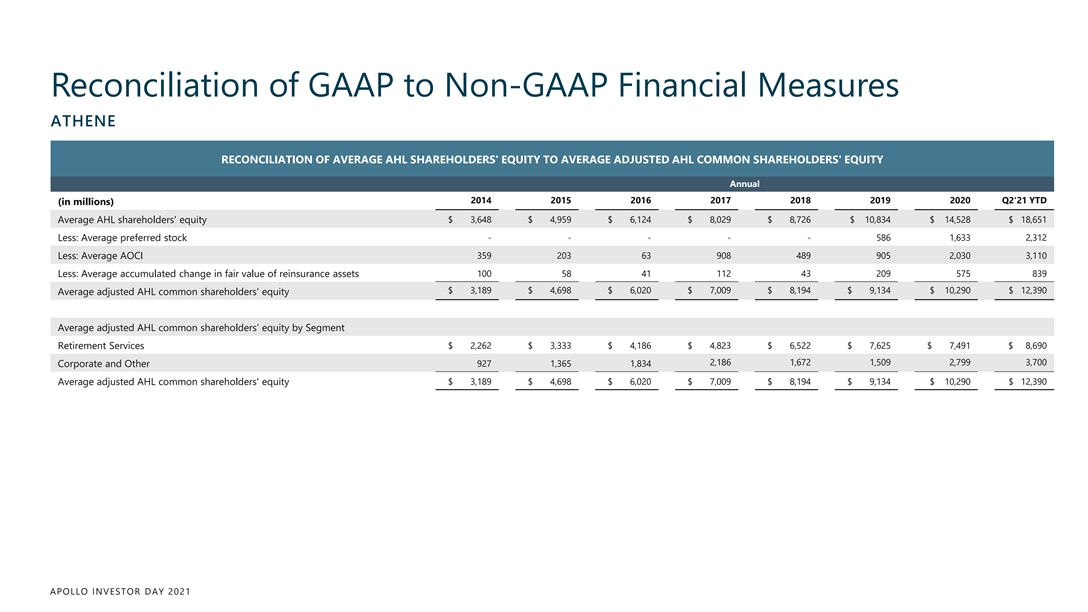
Reconciliation of GAAP to Non-GAAP Financial Measures ATHENE RECONCILIATION OF AVERAGE AHL SHAREHOLDERS' EQUITY TO AVERAGE ADJUSTED AHL COMMON SHAREHOLDERS' EQUITY Annual 2014 2015 2016 2017 2018 2019 2020 Q2'21 YTD (in millions) Average AHL shareholders' equity $ 3,648 $ 4,959 $ 6,124 $ 8,029 $ 8,726 $ 10,834 $ 14,528 $ 18,651 Less: Average preferred stock - - - - - 586 1,633 2,312 Less: Average AOCI 359 203 63 908 489 905 2,030 3,110 Less: Average accumulated change in fair value of reinsurance assets 100 58 41 112 43 209 575 839 $ 3,189 $ 4,698 $ 6,020 $ 7,009 $ 8,194 $ 9,134 $ 10,290 $ 12,390 Average adjusted AHL common shareholders' equity Average adjusted AHL common shareholders’ equity by Segment Retirement Services $ 2,262 $ 3,333 $ 4,186 $ 4,823 $ 6,522 $ 7,625 $ 7,491 $ 8,690 2,186 1,672 1,509 2,799 3,700 Corporate and Other 927 1,365 1,834 Average adjusted AHL common shareholders' equity $ 3,189 $ 4,698 $ 6,020 $ 7,009 $ 8,194 $ 9,134 $ 10,290 $ 12,390 APOLLO INVESTOR DAY 2021Reconciliation of GAAP to Non-GAAP Financial Measures ATHENE RECONCILIATION OF AVERAGE AHL SHAREHOLDERS' EQUITY TO AVERAGE ADJUSTED AHL COMMON SHAREHOLDERS' EQUITY Annual 2014 2015 2016 2017 2018 2019 2020 Q2'21 YTD (in millions) Average AHL shareholders' equity $ 3,648 $ 4,959 $ 6,124 $ 8,029 $ 8,726 $ 10,834 $ 14,528 $ 18,651 Less: Average preferred stock - - - - - 586 1,633 2,312 Less: Average AOCI 359 203 63 908 489 905 2,030 3,110 Less: Average accumulated change in fair value of reinsurance assets 100 58 41 112 43 209 575 839 $ 3,189 $ 4,698 $ 6,020 $ 7,009 $ 8,194 $ 9,134 $ 10,290 $ 12,390 Average adjusted AHL common shareholders' equity Average adjusted AHL common shareholders’ equity by Segment Retirement Services $ 2,262 $ 3,333 $ 4,186 $ 4,823 $ 6,522 $ 7,625 $ 7,491 $ 8,690 2,186 1,672 1,509 2,799 3,700 Corporate and Other 927 1,365 1,834 Average adjusted AHL common shareholders' equity $ 3,189 $ 4,698 $ 6,020 $ 7,009 $ 8,194 $ 9,134 $ 10,290 $ 12,390 APOLLO INVESTOR DAY 2021
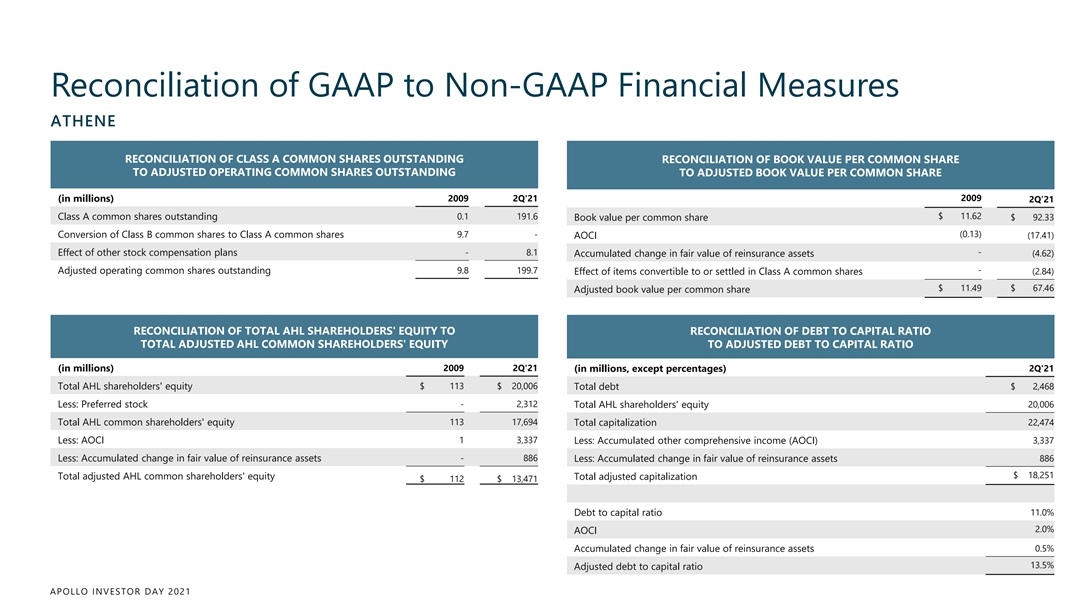
Reconciliation of GAAP to Non-GAAP Financial Measures ATHENE RECONCILIATION OF CLASS A COMMON SHARES OUTSTANDING RECONCILIATION OF BOOK VALUE PER COMMON SHARE TO ADJUSTED OPERATING COMMON SHARES OUTSTANDING TO ADJUSTED BOOK VALUE PER COMMON SHARE 2009 (in millions) 2009 2Q'21 2Q’21 $ 11.62 Class A common shares outstanding 0.1 191.6 Book value per common share $ 92.33 (0.13) Conversion of Class B common shares to Class A common shares 9.7 - AOCI (17.41) - Effect of other stock compensation plans - 8.1 Accumulated change in fair value of reinsurance assets (4.62) - Adjusted operating common shares outstanding 9.8 199.7 Effect of items convertible to or settled in Class A common shares (2.84) $ 11.49 $ 67.46 Adjusted book value per common share RECONCILIATION OF TOTAL AHL SHAREHOLDERS' EQUITY TO RECONCILIATION OF DEBT TO CAPITAL RATIO TOTAL ADJUSTED AHL COMMON SHAREHOLDERS' EQUITY TO ADJUSTED DEBT TO CAPITAL RATIO 2009 2Q'21 (in millions) (in millions, except percentages) 2Q'21 $ 113 $ 20,006 Total AHL shareholders' equity Total debt $ 2,468 - 2,312 Less: Preferred stock Total AHL shareholders' equity 20,006 113 17,694 Total AHL common shareholders' equity Total capitalization 22,474 1 3,337 Less: AOCI Less: Accumulated other comprehensive income (AOCI) 3,337 - 886 Less: Accumulated change in fair value of reinsurance assets Less: Accumulated change in fair value of reinsurance assets 886 $ 18,251 Total adjusted AHL common shareholders' equity Total adjusted capitalization $ 112 $ 13,471 Debt to capital ratio 11.0% 2.0% AOCI Accumulated change in fair value of reinsurance assets 0.5% 13.5% Adjusted debt to capital ratio APOLLO INVESTOR DAY 2021Reconciliation of GAAP to Non-GAAP Financial Measures ATHENE RECONCILIATION OF CLASS A COMMON SHARES OUTSTANDING RECONCILIATION OF BOOK VALUE PER COMMON SHARE TO ADJUSTED OPERATING COMMON SHARES OUTSTANDING TO ADJUSTED BOOK VALUE PER COMMON SHARE 2009 (in millions) 2009 2Q'21 2Q’21 $ 11.62 Class A common shares outstanding 0.1 191.6 Book value per common share $ 92.33 (0.13) Conversion of Class B common shares to Class A common shares 9.7 - AOCI (17.41) - Effect of other stock compensation plans - 8.1 Accumulated change in fair value of reinsurance assets (4.62) - Adjusted operating common shares outstanding 9.8 199.7 Effect of items convertible to or settled in Class A common shares (2.84) $ 11.49 $ 67.46 Adjusted book value per common share RECONCILIATION OF TOTAL AHL SHAREHOLDERS' EQUITY TO RECONCILIATION OF DEBT TO CAPITAL RATIO TOTAL ADJUSTED AHL COMMON SHAREHOLDERS' EQUITY TO ADJUSTED DEBT TO CAPITAL RATIO 2009 2Q'21 (in millions) (in millions, except percentages) 2Q'21 $ 113 $ 20,006 Total AHL shareholders' equity Total debt $ 2,468 - 2,312 Less: Preferred stock Total AHL shareholders' equity 20,006 113 17,694 Total AHL common shareholders' equity Total capitalization 22,474 1 3,337 Less: AOCI Less: Accumulated other comprehensive income (AOCI) 3,337 - 886 Less: Accumulated change in fair value of reinsurance assets Less: Accumulated change in fair value of reinsurance assets 886 $ 18,251 Total adjusted AHL common shareholders' equity Total adjusted capitalization $ 112 $ 13,471 Debt to capital ratio 11.0% 2.0% AOCI Accumulated change in fair value of reinsurance assets 0.5% 13.5% Adjusted debt to capital ratio APOLLO INVESTOR DAY 2021

Reconciliation of GAAP to Non-GAAP Financial Measures ATHENE RECONCILIATION OF NET INVESTMENT INCOME TO NET INVESTMENT EARNINGS Quarterly (in millions) 3Q’18 4Q’18 1Q’19 2Q’19 3Q’19 4Q’19 1Q'20 2Q'20 3Q'20 4Q'20 1Q'21 2Q'21 GAAP net investment income $ 1,085 $ 1,138 $ 1,082 $ 1,182 $ 1,090 $ 1,242 $ 745 $ 1,336 $ 1,209 $ 1,595 $ 1,704 $ 2,038 Change in fair value of reinsurance assets 52 132 132 161 199 188 270 218 444 476 366 388 Alternative income gain (loss) (14) (20) (5) 12 6 (12) (101) 56 23 (80) 69 (18) ACRA noncontrolling interest - - - - - (61) (72) (81) (196) (210) (198) (219) Apollo investment (income) loss - - - - - - 297 (481) 101 (142) 25 (472) Held for trading amortization and other 3 (46) (6) (10) (3) (18) 12 (8) (51) (32) 32 9 41 66 121 163 202 97 406 (296) 321 12 294 (312) Total adjustments to arrive at net investment earnings $ 1,126 $ 1,204 $ 1,203 $ 1,345 $ 1,292 $ 1,339 $ 1,151 $ 1,040 $ 1,530 $ 1,607 $ 1,998 $ 1,726 Total net investment earnings RECONCILIATION OF NET INVESTMENT INCOME RATE TO NET INVESTMENT EARNED RATE Quarterly 3Q’18 4Q’18 1Q’19 2Q’19 3Q’19 4Q’19 1Q'20 2Q'20 3Q'20 4Q'20 1Q'21 2Q'21 GAAP net investment income rate 4.36% 4.16% 3.85% 4.10% 3.67% 4.28% 2.51% 4.22% 3.48% 4.39% 4.49% 5.20% Change in fair value of reinsurance assets 0.20% 0.48% 0.47% 0.56% 0.67% 0.65% 0.90% 0.69% 1.28% 1.31% 0.97% 0.99% Alternative income gain (loss) -0.06% -0.07% -0.02% 0.04% 0.02% -0.04% -0.34% 0.18% 0.07% -0.22% 0.18% -0.05% ACRA noncontrolling interest 0.00% 0.00% 0.00% 0.00% 0.00% -0.21% -0.24% -0.26% -0.56% -0.58% -0.52% -0.56% Apollo investment (income) loss 0.00% 0.00% 0.00% 0.00% 0.00% 0.00% 1.00% -1.52% 0.29% -0.38% 0.07% -1.20% Held for trading amortization and other 0.02% -0.17% -0.02% -0.03% -0.01% -0.06% 0.04% -0.02% -0.15% -0.09% 0.08% 0.02% Total adjustments to arrive at net investment earned rate 0.16% 0.24% 0.43% 0.57% 0.68% 0.34% 1.36% -0.93% 0.93% 0.04% 0.78% -0.80% Consolidated net investment earned rate 4.52% 4.40% 4.28% 4.67% 4.35% 4.62% 3.87% 3.29% 4.41% 4.43% 5.27% 4.40% Consolidated average net invested assets ex. Apollo investment $ 99,603 $ 109,423 $ 112,402 $ 115,221 $ 118,905 $ 115,986 $ 118,919 $ 126,510 $ 138,797 $ 145,251 $ 151,644 $ 156,753 APOLLO INVESTOR DAY 2021
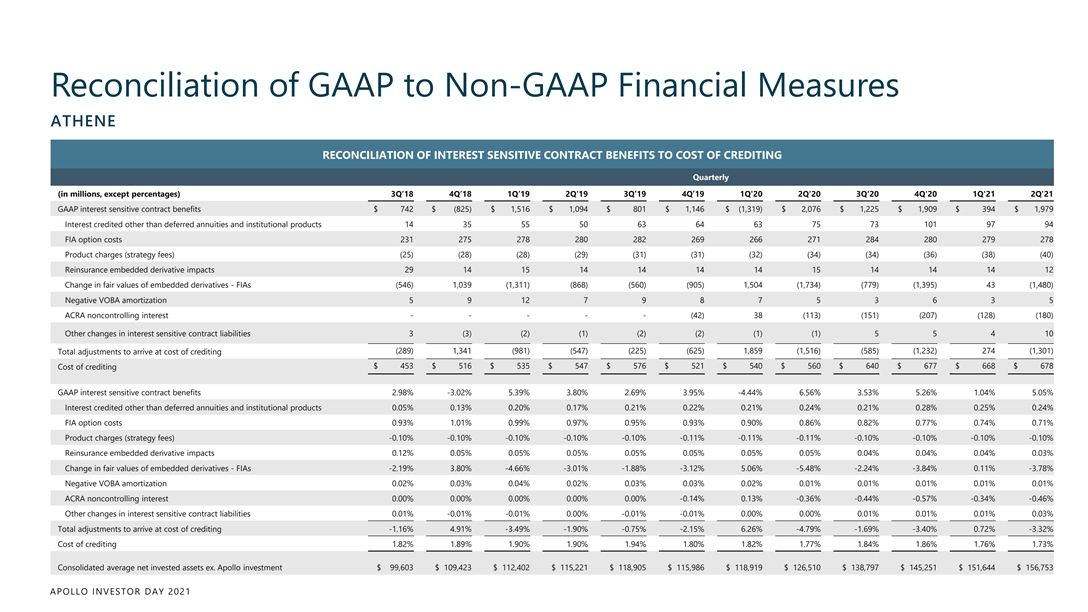
Reconciliation of GAAP to Non-GAAP Financial Measures ATHENE RECONCILIATION OF INTEREST SENSITIVE CONTRACT BENEFITS TO COST OF CREDITING Quarterly (in millions, except percentages) 3Q’18 4Q’18 1Q’19 2Q’19 3Q’19 4Q’19 1Q'20 2Q'20 3Q'20 4Q'20 1Q'21 2Q'21 GAAP interest sensitive contract benefits $ 742 $ (825) $ 1,516 $ 1,094 $ 801 $ 1,146 $ (1,319) $ 2,076 $ 1,225 $ 1,909 $ 394 $ 1,979 Interest credited other than deferred annuities and institutional products 14 35 55 50 63 64 63 75 73 101 97 94 FIA option costs 231 275 278 280 282 269 266 271 284 280 279 278 Product charges (strategy fees) (25) (28) (28) (29) (31) (31) (32) (34) (34) (36) (38) (40) Reinsurance embedded derivative impacts 29 14 15 14 14 14 14 15 14 14 14 12 Change in fair values of embedded derivatives - FIAs (546) 1,039 (1,311) (868) (560) (905) 1,504 (1,734) (779) (1,395) 43 (1,480) Negative VOBA amortization 5 9 12 7 9 8 7 5 3 6 3 5 ACRA noncontrolling interest - - - - - (42) 38 (113) (151) (207) (128) (180) Other changes in interest sensitive contract liabilities 3 (3) (2) (1) (2) (2) (1) (1) 5 5 4 10 (289) 1,341 (981) (547) (225) (625) 1,859 (1,516) (585) (1,232) 274 (1,301) Total adjustments to arrive at cost of crediting $ 453 $ 516 $ 535 $ 547 $ 576 $ 521 $ 540 $ 560 $ 640 $ 677 $ 668 $ 678 Cost of crediting GAAP interest sensitive contract benefits 2.98% -3.02% 5.39% 3.80% 2.69% 3.95% -4.44% 6.56% 3.53% 5.26% 1.04% 5.05% Interest credited other than deferred annuities and institutional products 0.05% 0.13% 0.20% 0.17% 0.21% 0.22% 0.21% 0.24% 0.21% 0.28% 0.25% 0.24% FIA option costs 0.93% 1.01% 0.99% 0.97% 0.95% 0.93% 0.90% 0.86% 0.82% 0.77% 0.74% 0.71% Product charges (strategy fees) -0.10% -0.10% -0.10% -0.10% -0.10% -0.11% -0.11% -0.11% -0.10% -0.10% -0.10% -0.10% Reinsurance embedded derivative impacts 0.12% 0.05% 0.05% 0.05% 0.05% 0.05% 0.05% 0.05% 0.04% 0.04% 0.04% 0.03% Change in fair values of embedded derivatives - FIAs -2.19% 3.80% -4.66% -3.01% -1.88% -3.12% 5.06% -5.48% -2.24% -3.84% 0.11% -3.78% Negative VOBA amortization 0.02% 0.03% 0.04% 0.02% 0.03% 0.03% 0.02% 0.01% 0.01% 0.01% 0.01% 0.01% ACRA noncontrolling interest 0.00% 0.00% 0.00% 0.00% 0.00% -0.14% 0.13% -0.36% -0.44% -0.57% -0.34% -0.46% Other changes in interest sensitive contract liabilities 0.01% -0.01% -0.01% 0.00% -0.01% -0.01% 0.00% 0.00% 0.01% 0.01% 0.01% 0.03% Total adjustments to arrive at cost of crediting -1.16% 4.91% -3.49% -1.90% -0.75% -2.15% 6.26% -4.79% -1.69% -3.40% 0.72% -3.32% Cost of crediting 1.82% 1.89% 1.90% 1.90% 1.94% 1.80% 1.82% 1.77% 1.84% 1.86% 1.76% 1.73% Consolidated average net invested assets ex. Apollo investment $ 99,603 $ 109,423 $ 112,402 $ 115,221 $ 118,905 $ 115,986 $ 118,919 $ 126,510 $ 138,797 $ 145,251 $ 151,644 $ 156,753 APOLLO INVESTOR DAY 2021Reconciliation of GAAP to Non-GAAP Financial Measures ATHENE RECONCILIATION OF INTEREST SENSITIVE CONTRACT BENEFITS TO COST OF CREDITING Quarterly (in millions, except percentages) 3Q’18 4Q’18 1Q’19 2Q’19 3Q’19 4Q’19 1Q'20 2Q'20 3Q'20 4Q'20 1Q'21 2Q'21 GAAP interest sensitive contract benefits $ 742 $ (825) $ 1,516 $ 1,094 $ 801 $ 1,146 $ (1,319) $ 2,076 $ 1,225 $ 1,909 $ 394 $ 1,979 Interest credited other than deferred annuities and institutional products 14 35 55 50 63 64 63 75 73 101 97 94 FIA option costs 231 275 278 280 282 269 266 271 284 280 279 278 Product charges (strategy fees) (25) (28) (28) (29) (31) (31) (32) (34) (34) (36) (38) (40) Reinsurance embedded derivative impacts 29 14 15 14 14 14 14 15 14 14 14 12 Change in fair values of embedded derivatives - FIAs (546) 1,039 (1,311) (868) (560) (905) 1,504 (1,734) (779) (1,395) 43 (1,480) Negative VOBA amortization 5 9 12 7 9 8 7 5 3 6 3 5 ACRA noncontrolling interest - - - - - (42) 38 (113) (151) (207) (128) (180) Other changes in interest sensitive contract liabilities 3 (3) (2) (1) (2) (2) (1) (1) 5 5 4 10 (289) 1,341 (981) (547) (225) (625) 1,859 (1,516) (585) (1,232) 274 (1,301) Total adjustments to arrive at cost of crediting $ 453 $ 516 $ 535 $ 547 $ 576 $ 521 $ 540 $ 560 $ 640 $ 677 $ 668 $ 678 Cost of crediting GAAP interest sensitive contract benefits 2.98% -3.02% 5.39% 3.80% 2.69% 3.95% -4.44% 6.56% 3.53% 5.26% 1.04% 5.05% Interest credited other than deferred annuities and institutional products 0.05% 0.13% 0.20% 0.17% 0.21% 0.22% 0.21% 0.24% 0.21% 0.28% 0.25% 0.24% FIA option costs 0.93% 1.01% 0.99% 0.97% 0.95% 0.93% 0.90% 0.86% 0.82% 0.77% 0.74% 0.71% Product charges (strategy fees) -0.10% -0.10% -0.10% -0.10% -0.10% -0.11% -0.11% -0.11% -0.10% -0.10% -0.10% -0.10% Reinsurance embedded derivative impacts 0.12% 0.05% 0.05% 0.05% 0.05% 0.05% 0.05% 0.05% 0.04% 0.04% 0.04% 0.03% Change in fair values of embedded derivatives - FIAs -2.19% 3.80% -4.66% -3.01% -1.88% -3.12% 5.06% -5.48% -2.24% -3.84% 0.11% -3.78% Negative VOBA amortization 0.02% 0.03% 0.04% 0.02% 0.03% 0.03% 0.02% 0.01% 0.01% 0.01% 0.01% 0.01% ACRA noncontrolling interest 0.00% 0.00% 0.00% 0.00% 0.00% -0.14% 0.13% -0.36% -0.44% -0.57% -0.34% -0.46% Other changes in interest sensitive contract liabilities 0.01% -0.01% -0.01% 0.00% -0.01% -0.01% 0.00% 0.00% 0.01% 0.01% 0.01% 0.03% Total adjustments to arrive at cost of crediting -1.16% 4.91% -3.49% -1.90% -0.75% -2.15% 6.26% -4.79% -1.69% -3.40% 0.72% -3.32% Cost of crediting 1.82% 1.89% 1.90% 1.90% 1.94% 1.80% 1.82% 1.77% 1.84% 1.86% 1.76% 1.73% Consolidated average net invested assets ex. Apollo investment $ 99,603 $ 109,423 $ 112,402 $ 115,221 $ 118,905 $ 115,986 $ 118,919 $ 126,510 $ 138,797 $ 145,251 $ 151,644 $ 156,753 APOLLO INVESTOR DAY 2021
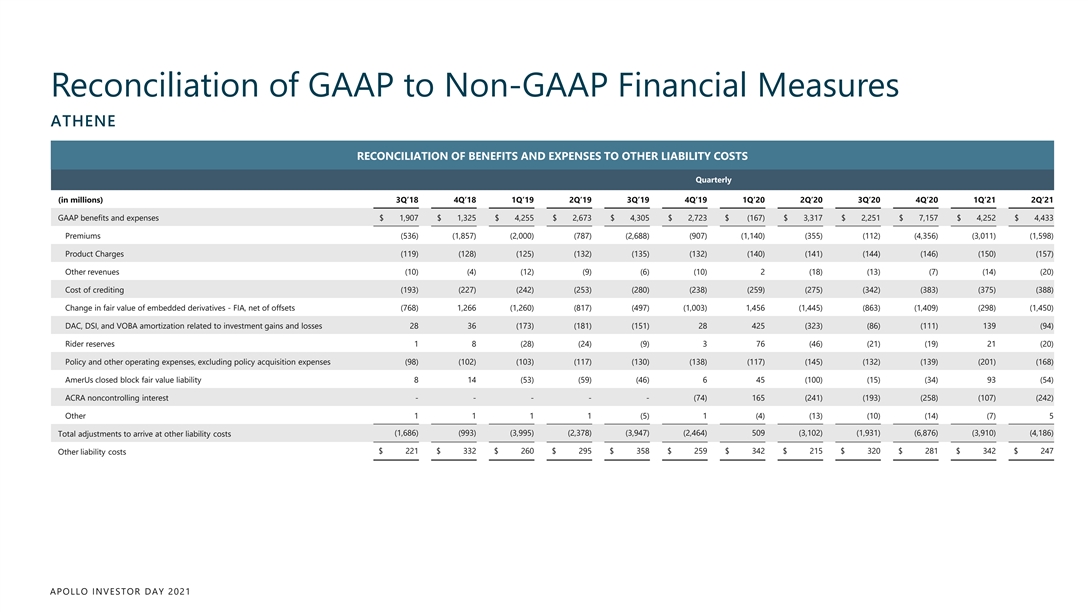
Reconciliation of GAAP to Non-GAAP Financial Measures ATHENE RECONCILIATION OF BENEFITS AND EXPENSES TO OTHER LIABILITY COSTS Quarterly (in millions) 3Q’18 4Q’18 1Q’19 2Q’19 3Q’19 4Q’19 1Q’20 2Q’20 3Q’20 4Q’20 1Q’21 2Q’21 GAAP benefits and expenses $ 1,907 $ 1,325 $ 4,255 $ 2,673 $ 4,305 $ 2,723 $ (167) $ 3,317 $ 2,251 $ 7,157 $ 4,252 $ 4,433 Premiums (536) (1,857) (2,000) (787) (2,688) (907) (1,140) (355) (112) (4,356) (3,011) (1,598) Product Charges (119) (128) (125) (132) (135) (132) (140) (141) (144) (146) (150) (157) Other revenues (10) (4) (12) (9) (6) (10) 2 (18) (13) (7) (14) (20) Cost of crediting (193) (227) (242) (253) (280) (238) (259) (275) (342) (383) (375) (388) Change in fair value of embedded derivatives - FIA, net of offsets (768) 1,266 (1,260) (817) (497) (1,003) 1,456 (1,445) (863) (1,409) (298) (1,450) DAC, DSI, and VOBA amortization related to investment gains and losses 28 36 (173) (181) (151) 28 425 (323) (86) (111) 139 (94) Rider reserves 1 8 (28) (24) (9) 3 76 (46) (21) (19) 21 (20) Policy and other operating expenses, excluding policy acquisition expenses (98) (102) (103) (117) (130) (138) (117) (145) (132) (139) (201) (168) AmerUs closed block fair value liability 8 14 (53) (59) (46) 6 45 (100) (15) (34) 93 (54) ACRA noncontrolling interest - - - - - (74) 165 (241) (193) (258) (107) (242) Other 1 1 1 1 (5) 1 (4) (13) (10) (14) (7) 5 (1,686) (993) (3,995) (2,378) (3,947) (2,464) 509 (3,102) (1,931) (6,876) (3,910) (4,186) Total adjustments to arrive at other liability costs $ 221 $ 332 $ 260 $ 295 $ 358 $ 259 $ 342 $ 215 $ 320 $ 281 $ 342 $ 247 Other liability costs APOLLO INVESTOR DAY 2021Reconciliation of GAAP to Non-GAAP Financial Measures ATHENE RECONCILIATION OF BENEFITS AND EXPENSES TO OTHER LIABILITY COSTS Quarterly (in millions) 3Q’18 4Q’18 1Q’19 2Q’19 3Q’19 4Q’19 1Q’20 2Q’20 3Q’20 4Q’20 1Q’21 2Q’21 GAAP benefits and expenses $ 1,907 $ 1,325 $ 4,255 $ 2,673 $ 4,305 $ 2,723 $ (167) $ 3,317 $ 2,251 $ 7,157 $ 4,252 $ 4,433 Premiums (536) (1,857) (2,000) (787) (2,688) (907) (1,140) (355) (112) (4,356) (3,011) (1,598) Product Charges (119) (128) (125) (132) (135) (132) (140) (141) (144) (146) (150) (157) Other revenues (10) (4) (12) (9) (6) (10) 2 (18) (13) (7) (14) (20) Cost of crediting (193) (227) (242) (253) (280) (238) (259) (275) (342) (383) (375) (388) Change in fair value of embedded derivatives - FIA, net of offsets (768) 1,266 (1,260) (817) (497) (1,003) 1,456 (1,445) (863) (1,409) (298) (1,450) DAC, DSI, and VOBA amortization related to investment gains and losses 28 36 (173) (181) (151) 28 425 (323) (86) (111) 139 (94) Rider reserves 1 8 (28) (24) (9) 3 76 (46) (21) (19) 21 (20) Policy and other operating expenses, excluding policy acquisition expenses (98) (102) (103) (117) (130) (138) (117) (145) (132) (139) (201) (168) AmerUs closed block fair value liability 8 14 (53) (59) (46) 6 45 (100) (15) (34) 93 (54) ACRA noncontrolling interest - - - - - (74) 165 (241) (193) (258) (107) (242) Other 1 1 1 1 (5) 1 (4) (13) (10) (14) (7) 5 (1,686) (993) (3,995) (2,378) (3,947) (2,464) 509 (3,102) (1,931) (6,876) (3,910) (4,186) Total adjustments to arrive at other liability costs $ 221 $ 332 $ 260 $ 295 $ 358 $ 259 $ 342 $ 215 $ 320 $ 281 $ 342 $ 247 Other liability costs APOLLO INVESTOR DAY 2021
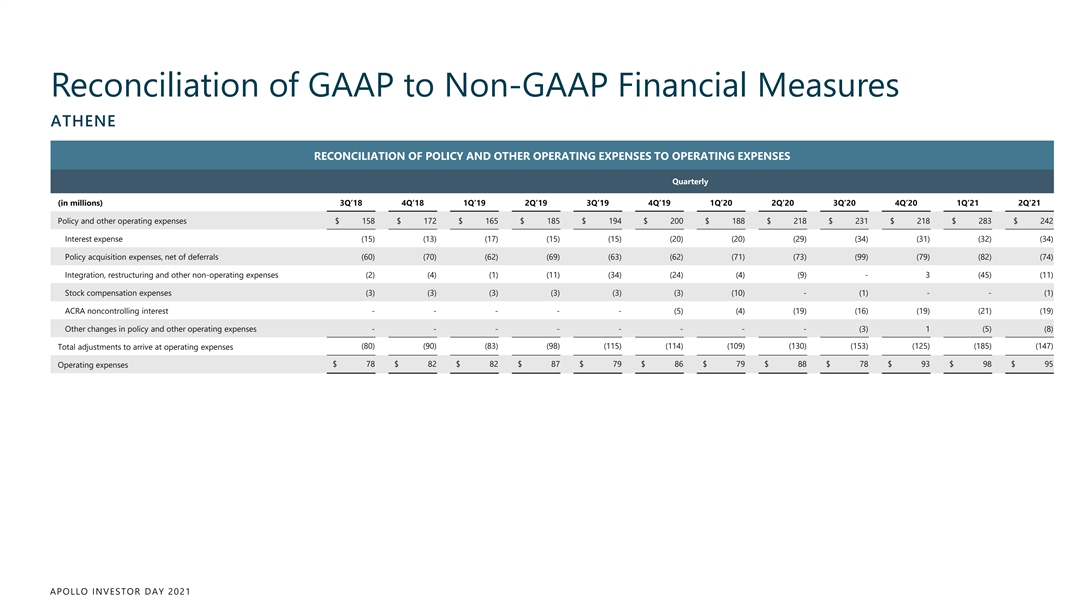
Reconciliation of GAAP to Non-GAAP Financial Measures ATHENE RECONCILIATION OF POLICY AND OTHER OPERATING EXPENSES TO OPERATING EXPENSES Quarterly (in millions) 3Q’18 4Q’18 1Q’19 2Q’19 3Q’19 4Q’19 1Q’20 2Q’20 3Q’20 4Q’20 1Q’21 2Q’21 Policy and other operating expenses $ 158 $ 172 $ 165 $ 185 $ 194 $ 200 $ 188 $ 218 $ 231 $ 218 $ 283 $ 242 Interest expense (15) (13) (17) (15) (15) (20) (20) (29) (34) (31) (32) (34) Policy acquisition expenses, net of deferrals (60) (70) (62) (69) (63) (62) (71) (73) (99) (79) (82) (74) Integration, restructuring and other non-operating expenses (2) (4) (1) (11) (34) (24) (4) (9) - 3 (45) (11) Stock compensation expenses (3) (3) (3) (3) (3) (3) (10) - (1) - - (1) ACRA noncontrolling interest - - - - - (5) (4) (19) (16) (19) (21) (19) Other changes in policy and other operating expenses - - - - - - - - (3) 1 (5) (8) (80) (90) (83) (98) (115) (114) (109) (130) (153) (125) (185) (147) Total adjustments to arrive at operating expenses $ 78 $ 82 $ 82 $ 87 $ 79 $ 86 $ 79 $ 88 $ 78 $ 93 $ 98 $ 95 Operating expenses APOLLO INVESTOR DAY 2021Reconciliation of GAAP to Non-GAAP Financial Measures ATHENE RECONCILIATION OF POLICY AND OTHER OPERATING EXPENSES TO OPERATING EXPENSES Quarterly (in millions) 3Q’18 4Q’18 1Q’19 2Q’19 3Q’19 4Q’19 1Q’20 2Q’20 3Q’20 4Q’20 1Q’21 2Q’21 Policy and other operating expenses $ 158 $ 172 $ 165 $ 185 $ 194 $ 200 $ 188 $ 218 $ 231 $ 218 $ 283 $ 242 Interest expense (15) (13) (17) (15) (15) (20) (20) (29) (34) (31) (32) (34) Policy acquisition expenses, net of deferrals (60) (70) (62) (69) (63) (62) (71) (73) (99) (79) (82) (74) Integration, restructuring and other non-operating expenses (2) (4) (1) (11) (34) (24) (4) (9) - 3 (45) (11) Stock compensation expenses (3) (3) (3) (3) (3) (3) (10) - (1) - - (1) ACRA noncontrolling interest - - - - - (5) (4) (19) (16) (19) (21) (19) Other changes in policy and other operating expenses - - - - - - - - (3) 1 (5) (8) (80) (90) (83) (98) (115) (114) (109) (130) (153) (125) (185) (147) Total adjustments to arrive at operating expenses $ 78 $ 82 $ 82 $ 87 $ 79 $ 86 $ 79 $ 88 $ 78 $ 93 $ 98 $ 95 Operating expenses APOLLO INVESTOR DAY 2021
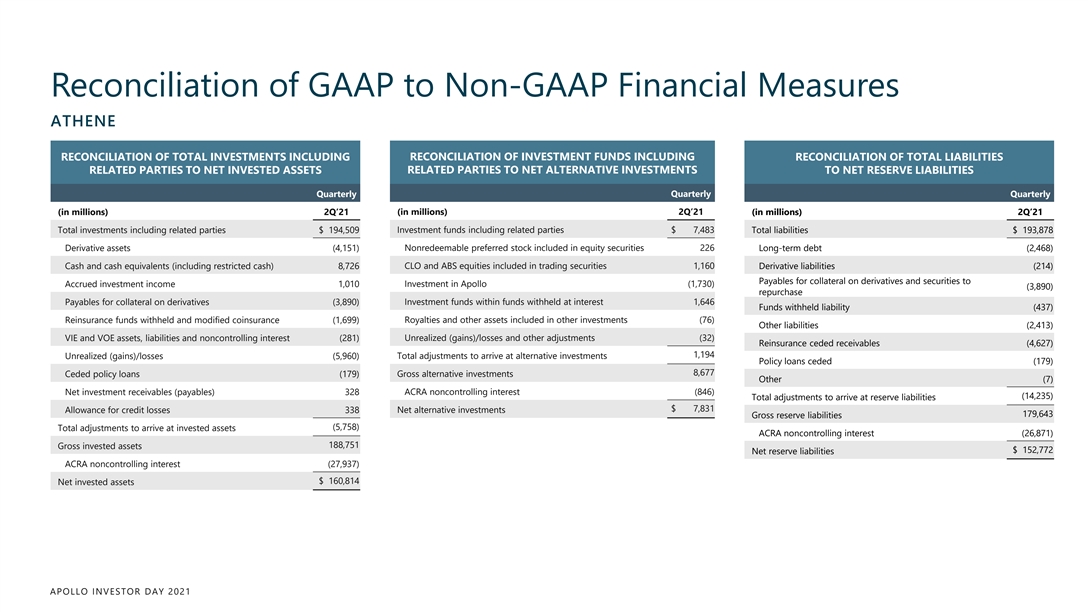
Reconciliation of GAAP to Non-GAAP Financial Measures ATHENE RECONCILIATION OF INVESTMENT FUNDS INCLUDING RECONCILIATION OF TOTAL INVESTMENTS INCLUDING RECONCILIATION OF TOTAL LIABILITIES RELATED PARTIES TO NET INVESTED ASSETS RELATED PARTIES TO NET ALTERNATIVE INVESTMENTS TO NET RESERVE LIABILITIES Quarterly Quarterly Quarterly (in millions) 2Q’21 (in millions) 2Q’21 (in millions) 2Q’21 Total investments including related parties $ 194,509 Investment funds including related parties $ 7,483 Total liabilities $ 193,878 Derivative assets (4,151) Nonredeemable preferred stock included in equity securities 226 Long-term debt (2,468) Cash and cash equivalents (including restricted cash) 8,726 CLO and ABS equities included in trading securities 1,160 Derivative liabilities (214) Payables for collateral on derivatives and securities to Accrued investment income 1,010 Investment in Apollo (1,730) (3,890) repurchase Payables for collateral on derivatives (3,890) Investment funds within funds withheld at interest 1,646 Funds withheld liability (437) Reinsurance funds withheld and modified coinsurance (1,699) Royalties and other assets included in other investments (76) Other liabilities (2,413) VIE and VOE assets, liabilities and noncontrolling interest (281) Unrealized (gains)/losses and other adjustments (32) Reinsurance ceded receivables (4,627) 1,194 Unrealized (gains)/losses (5,960) Total adjustments to arrive at alternative investments Policy loans ceded (179) 8,677 Ceded policy loans (179) Gross alternative investments Other (7) Net investment receivables (payables) 328 ACRA noncontrolling interest (846) (14,235) Total adjustments to arrive at reserve liabilities $ 7,831 Allowance for credit losses 338 Net alternative investments 179,643 Gross reserve liabilities (5,758) Total adjustments to arrive at invested assets ACRA noncontrolling interest (26,871) 188,751 Gross invested assets $ 152,772 Net reserve liabilities ACRA noncontrolling interest (27,937) $ 160,814 Net invested assets APOLLO INVESTOR DAY 2021Reconciliation of GAAP to Non-GAAP Financial Measures ATHENE RECONCILIATION OF INVESTMENT FUNDS INCLUDING RECONCILIATION OF TOTAL INVESTMENTS INCLUDING RECONCILIATION OF TOTAL LIABILITIES RELATED PARTIES TO NET INVESTED ASSETS RELATED PARTIES TO NET ALTERNATIVE INVESTMENTS TO NET RESERVE LIABILITIES Quarterly Quarterly Quarterly (in millions) 2Q’21 (in millions) 2Q’21 (in millions) 2Q’21 Total investments including related parties $ 194,509 Investment funds including related parties $ 7,483 Total liabilities $ 193,878 Derivative assets (4,151) Nonredeemable preferred stock included in equity securities 226 Long-term debt (2,468) Cash and cash equivalents (including restricted cash) 8,726 CLO and ABS equities included in trading securities 1,160 Derivative liabilities (214) Payables for collateral on derivatives and securities to Accrued investment income 1,010 Investment in Apollo (1,730) (3,890) repurchase Payables for collateral on derivatives (3,890) Investment funds within funds withheld at interest 1,646 Funds withheld liability (437) Reinsurance funds withheld and modified coinsurance (1,699) Royalties and other assets included in other investments (76) Other liabilities (2,413) VIE and VOE assets, liabilities and noncontrolling interest (281) Unrealized (gains)/losses and other adjustments (32) Reinsurance ceded receivables (4,627) 1,194 Unrealized (gains)/losses (5,960) Total adjustments to arrive at alternative investments Policy loans ceded (179) 8,677 Ceded policy loans (179) Gross alternative investments Other (7) Net investment receivables (payables) 328 ACRA noncontrolling interest (846) (14,235) Total adjustments to arrive at reserve liabilities $ 7,831 Allowance for credit losses 338 Net alternative investments 179,643 Gross reserve liabilities (5,758) Total adjustments to arrive at invested assets ACRA noncontrolling interest (26,871) 188,751 Gross invested assets $ 152,772 Net reserve liabilities ACRA noncontrolling interest (27,937) $ 160,814 Net invested assets APOLLO INVESTOR DAY 2021

Important Information & Definitions APOLLO INVESTOR DAY 2021Important Information & Definitions APOLLO INVESTOR DAY 2021
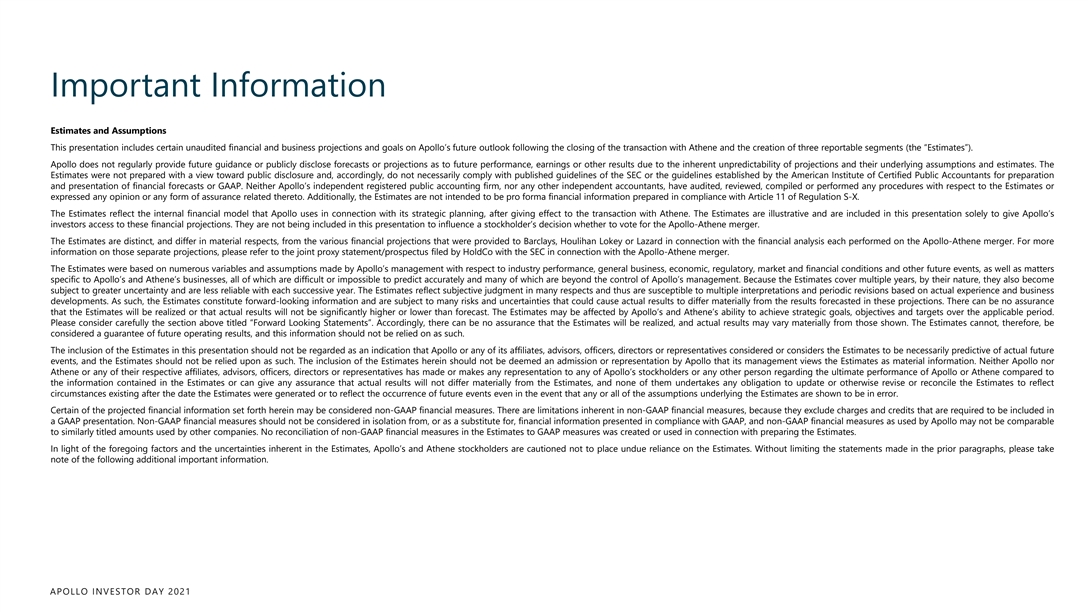
Important Information Estimates and Assumptions This presentation includes certain unaudited financial and business projections and goals on Apollo’s future outlook following the closing of the transaction with Athene and the creation of three reportable segments (the “Estimates”). Apollo does not regularly provide future guidance or publicly disclose forecasts or projections as to future performance, earnings or other results due to the inherent unpredictability of projections and their underlying assumptions and estimates. The Estimates were not prepared with a view toward public disclosure and, accordingly, do not necessarily comply with published guidelines of the SEC or the guidelines established by the American Institute of Certified Public Accountants for preparation and presentation of financial forecasts or GAAP. Neither Apollo’s independent registered public accounting firm, nor any other independent accountants, have audited, reviewed, compiled or performed any procedures with respect to the Estimates or expressed any opinion or any form of assurance related thereto. Additionally, the Estimates are not intended to be pro forma financial information prepared in compliance with Article 11 of Regulation S-X. The Estimates reflect the internal financial model that Apollo uses in connection with its strategic planning, after giving effect to the transaction with Athene. The Estimates are illustrative and are included in this presentation solely to give Apollo’s investors access to these financial projections. They are not being included in this presentation to influence a stockholder’s decision whether to vote for the Apollo-Athene merger. The Estimates are distinct, and differ in material respects, from the various financial projections that were provided to Barclays, Houlihan Lokey or Lazard in connection with the financial analysis each performed on the Apollo-Athene merger. For more information on those separate projections, please refer to the joint proxy statement/prospectus filed by HoldCo with the SEC in connection with the Apollo-Athene merger. The Estimates were based on numerous variables and assumptions made by Apollo’s management with respect to industry performance, general business, economic, regulatory, market and financial conditions and other future events, as well as matters specific to Apollo’s and Athene’s businesses, all of which are difficult or impossible to predict accurately and many of which are beyond the control of Apollo’s management. Because the Estimates cover multiple years, by their nature, they also become subject to greater uncertainty and are less reliable with each successive year. The Estimates reflect subjective judgment in many respects and thus are susceptible to multiple interpretations and periodic revisions based on actual experience and business developments. As such, the Estimates constitute forward-looking information and are subject to many risks and uncertainties that could cause actual results to differ materially from the results forecasted in these projections. There can be no assurance that the Estimates will be realized or that actual results will not be significantly higher or lower than forecast. The Estimates may be affected by Apollo’s and Athene’s ability to achieve strategic goals, objectives and targets over the applicable period. Please consider carefully the section above titled “Forward Looking Statements”. Accordingly, there can be no assurance that the Estimates will be realized, and actual results may vary materially from those shown. The Estimates cannot, therefore, be considered a guarantee of future operating results, and this information should not be relied on as such. The inclusion of the Estimates in this presentation should not be regarded as an indication that Apollo or any of its affiliates, advisors, officers, directors or representatives considered or considers the Estimates to be necessarily predictive of actual future events, and the Estimates should not be relied upon as such. The inclusion of the Estimates herein should not be deemed an admission or representation by Apollo that its management views the Estimates as material information. Neither Apollo nor Athene or any of their respective affiliates, advisors, officers, directors or representatives has made or makes any representation to any of Apollo’s stockholders or any other person regarding the ultimate performance of Apollo or Athene compared to the information contained in the Estimates or can give any assurance that actual results will not differ materially from the Estimates, and none of them undertakes any obligation to update or otherwise revise or reconcile the Estimates to reflect circumstances existing after the date the Estimates were generated or to reflect the occurrence of future events even in the event that any or all of the assumptions underlying the Estimates are shown to be in error. Certain of the projected financial information set forth herein may be considered non-GAAP financial measures. There are limitations inherent in non-GAAP financial measures, because they exclude charges and credits that are required to be included in a GAAP presentation. Non-GAAP financial measures should not be considered in isolation from, or as a substitute for, financial information presented in compliance with GAAP, and non-GAAP financial measures as used by Apollo may not be comparable to similarly titled amounts used by other companies. No reconciliation of non-GAAP financial measures in the Estimates to GAAP measures was created or used in connection with preparing the Estimates. In light of the foregoing factors and the uncertainties inherent in the Estimates, Apollo’s and Athene stockholders are cautioned not to place undue reliance on the Estimates. Without limiting the statements made in the prior paragraphs, please take note of the following additional important information. APOLLO INVESTOR DAY 2021Important Information Estimates and Assumptions This presentation includes certain unaudited financial and business projections and goals on Apollo’s future outlook following the closing of the transaction with Athene and the creation of three reportable segments (the “Estimates”). Apollo does not regularly provide future guidance or publicly disclose forecasts or projections as to future performance, earnings or other results due to the inherent unpredictability of projections and their underlying assumptions and estimates. The Estimates were not prepared with a view toward public disclosure and, accordingly, do not necessarily comply with published guidelines of the SEC or the guidelines established by the American Institute of Certified Public Accountants for preparation and presentation of financial forecasts or GAAP. Neither Apollo’s independent registered public accounting firm, nor any other independent accountants, have audited, reviewed, compiled or performed any procedures with respect to the Estimates or expressed any opinion or any form of assurance related thereto. Additionally, the Estimates are not intended to be pro forma financial information prepared in compliance with Article 11 of Regulation S-X. The Estimates reflect the internal financial model that Apollo uses in connection with its strategic planning, after giving effect to the transaction with Athene. The Estimates are illustrative and are included in this presentation solely to give Apollo’s investors access to these financial projections. They are not being included in this presentation to influence a stockholder’s decision whether to vote for the Apollo-Athene merger. The Estimates are distinct, and differ in material respects, from the various financial projections that were provided to Barclays, Houlihan Lokey or Lazard in connection with the financial analysis each performed on the Apollo-Athene merger. For more information on those separate projections, please refer to the joint proxy statement/prospectus filed by HoldCo with the SEC in connection with the Apollo-Athene merger. The Estimates were based on numerous variables and assumptions made by Apollo’s management with respect to industry performance, general business, economic, regulatory, market and financial conditions and other future events, as well as matters specific to Apollo’s and Athene’s businesses, all of which are difficult or impossible to predict accurately and many of which are beyond the control of Apollo’s management. Because the Estimates cover multiple years, by their nature, they also become subject to greater uncertainty and are less reliable with each successive year. The Estimates reflect subjective judgment in many respects and thus are susceptible to multiple interpretations and periodic revisions based on actual experience and business developments. As such, the Estimates constitute forward-looking information and are subject to many risks and uncertainties that could cause actual results to differ materially from the results forecasted in these projections. There can be no assurance that the Estimates will be realized or that actual results will not be significantly higher or lower than forecast. The Estimates may be affected by Apollo’s and Athene’s ability to achieve strategic goals, objectives and targets over the applicable period. Please consider carefully the section above titled “Forward Looking Statements”. Accordingly, there can be no assurance that the Estimates will be realized, and actual results may vary materially from those shown. The Estimates cannot, therefore, be considered a guarantee of future operating results, and this information should not be relied on as such. The inclusion of the Estimates in this presentation should not be regarded as an indication that Apollo or any of its affiliates, advisors, officers, directors or representatives considered or considers the Estimates to be necessarily predictive of actual future events, and the Estimates should not be relied upon as such. The inclusion of the Estimates herein should not be deemed an admission or representation by Apollo that its management views the Estimates as material information. Neither Apollo nor Athene or any of their respective affiliates, advisors, officers, directors or representatives has made or makes any representation to any of Apollo’s stockholders or any other person regarding the ultimate performance of Apollo or Athene compared to the information contained in the Estimates or can give any assurance that actual results will not differ materially from the Estimates, and none of them undertakes any obligation to update or otherwise revise or reconcile the Estimates to reflect circumstances existing after the date the Estimates were generated or to reflect the occurrence of future events even in the event that any or all of the assumptions underlying the Estimates are shown to be in error. Certain of the projected financial information set forth herein may be considered non-GAAP financial measures. There are limitations inherent in non-GAAP financial measures, because they exclude charges and credits that are required to be included in a GAAP presentation. Non-GAAP financial measures should not be considered in isolation from, or as a substitute for, financial information presented in compliance with GAAP, and non-GAAP financial measures as used by Apollo may not be comparable to similarly titled amounts used by other companies. No reconciliation of non-GAAP financial measures in the Estimates to GAAP measures was created or used in connection with preparing the Estimates. In light of the foregoing factors and the uncertainties inherent in the Estimates, Apollo’s and Athene stockholders are cautioned not to place undue reliance on the Estimates. Without limiting the statements made in the prior paragraphs, please take note of the following additional important information. APOLLO INVESTOR DAY 2021
Important Information Assets Under Management (“AUM”) The estimates and expectations about new fund capital that Apollo can raise in various strategies and formats (including permanent capital) and Apollo’s AUM in the future depend on many assumptions about future events and circumstances, including but not limited to the fundraising environment generally, investor interest in the investment strategies presented, and the expected pace and the time periods within which fundraising will be completed. There are many factors that could delay, impede or prohibit the future fundraising that AGM currently expects, including not limited to market disruption, loss of key personnel, lack of investor interest, negotiations with investors, and other events or circumstances that we may or may not be able to predict, manage or control (including but not limited to the matters discussed under the section “Forward Looking Statements” above). Fee Related Earnings (“FRE”), Spread Related Earnings (“SRE”) and Principal Investing Income (“PII”) The estimates and expectations about Apollo’s fees, FRE, SRE and PII in the future depend on many assumptions about future events and circumstances, including but not limited to (i) the assumptions about future fundraising and AUM, (ii) the actual terms and conditions of the Apollo Funds to be raised in the future, including management fee rates paid, (iii) the investment and transaction activity of Apollo entities, (iv) the ability to generate liability growth, realize target returns and target net spreads on Athene’s investment portfolio, (v) the variability and level of our operating expenses, and (vi) the timing and amounts generated by the monetization of investments held by Apollo entities. The value of unrealized investment gains and unrealized carried interest may be volatile and subject to material change, and the actual realized value of currently unrealized investments will depend on, among other factors, the value of the investments and market conditions at the time of disposition, legal and contractual restrictions, transaction costs, and the timing and manner of sale, all of which may differ from the assumptions used for this presentation. Accordingly, the actual realized values of unrealized investments and carried interest may differ materially from the values assumed by Apollo for purposes of this presentation. The actual realized returns and net spreads on Athene’s investments can be highly dependent on future interest rates. There are many factors that could delay, impede or prohibit Apollo’s ability to generate the future fees, FRE, SRE and PII that Apollo currently expects, including but not limited to market disruption, loss of key personnel, lack of investor or third party interest, negotiations by investors or other third parties, unexpected expenses, and other events or circumstances that we may or may not be able to predict, manage or control (including but not limited to the matters discussed in the section “Forward Looking Statements” above). Distributable Earnings (“DE”) The estimates and expectations about Apollo’s DE in the future depend on many assumptions about future events and circumstances, including but not limited to (i) the assumptions about future AUM, fees, FRE, SRE and PII, and (ii) possible future clawbacks, and netting holes. There are many factors that could delay, impede or prohibit Apollo’s ability to generate the DE that Apollo currently expects, including but not limited to market disruption, loss of key personnel, lack of investor or third party interest, negotiations by investors or other third parties, unexpected expenses including higher income taxes resulting from changes in tax legislation, and other events or circumstances that we may or may not be able to predict, manage or control (including but not limited to the matters discussed in the section “Forward Looking Statements” above). Business Growth All statements relating to the potential for future business growth are inherently uncertain and are based on current market conditions, which can change at any time, and various assumptions about the ability to capitalize on growth opportunities and future business performance. No inference should be made that Apollo (including Athene) can or will grow any of its businesses materially or sufficiently to meet or approach the size of any market or sector leader disclosed in this presentation. See the section “Forward Looking Statements” above. APOLLO DOES NOT INTEND TO UPDATE OR OTHERWISE REVISE THE ABOVE ESTIMATES TO REFLECT CIRCUMSTANCES EXISTING AFTER THE DATE WHEN MADE OR TO REFLECT THE OCCURRENCE OF FUTURE EVENTS, EVEN IN THE EVENT THAT ANY OR ALL OF THE ASSUMPTIONS UNDERLYING SUCH ESTIMATES ARE NO LONGER APPROPRIATE OR ARE SHOWN TO BE IN ERROR, EXCEPT AS MAY BE REQUIRED BY APPLICABLE LAW. APOLLO INVESTOR DAY 2021
Important Information Performance Information Past performance is not necessarily indicative of future results and there can be no assurance that Apollo, Athene or any Apollo Fund or strategy will achieve comparable results, or that any investments made by Apollo in the future will be profitable. Actual realized value of currently unrealized investments will depend on, among other factors, future operating results, the value of the assets and market conditions at the time of disposition, any related transaction costs and the timing and manner of sale, all of which may differ from the assumptions and circumstances on which the current unrealized valuations are based. Accordingly, the actual realized values of unrealized investments may differ materially from the values indicated herein. Information contained herein may include information with respect to prior investment performance of one or more Apollo and Athene funds or investments, including gross and/or net internal rates of return (“IRR”) and gross and/or net multiple of investment cost (“MOIC”). Information with respect to prior performance, while a useful tool in evaluating investment activities, is not necessarily indicative of actual results that may be achieved for unrealized investments. The realization of such performance is dependent upon many factors, many of which are beyond the control of Apollo. Aggregated return information is not reflective of an investable product, and as such does not reflect the returns of any Apollo Fund. Certain Apollo Funds referenced herein may utilize a credit facility (sometimes referred to as a “subscription line”) to make investments and pay expenses and for other purposes to the extent permitted by each Apollo Fund’s partnership agreement. Such fund-level borrowing to fund investments impacts net IRR calculations because net IRR is calculated based on investor cash outlays to, and returns from, the Apollo Fund and as such, returns depend on the amount and timing of investor capital contributions. When the Apollo Fund uses borrowed funds in advance or in lieu of calling capital, investors make correspondingly later or smaller capital contributions. Accordingly, this fund-level borrowing could result in higher net IRR (even after taking into account the associated interest expense of the borrowing) or lower net IRR, than if capital had been called to fund the investments or capital had been contributed at the inception of the investment. In addition, the Apollo Fund may pay all related expenses, including interest, on its subscription line facility and investors will bear such costs. Please refer to the Definitions pages for additional information regarding gross and net IRR. Unless otherwise indicated, MOIC is derived from dividing the sum of the estimated remaining value and realized proceeds by the amount invested. Unless otherwise noted, MOIC is presented gross and does not reflect the effect of management fees, incentive compensation, certain expenses or taxes. Please refer to the Definitions pages for additional information regarding MOIC. Track Record Track record provided herein is for illustrative purposes only. The investments in the track records were selected on the basis that they fall within the scope of the investment mandate of an Apollo Fund and/or investment strategy and are intended solely as examples illustrative of the potential investment strategy of the Fund or of the types of investments that may be entered into by the Fund. None of the examples included in the track records is necessarily indicative of all of Apollo’s investment strategies or prior investment performance. While Apollo believes that the performance information herein includes applicable historical investments, there can be no assurance as to the validity, thoroughness or accuracy of Apollo’s determination methodology. Moreover, while certain members of the applicable investment committee were involved in the consummation of certain of the historical representative transactions described in the track records, the sourcing of these investments and the decisions to consummate these investments were not all necessarily made by the same group of professionals, some of which may no longer be employed by Apollo, nor were such investments approved by the same investment committee. Past performance is not indicative nor a guarantee of future results. There can be no assurance that any Apollo Fund will be able to implement its investment strategy or investment approach to achieve comparable results or that it will be successful. Moreover, there can be no assurance that any similar investment opportunities will be available or pursued by the Apollo Fund in the future. Non-GAAP Financial Measures This presentation contains information regarding Apollo’s financial results that is calculated and presented on the basis of methodologies other than in accordance with accounting principles generally accepted in the United States (“non-GAAP measures”). The non-GAAP measures presented herein include Distributable Earnings, or “DE”, Fee Related Earnings, or “FRE”, Spread Related Earnings, or “SRE”, and Principal Investing Income, or “PII”, among others. Refer to the Definitions pages for the definitions of the non-GAAP measures presented herein, as well as Reconciliations of GAAP to Non-GAAP Measures pages for reconciliations of the most comparable GAAP measures to the non-GAAP measures. Target Returns Target returns including Target IRR are presented solely for providing insight into an investment’s objectives and detailing anticipated risk and reward characteristics in order to facilitate comparisons with other investments and for establishing a benchmark for future evaluation of the investment’s performance. Target returns are not predictions, projections or guarantees of future performance. Target returns are based upon estimates and assumptions that a potential investment will yield a return equal to or greater than the target. There can be no assurance that Apollo will be successful in finding investment opportunities that meet these anticipated return parameters. Apollo’s target of potential returns from an investment is not a guarantee as to the quality of the investment or a representation as to the adequacy of Apollo’s methodology for estimating returns. Target returns should not be used as a primary basis for an investor’s decision to make an investment. Unless otherwise indicated, target returns are presented gross and do not reflect the effect of applicable fees, incentive compensation, certain expenses and taxes. APOLLO INVESTOR DAY 2021Important Information Performance Information Past performance is not necessarily indicative of future results and there can be no assurance that Apollo, Athene or any Apollo Fund or strategy will achieve comparable results, or that any investments made by Apollo in the future will be profitable. Actual realized value of currently unrealized investments will depend on, among other factors, future operating results, the value of the assets and market conditions at the time of disposition, any related transaction costs and the timing and manner of sale, all of which may differ from the assumptions and circumstances on which the current unrealized valuations are based. Accordingly, the actual realized values of unrealized investments may differ materially from the values indicated herein. Information contained herein may include information with respect to prior investment performance of one or more Apollo and Athene funds or investments, including gross and/or net internal rates of return (“IRR”) and gross and/or net multiple of investment cost (“MOIC”). Information with respect to prior performance, while a useful tool in evaluating investment activities, is not necessarily indicative of actual results that may be achieved for unrealized investments. The realization of such performance is dependent upon many factors, many of which are beyond the control of Apollo. Aggregated return information is not reflective of an investable product, and as such does not reflect the returns of any Apollo Fund. Certain Apollo Funds referenced herein may utilize a credit facility (sometimes referred to as a “subscription line”) to make investments and pay expenses and for other purposes to the extent permitted by each Apollo Fund’s partnership agreement. Such fund-level borrowing to fund investments impacts net IRR calculations because net IRR is calculated based on investor cash outlays to, and returns from, the Apollo Fund and as such, returns depend on the amount and timing of investor capital contributions. When the Apollo Fund uses borrowed funds in advance or in lieu of calling capital, investors make correspondingly later or smaller capital contributions. Accordingly, this fund-level borrowing could result in higher net IRR (even after taking into account the associated interest expense of the borrowing) or lower net IRR, than if capital had been called to fund the investments or capital had been contributed at the inception of the investment. In addition, the Apollo Fund may pay all related expenses, including interest, on its subscription line facility and investors will bear such costs. Please refer to the Definitions pages for additional information regarding gross and net IRR. Unless otherwise indicated, MOIC is derived from dividing the sum of the estimated remaining value and realized proceeds by the amount invested. Unless otherwise noted, MOIC is presented gross and does not reflect the effect of management fees, incentive compensation, certain expenses or taxes. Please refer to the Definitions pages for additional information regarding MOIC. Track Record Track record provided herein is for illustrative purposes only. The investments in the track records were selected on the basis that they fall within the scope of the investment mandate of an Apollo Fund and/or investment strategy and are intended solely as examples illustrative of the potential investment strategy of the Fund or of the types of investments that may be entered into by the Fund. None of the examples included in the track records is necessarily indicative of all of Apollo’s investment strategies or prior investment performance. While Apollo believes that the performance information herein includes applicable historical investments, there can be no assurance as to the validity, thoroughness or accuracy of Apollo’s determination methodology. Moreover, while certain members of the applicable investment committee were involved in the consummation of certain of the historical representative transactions described in the track records, the sourcing of these investments and the decisions to consummate these investments were not all necessarily made by the same group of professionals, some of which may no longer be employed by Apollo, nor were such investments approved by the same investment committee. Past performance is not indicative nor a guarantee of future results. There can be no assurance that any Apollo Fund will be able to implement its investment strategy or investment approach to achieve comparable results or that it will be successful. Moreover, there can be no assurance that any similar investment opportunities will be available or pursued by the Apollo Fund in the future. Non-GAAP Financial Measures This presentation contains information regarding Apollo’s financial results that is calculated and presented on the basis of methodologies other than in accordance with accounting principles generally accepted in the United States (“non-GAAP measures”). The non-GAAP measures presented herein include Distributable Earnings, or “DE”, Fee Related Earnings, or “FRE”, Spread Related Earnings, or “SRE”, and Principal Investing Income, or “PII”, among others. Refer to the Definitions pages for the definitions of the non-GAAP measures presented herein, as well as Reconciliations of GAAP to Non-GAAP Measures pages for reconciliations of the most comparable GAAP measures to the non-GAAP measures. Target Returns Target returns including Target IRR are presented solely for providing insight into an investment’s objectives and detailing anticipated risk and reward characteristics in order to facilitate comparisons with other investments and for establishing a benchmark for future evaluation of the investment’s performance. Target returns are not predictions, projections or guarantees of future performance. Target returns are based upon estimates and assumptions that a potential investment will yield a return equal to or greater than the target. There can be no assurance that Apollo will be successful in finding investment opportunities that meet these anticipated return parameters. Apollo’s target of potential returns from an investment is not a guarantee as to the quality of the investment or a representation as to the adequacy of Apollo’s methodology for estimating returns. Target returns should not be used as a primary basis for an investor’s decision to make an investment. Unless otherwise indicated, target returns are presented gross and do not reflect the effect of applicable fees, incentive compensation, certain expenses and taxes. APOLLO INVESTOR DAY 2021
Important Information Index Comparisons Index performance and yield data are shown for illustrative purposes only and have limitations when used for comparison or for other purposes due to, among other matters, volatility, credit or other factors (such as number of investments, recycling or reinvestment of distributions, and types of assets). It may not be possible to directly invest in one or more of these indices and the holdings of any strategy may differ markedly from the holdings of any such index in terms of levels of diversification, types of securities or assets represented and other significant factors. Indices are unmanaged, do not charge any fees or expenses, assume reinvestment of income and do not employ special investment techniques such as leveraging or short selling. No such index is indicative of the future results of any strategy or Apollo Fund. Set forth below is additional information about index performance and yield data included in this presentation. Cambridge Associates Private Investments Database (“Cambridge”) publishes performance benchmarks based on quarterly unaudited and annual audited financial statements produced by over 2,000 fund managers for over 7,500 funds. These benchmarks also capture gross performance information for over 81,000 investments of venture capital, growth equity, buyout, subordinated capital and private equity energy funds. It is important to note that Cambridge’s benchmarks are generally reported on a one-quarter lag from the end of the performance quarter. Therefore, this index should be considered materially different from an Apollo fund’s portfolio and performance, which may have the benefit of an additional quarter of performance data. Cambridge’s benchmarks have limitations when used as a basis for comparison and are therefore intended to be used solely as an illustrative proxy for performance generally in the private equity space. Additional information on Cambridge can be found here. Cambridge Associates Private Credit Index is a horizon calculation based on data compiled from 461 private credit funds, including fully-liquidated partnerships, formed between 1986 and 2018. Cambridge Associates LLC U.S. Private Equity Index and Benchmark Statistics, as of March 31, 2021, the most recent data available, represents end-to-end pooled mean net returns to limited partners (net of fees, expenses and carried interest) for all U.S. Private Equity. Estimated Top Quartile PE, Cambridge Associates LLC U.S. Private Equity Index and Benchmark Statistics, as of March 31, 2021, the most recent data available, is calculated by taking the 5 year, 10 year and 25 year return metrics and adding the average of the delta between Top Quartile IRRs and the Pooled Mean Net to Limited Partners for each vintage year in the selected timeframe. Bloomberg Barclays U.S. Aggregate Bond Index (“Barclays Agg”) is a market capitalization-weighted bond market index representing intermediate term investment grade bonds traded in the United States. Additional information on the Barclays Agg can be found here. CoreLogic Home Price Index (“CoreLogic HPI”) represents a comprehensive and current set of home price indexes. CoreLogic HPI features over 40 years of real estate transaction data, leveraging robust housing resale data, and monthly updates to incorporate new data. Additional information on the CoreLogic HPI can be found here. S&P 500 Index (“S&P 500”) is a market capitalization-weighted index of the 500 largest U.S. publicly traded companies by market value. The S&P 500 is a market value or market-capitalization-weighted index and one of the most common benchmarks for the broader U.S. equity markets. Additional information on the S&P 500 can be found here. S&P/LSTA Leveraged Loan 100 Index (“S&P LL100”) is a market value-weighted index designed to measure the performance of the U.S. leveraged loan market based upon market weightings, spreads and interest payments. Additional information on the S&P LL100 can be found here. J.P. Morgan U.S. Liquid Index (“JULI”) encompasses fixed rate high-grade coverage across the U.S. Additional information on the JULI can be found here. Models Models that may be contained herein (the “Models”) are being provided for illustrative and discussion purposes only and are not intended to forecast or predict future events. Information provided in the Models may not reflect the most current data and is subject to change. The Models are based on estimates and assumptions that are also subject to change and may be subject to significant business, economic and competitive uncertainties, including numerous uncontrollable market and event driven situations. There is no guarantee that the information presented in the Models is accurate. Actual results may differ materially from those reflected and contemplated in such hypothetical, forward-looking information. Undue reliance should not be placed on such information and investors should not use the Models to make investment decisions. Apollo has no duty to update the Models in the future. APOLLO INVESTOR DAY 2021Important Information Index Comparisons Index performance and yield data are shown for illustrative purposes only and have limitations when used for comparison or for other purposes due to, among other matters, volatility, credit or other factors (such as number of investments, recycling or reinvestment of distributions, and types of assets). It may not be possible to directly invest in one or more of these indices and the holdings of any strategy may differ markedly from the holdings of any such index in terms of levels of diversification, types of securities or assets represented and other significant factors. Indices are unmanaged, do not charge any fees or expenses, assume reinvestment of income and do not employ special investment techniques such as leveraging or short selling. No such index is indicative of the future results of any strategy or Apollo Fund. Set forth below is additional information about index performance and yield data included in this presentation. Cambridge Associates Private Investments Database (“Cambridge”) publishes performance benchmarks based on quarterly unaudited and annual audited financial statements produced by over 2,000 fund managers for over 7,500 funds. These benchmarks also capture gross performance information for over 81,000 investments of venture capital, growth equity, buyout, subordinated capital and private equity energy funds. It is important to note that Cambridge’s benchmarks are generally reported on a one-quarter lag from the end of the performance quarter. Therefore, this index should be considered materially different from an Apollo fund’s portfolio and performance, which may have the benefit of an additional quarter of performance data. Cambridge’s benchmarks have limitations when used as a basis for comparison and are therefore intended to be used solely as an illustrative proxy for performance generally in the private equity space. Additional information on Cambridge can be found here. Cambridge Associates Private Credit Index is a horizon calculation based on data compiled from 461 private credit funds, including fully-liquidated partnerships, formed between 1986 and 2018. Cambridge Associates LLC U.S. Private Equity Index and Benchmark Statistics, as of March 31, 2021, the most recent data available, represents end-to-end pooled mean net returns to limited partners (net of fees, expenses and carried interest) for all U.S. Private Equity. Estimated Top Quartile PE, Cambridge Associates LLC U.S. Private Equity Index and Benchmark Statistics, as of March 31, 2021, the most recent data available, is calculated by taking the 5 year, 10 year and 25 year return metrics and adding the average of the delta between Top Quartile IRRs and the Pooled Mean Net to Limited Partners for each vintage year in the selected timeframe. Bloomberg Barclays U.S. Aggregate Bond Index (“Barclays Agg”) is a market capitalization-weighted bond market index representing intermediate term investment grade bonds traded in the United States. Additional information on the Barclays Agg can be found here. CoreLogic Home Price Index (“CoreLogic HPI”) represents a comprehensive and current set of home price indexes. CoreLogic HPI features over 40 years of real estate transaction data, leveraging robust housing resale data, and monthly updates to incorporate new data. Additional information on the CoreLogic HPI can be found here. S&P 500 Index (“S&P 500”) is a market capitalization-weighted index of the 500 largest U.S. publicly traded companies by market value. The S&P 500 is a market value or market-capitalization-weighted index and one of the most common benchmarks for the broader U.S. equity markets. Additional information on the S&P 500 can be found here. S&P/LSTA Leveraged Loan 100 Index (“S&P LL100”) is a market value-weighted index designed to measure the performance of the U.S. leveraged loan market based upon market weightings, spreads and interest payments. Additional information on the S&P LL100 can be found here. J.P. Morgan U.S. Liquid Index (“JULI”) encompasses fixed rate high-grade coverage across the U.S. Additional information on the JULI can be found here. Models Models that may be contained herein (the “Models”) are being provided for illustrative and discussion purposes only and are not intended to forecast or predict future events. Information provided in the Models may not reflect the most current data and is subject to change. The Models are based on estimates and assumptions that are also subject to change and may be subject to significant business, economic and competitive uncertainties, including numerous uncontrollable market and event driven situations. There is no guarantee that the information presented in the Models is accurate. Actual results may differ materially from those reflected and contemplated in such hypothetical, forward-looking information. Undue reliance should not be placed on such information and investors should not use the Models to make investment decisions. Apollo has no duty to update the Models in the future. APOLLO INVESTOR DAY 2021
Important Information Pipeline Information Fundraising and investment pipeline information herein is based on a number of assumptions that are subject to significant business, market, economic and competitive uncertainties, many of which are beyond Apollo’s control or are subject to change. As such, there is no guarantee that the opportunities identified in the pipeline will be available in the future, launched, consummated or achieve target returns. Funds, Products and Investments that Have Not Yet Launched/Closed Certain Apollo Funds, products, strategies, etc. referenced herein may not have launched or closed, including but not limited to Apollo Debt Solutions BDC, Fund X and the Apollo SPAC Fund, and there can be no guarantee or assurance that they will launch or close in the future. In addition, certain transactions referenced herein, including but not limited to, the Apollo-Athene merger, FWD and Foundation, have not closed, and are subject to closing conditions. There can be no guarantee or assurance that these transactions will close. References to Base Plan References to a Base Plan throughout this presentation refer to an aspirational business plan that is hypothetical, presented for illustrative purposes only and based on a variety of assumptions. There is no guarantee that base plan results indicated herein will be achieved. References to Certain Investments Specific references to investments have been provided on a non-performance based criteria for information purposes only. Apollo makes no guarantee that similar investments would be available in the future or, if available, would be profitable. Not all investments shown are currently held by an Apollo Fund. Assets Under Management Assets under management, or “AUM”, is defined in the Definitions pages. Please note that certain references to AUM provided herein may include totals from different Apollo Funds, or investments from different segments in order to present strategy related information. In addition, certain AUM figures presented herein may be rounded and as a result of certain rounding differences, totals may not reconcile with overall AUM. Ratings Information Apollo, its affiliates, and third parties that provide information to Apollo, such as rating agencies, do not guarantee the accuracy, completeness, timeliness or availability of any information, including ratings, and are not responsible for any errors or omissions (negligent or otherwise), regardless of the cause, or the results obtained from the use of such content. Apollo, its affiliates and third party content providers give no express or implied warranties, including, but not limited to, any warranties of merchantability or fitness for a particular purpose or use, and they expressly disclaim any responsibility or liability for direct, indirect, incidental, exemplary, compensatory, punitive, special or consequential damages, costs expenses, legal fees or losses (including lost income or profits and opportunity costs) in connection with the use of the information herein. Credit ratings are statements of opinions and not statements of facts or recommendations to purchase, hold or sell securities. They do not address the suitability of securities for investment purposes and should not be relied on as investment advice. Neither Apollo nor any of its respective affiliates have any responsibility to update any of the information provided in this summary document. Please see the Forward Looking Statements and Important Disclosures pages and Definitions pages for additional important disclosures and definitions. Historical definitions of certain terms used herein may differ from current definitions. In addition, information about factors affecting Apollo and Athene, including a description of risks that should be considered when making a decision to purchase or sell any securities of Apollo and Athene, can be found in each company’s public filings with the SEC that are available at http://www.sec.gov. APOLLO INVESTOR DAY 2021
Definitions Pro forma for the merger with Athene, we expect the combined company will present its reportable business segments as asset management, retirement services and principal investing, and will report “Fee Related Earnings”, “Spread Related Earnings”, and “Principal Investing Income”, for each segment, respectively. The asset management segment is expected to include Apollo’s alternative asset management business with a focus on three strategies - yield, equity and hybrid. The retirement services segment is expected to include Athene’s business which issues and reinsures retirement savings products. The principal investing segment is expected to include Apollo’s strategic equity investments and performance allocations from the funds it manages, as well as certain corporate and financing activities. “Pre-tax Distributable Earnings” is the sum of (i) Fee Related Earnings, (ii) Spread Related Earnings, and (iii) Principal Investing Income and is expected to be the key performance measure used by management in evaluating the performance of the combined segments. For current and historical periods presented in this presentation, Segment Distributable Earnings, Distributable Earnings, Fee Related Earnings, and Spread Related Earnings have the meanings set forth below: “Segment Distributable Earnings” or “Segment DE” is the key performance measure used by management in evaluating the performance of Apollo’s credit, private equity and real assets segments. Management uses Segment DE to make key operating decisions such as thefollowing: • Decisions related to the allocation of resources such as staffing decisions including hiring and locations for deployment of the new hires; • Decisions related to capital deployment such as providing capital to facilitate growth for the business and/or to facilitate expansion into new businesses; • Decisions related to expenses, such as determining annual discretionary bonuses and equity-based compensation awards to its employees. With respect to compensation, management seeks to align the interests of certain professionals and selected other individuals with those of the investors in the funds and those of Apollo’s stockholders by providing such individuals a profit sharing interest in the performance fees earned in relation to the funds. To achieve that objective, a certain amount of compensation is based on Apollo’s performance and growth for the year; and • Decisions related to the amount of earnings available for dividends to Class A Common Stockholders, holders of RSUs that participate in dividends and holders of AOG Units. Segment DE is the sum of (i) total management fees and advisory and transaction fees, (ii) other income (loss), (iii) realized performance fees, excluding realizations received in the form of shares and (iv) realized investment income, net which includes dividends from our permanent capital vehicles, net of amounts to be distributed to certain employees as part of a dividend compensation program, less (x) compensation expense, excluding the expense related to equity-based awards, (y) realized profit sharing expense, and (z) non-compensation expenses. Segment DE represents the amount of Apollo’s net realized earnings, excluding the effects of the consolidation of any of the related funds and SPACs, Taxes and Related Payables, transaction- related charges and any acquisitions. Transaction-related charges includes equity-based compensation charges, the amortization of intangible assets, contingent consideration, and certain other charges associated with acquisitions, and restructuring charges. In addition, Segment DE excludes non-cash revenue and expense related to equity awards granted by unconsolidated related parties to employees of the Company, compensation and administrative related expense reimbursements, as well as the assets, liabilities and operating results of the funds and VIEs that are included in the consolidated financial statements. “Distributable Earnings” or “DE” represents Segment DE less estimated current corporate, local and non-U.S. taxes as well as the current payable under Apollo’s tax receivable agreement. DE is net of preferred dividends, if any, to the Series A and Series B Preferred Stockholders. DE excludes the impacts of the remeasurement of deferred tax assets and liabilities which arises from changes in estimated future tax rates. The economic assumptions and methodologies that impact the implied income tax provision are similar to those methodologies and certain assumptions used in calculating the income tax provision for Apollo’s consolidated statements of operations under U.S. GAAP. Specifically, certain deductions considered in the income tax provision under U.S. GAAP such as the deduction for transaction related charges and equity-based compensation are taken into account for purposes of the implied tax provision. Management believes that excluding the remeasurement of the tax receivable agreement and deferred taxes from Segment DE and DE, respectively, is meaningful as it increases comparability between periods. Remeasurement of the tax receivable agreement and deferred taxes are estimates that may change due to changes in interpretations of tax law. “Fee Related Earnings”, or “FRE”, is derived from our segment reported results and refers to a component of DE that is used as a supplemental performance measure to assess whether revenues that we believe are generally more stable and predictable in nature, primarily consisting of management fees, are sufficient to cover associated operating expenses and generate profits. FRE is the sum across all segments of (i) management fees, (ii) advisory and transaction fees, (iii) performance fees related to business development companies, Redding Ridge Holdings, and MidCap and (iv) other income, net, less (x) salary, bonus and benefits, excluding equity-based compensation (y) other associated operating expenses and (z) non-controlling interests in the management companies of certain funds the Company manages. “Spread Related Earnings”, or “SRE” is derived from segment reported results and refers to a component of DE that is used as a supplemental performance measure to assess the performance of the Retirement Services segment excluding certain market volatility and expenses related to integration, restructuring, equity-based compensation, and other expenses. For the Retirement Services segment, SRE equals the sum of (i) the net investment income earned on Athene’s net invested assets and (ii) management fees earned on the ADIP share of ACRA assets, less (x) cost of funds, including cost of crediting and other liability costs, (y) operating expenses excluding equity-based compensation and (z) financing costs including interest expense and preferred dividends paid to Athene Preferred Stockholders. APOLLO INVESTOR DAY 2021Definitions Pro forma for the merger with Athene, we expect the combined company will present its reportable business segments as asset management, retirement services and principal investing, and will report “Fee Related Earnings”, “Spread Related Earnings”, and “Principal Investing Income”, for each segment, respectively. The asset management segment is expected to include Apollo’s alternative asset management business with a focus on three strategies - yield, equity and hybrid. The retirement services segment is expected to include Athene’s business which issues and reinsures retirement savings products. The principal investing segment is expected to include Apollo’s strategic equity investments and performance allocations from the funds it manages, as well as certain corporate and financing activities. “Pre-tax Distributable Earnings” is the sum of (i) Fee Related Earnings, (ii) Spread Related Earnings, and (iii) Principal Investing Income and is expected to be the key performance measure used by management in evaluating the performance of the combined segments. For current and historical periods presented in this presentation, Segment Distributable Earnings, Distributable Earnings, Fee Related Earnings, and Spread Related Earnings have the meanings set forth below: “Segment Distributable Earnings” or “Segment DE” is the key performance measure used by management in evaluating the performance of Apollo’s credit, private equity and real assets segments. Management uses Segment DE to make key operating decisions such as thefollowing: • Decisions related to the allocation of resources such as staffing decisions including hiring and locations for deployment of the new hires; • Decisions related to capital deployment such as providing capital to facilitate growth for the business and/or to facilitate expansion into new businesses; • Decisions related to expenses, such as determining annual discretionary bonuses and equity-based compensation awards to its employees. With respect to compensation, management seeks to align the interests of certain professionals and selected other individuals with those of the investors in the funds and those of Apollo’s stockholders by providing such individuals a profit sharing interest in the performance fees earned in relation to the funds. To achieve that objective, a certain amount of compensation is based on Apollo’s performance and growth for the year; and • Decisions related to the amount of earnings available for dividends to Class A Common Stockholders, holders of RSUs that participate in dividends and holders of AOG Units. Segment DE is the sum of (i) total management fees and advisory and transaction fees, (ii) other income (loss), (iii) realized performance fees, excluding realizations received in the form of shares and (iv) realized investment income, net which includes dividends from our permanent capital vehicles, net of amounts to be distributed to certain employees as part of a dividend compensation program, less (x) compensation expense, excluding the expense related to equity-based awards, (y) realized profit sharing expense, and (z) non-compensation expenses. Segment DE represents the amount of Apollo’s net realized earnings, excluding the effects of the consolidation of any of the related funds and SPACs, Taxes and Related Payables, transaction- related charges and any acquisitions. Transaction-related charges includes equity-based compensation charges, the amortization of intangible assets, contingent consideration, and certain other charges associated with acquisitions, and restructuring charges. In addition, Segment DE excludes non-cash revenue and expense related to equity awards granted by unconsolidated related parties to employees of the Company, compensation and administrative related expense reimbursements, as well as the assets, liabilities and operating results of the funds and VIEs that are included in the consolidated financial statements. “Distributable Earnings” or “DE” represents Segment DE less estimated current corporate, local and non-U.S. taxes as well as the current payable under Apollo’s tax receivable agreement. DE is net of preferred dividends, if any, to the Series A and Series B Preferred Stockholders. DE excludes the impacts of the remeasurement of deferred tax assets and liabilities which arises from changes in estimated future tax rates. The economic assumptions and methodologies that impact the implied income tax provision are similar to those methodologies and certain assumptions used in calculating the income tax provision for Apollo’s consolidated statements of operations under U.S. GAAP. Specifically, certain deductions considered in the income tax provision under U.S. GAAP such as the deduction for transaction related charges and equity-based compensation are taken into account for purposes of the implied tax provision. Management believes that excluding the remeasurement of the tax receivable agreement and deferred taxes from Segment DE and DE, respectively, is meaningful as it increases comparability between periods. Remeasurement of the tax receivable agreement and deferred taxes are estimates that may change due to changes in interpretations of tax law. “Fee Related Earnings”, or “FRE”, is derived from our segment reported results and refers to a component of DE that is used as a supplemental performance measure to assess whether revenues that we believe are generally more stable and predictable in nature, primarily consisting of management fees, are sufficient to cover associated operating expenses and generate profits. FRE is the sum across all segments of (i) management fees, (ii) advisory and transaction fees, (iii) performance fees related to business development companies, Redding Ridge Holdings, and MidCap and (iv) other income, net, less (x) salary, bonus and benefits, excluding equity-based compensation (y) other associated operating expenses and (z) non-controlling interests in the management companies of certain funds the Company manages. “Spread Related Earnings”, or “SRE” is derived from segment reported results and refers to a component of DE that is used as a supplemental performance measure to assess the performance of the Retirement Services segment excluding certain market volatility and expenses related to integration, restructuring, equity-based compensation, and other expenses. For the Retirement Services segment, SRE equals the sum of (i) the net investment income earned on Athene’s net invested assets and (ii) management fees earned on the ADIP share of ACRA assets, less (x) cost of funds, including cost of crediting and other liability costs, (y) operating expenses excluding equity-based compensation and (z) financing costs including interest expense and preferred dividends paid to Athene Preferred Stockholders. APOLLO INVESTOR DAY 2021
Definitions For future periods presented in this presentation, which are pro-forma for the merger with Athene and assume the establishment of asset management, retirement services and principal investing as the combined company’s reportable business segments, Fee Related Earnings, Spread Related Earnings, Principal Investing Income, Distributable Earnings and Pre-tax Distributable Earnings have the meanings set forth below: “Fee Related Earnings”, or “FRE”, is derived from segment reported results and refers to a component of DE that is used as a supplemental performance measure to assess the performance of the asset management segment. FRE is the sum of (i) management fees, (ii) advisory and transaction fees, (iii) performance fees related to business development companies, Redding Ridge Holdings, and MidCap and (iv) other income, net, less (x) salary, bonus and benefits, excluding equity-based compensation (y) other associated operating expenses and (z) non-controlling interests in the management companies of certain funds the Company manages. “Spread Related Earnings”, or “SRE” is derived from segment reported results and refers to a component of DE that is used as a supplemental performance measure to assess the performance of the Retirement Services segment excluding certain market volatility and expenses related to integration, restructuring, equity-based compensation, and other expenses. For the Retirement Services segment, SRE equals the sum of (i) the net investment income earned on Athene’s net invested assets and (ii) management fees earned on the ADIP share of ACRA assets, less (x) cost of funds, including cost of crediting and other liability costs, (y) operating expenses excluding equity-based compensation and (z) financing costs including interest expense and preferred dividends paid to Athene Preferred Stockholders. “Principal Investing Income”, or “PII” is derived from segment reported results and refers to a component of DE that is used as a supplemental performance measure to assess the performance of the Principal Investing segment. For the Principal Investing segment, PII is the sum of (i) realized performance fees, excluding realizations received in the form of shares, (ii) realized investment income, net which includes dividends from our permanent capital vehicles, net of amounts to be distributed to certain employees as part of a dividend compensation program, less (x) compensation expense, excluding expense related to equity-based compensation, (y) realized profit sharing expense, and (z) certain corporate non-compensation expenses and financing costs including preferred dividends, if any, paid to the Apollo Preferred Stockholders. “Pre-tax Distributable Earnings”, or “Pre-tax DE”, is the key performance measure used by management in evaluating the performance of the asset management, retirement services and principal investing segments. Management uses Pre-tax DE to make key operating decisions such as the following: • Decisions related to the allocation of resources such as staffing decisions including hiring and locations for deployment of the new hires; • Decisions related to capital deployment such as providing capital to facilitate growth for the business and/or to facilitate expansion into new businesses; • Decisions related to expenses, such as determining annual discretionary bonuses and equity-based compensation awards to its employees. With respect to compensation, management seeks to align the interests of certain professionals and selected other individuals with those of the investors in the funds and those of Apollo’s stockholders by providing such individuals a profit sharing interest in the performance fees earned in relation to the funds. To achieve that objective, a certain amount of compensation is based on Apollo’s performance and growth for the year; and • Decisions related to the amount of earnings available for dividends to Class A Common Stockholders and holders of RSUs that participate in dividends. Pre-tax DE is the sum of (i) Fee Related Earnings, (ii) Spread Related Earnings, and (iii) Principal Investing Income. Pre-tax DE excludes the effects of the consolidation of any of the related funds and SPACs, Taxes and Related Payables, transaction-related charges and any acquisitions. Transaction-related charges includes equity-based compensation charges, the amortization of intangible assets, contingent consideration, and certain other charges associated with acquisitions, and restructuring charges. In addition, Pre-tax DE excludes non-cash revenue and expense related to equity awards granted by unconsolidated related parties to employees of the Company, compensation and administrative related expense reimbursements, as well as the assets, liabilities and operating results of the funds and VIEs that are included in the consolidated financial statements. “Distributable Earnings” or “DE” represents Pre-tax DE less estimated income taxes. Income taxes on FRE and PII represents the total current corporate, local, and non-U.S. taxes as well as the current payable under Apollo’s tax receivable agreement. Income taxes on FRE and PII excludes the impacts of deferred taxes and the remeasurement of the tax receivable agreement, which arise from changes in estimated future tax rates. Certain assumptions and methodologies that impact the implied FRE and PII income tax provision are similar to those used under U.S. GAAP. Specifically, certain deductions considered in the income tax provision under U.S. GAAP relating to transaction related charges and equity-based compensation are taken into account for the implied tax provision. Income Taxes on SRE represent the total current and deferred tax expense or benefit on income before taxes adjusted to eliminate the impact of the tax expense or benefit associated with the non-operating adjustments. Management believes the methodologies used to compute income taxes on FRE, PII, SRE are meaningful to each segment and increases comparability of income taxes between periods. APOLLO INVESTOR DAY 2021Definitions For future periods presented in this presentation, which are pro-forma for the merger with Athene and assume the establishment of asset management, retirement services and principal investing as the combined company’s reportable business segments, Fee Related Earnings, Spread Related Earnings, Principal Investing Income, Distributable Earnings and Pre-tax Distributable Earnings have the meanings set forth below: “Fee Related Earnings”, or “FRE”, is derived from segment reported results and refers to a component of DE that is used as a supplemental performance measure to assess the performance of the asset management segment. FRE is the sum of (i) management fees, (ii) advisory and transaction fees, (iii) performance fees related to business development companies, Redding Ridge Holdings, and MidCap and (iv) other income, net, less (x) salary, bonus and benefits, excluding equity-based compensation (y) other associated operating expenses and (z) non-controlling interests in the management companies of certain funds the Company manages. “Spread Related Earnings”, or “SRE” is derived from segment reported results and refers to a component of DE that is used as a supplemental performance measure to assess the performance of the Retirement Services segment excluding certain market volatility and expenses related to integration, restructuring, equity-based compensation, and other expenses. For the Retirement Services segment, SRE equals the sum of (i) the net investment income earned on Athene’s net invested assets and (ii) management fees earned on the ADIP share of ACRA assets, less (x) cost of funds, including cost of crediting and other liability costs, (y) operating expenses excluding equity-based compensation and (z) financing costs including interest expense and preferred dividends paid to Athene Preferred Stockholders. “Principal Investing Income”, or “PII” is derived from segment reported results and refers to a component of DE that is used as a supplemental performance measure to assess the performance of the Principal Investing segment. For the Principal Investing segment, PII is the sum of (i) realized performance fees, excluding realizations received in the form of shares, (ii) realized investment income, net which includes dividends from our permanent capital vehicles, net of amounts to be distributed to certain employees as part of a dividend compensation program, less (x) compensation expense, excluding expense related to equity-based compensation, (y) realized profit sharing expense, and (z) certain corporate non-compensation expenses and financing costs including preferred dividends, if any, paid to the Apollo Preferred Stockholders. “Pre-tax Distributable Earnings”, or “Pre-tax DE”, is the key performance measure used by management in evaluating the performance of the asset management, retirement services and principal investing segments. Management uses Pre-tax DE to make key operating decisions such as the following: • Decisions related to the allocation of resources such as staffing decisions including hiring and locations for deployment of the new hires; • Decisions related to capital deployment such as providing capital to facilitate growth for the business and/or to facilitate expansion into new businesses; • Decisions related to expenses, such as determining annual discretionary bonuses and equity-based compensation awards to its employees. With respect to compensation, management seeks to align the interests of certain professionals and selected other individuals with those of the investors in the funds and those of Apollo’s stockholders by providing such individuals a profit sharing interest in the performance fees earned in relation to the funds. To achieve that objective, a certain amount of compensation is based on Apollo’s performance and growth for the year; and • Decisions related to the amount of earnings available for dividends to Class A Common Stockholders and holders of RSUs that participate in dividends. Pre-tax DE is the sum of (i) Fee Related Earnings, (ii) Spread Related Earnings, and (iii) Principal Investing Income. Pre-tax DE excludes the effects of the consolidation of any of the related funds and SPACs, Taxes and Related Payables, transaction-related charges and any acquisitions. Transaction-related charges includes equity-based compensation charges, the amortization of intangible assets, contingent consideration, and certain other charges associated with acquisitions, and restructuring charges. In addition, Pre-tax DE excludes non-cash revenue and expense related to equity awards granted by unconsolidated related parties to employees of the Company, compensation and administrative related expense reimbursements, as well as the assets, liabilities and operating results of the funds and VIEs that are included in the consolidated financial statements. “Distributable Earnings” or “DE” represents Pre-tax DE less estimated income taxes. Income taxes on FRE and PII represents the total current corporate, local, and non-U.S. taxes as well as the current payable under Apollo’s tax receivable agreement. Income taxes on FRE and PII excludes the impacts of deferred taxes and the remeasurement of the tax receivable agreement, which arise from changes in estimated future tax rates. Certain assumptions and methodologies that impact the implied FRE and PII income tax provision are similar to those used under U.S. GAAP. Specifically, certain deductions considered in the income tax provision under U.S. GAAP relating to transaction related charges and equity-based compensation are taken into account for the implied tax provision. Income Taxes on SRE represent the total current and deferred tax expense or benefit on income before taxes adjusted to eliminate the impact of the tax expense or benefit associated with the non-operating adjustments. Management believes the methodologies used to compute income taxes on FRE, PII, SRE are meaningful to each segment and increases comparability of income taxes between periods. APOLLO INVESTOR DAY 2021
Definitions “ACRA” refers to Athene Co-Invest Reinsurance Affiliate 1A Ltd. “ADIP” refers to Apollo/Athene Dedicated Investment Program. “Apollo” refers to Apollo Global Management, Inc., together with its subsidiaries. “Apollo Operating Group” or “AOG” refers to (i) the limited partnerships and limited liability companies through which Apollo currently operates its businesses and (ii) one or more limited partnerships or limited liability companies formed for the purpose of, among other activities, holding certain of Apollo’s gains or losses on its principal investments in the funds. “Assets Under Management” or “AUM” refers to the assets of the funds, partnerships and accounts to which Apollo provides investment management, advisory, or certain other investment-related services, including, without limitation, capital that such funds, partnerships and accounts have the right to call from investors pursuant to capital commitments. Our AUM equals the sum of: 1. the net asset value (“NAV”), plus used or available leverage and/or capital commitments, or gross assets plus capital commitments, of the yield and certain hybrid funds, partnerships and accounts for which we provide investment management or advisory services, other than certain collateralized loan obligations (“CLOs”), collateralized debt obligations (“CDOs”), and certain permanent capital vehicles, which have a fee-generating basis other than the mark-to-market value of the underlying assets; for certain permanent capital vehicles in yield, gross asset value plus available financing capacity; 2. the fair value of the investments of the equity and certain hybrid funds, partnerships and accounts Apollo manages or advise, plus the capital that such funds, partnerships and accounts are entitled to call from investors pursuant to capital commitments, plus portfolio level financings; 3. the gross asset value associated with the reinsurance investments of the portfolio company assets Apollo manages or advises; and 4. the fair value of any other assets that Apollo manages or advises for the funds, partnerships and accounts to which Apollo provides investment management, advisory, or certain other investment-related services, plus unused credit facilities, including capital commitments to such funds, partnerships and accounts for investments that may require pre- qualification or other conditions before investment plus any other capital commitments to such funds, partnerships and accounts available for investment that are not otherwise included in the clauses above. Apollo’s AUM measure includes Assets Under Management for which Apollo charges either nominal or zero fees. Apollo’s AUM measure also includes assets for which Apollo does not have investment discretion, including certain assets for which Apollo earns only investment-related service fees, rather than management or advisory fees. Apollo’s definition of AUM is not based on any definition of Assets Under Management contained in its governing documents or in any of Apollo Fund management agreements. Apollo considers multiple factors for determining what should be included in its definition of AUM. Such factors include but are not limited to (1) Apollo’s ability to influence the investment decisions for existing and available assets; (2) Apollo’s ability to generate income from the underlying assets in its funds; and (3) the AUM measures that Apollo uses internally or believe are used by other investment managers. Given the differences in the investment strategies and structures among other alternative investment managers, Apollo’s calculation of AUM may differ from the calculations employed by other investment managers and, as a result, this measure may not be directly comparable to similar measures presented by other investment managers. Apollo’s calculation also differs from the manner in which its affiliates registered with the SEC report “Regulatory Assets Under Management” on Form ADV and Form PF in various ways. Apollo uses AUM, Capital deployed and Dry powder as performance measurements of its investment activities, as well as to monitor fund size in relation to professional resource and infrastructure needs. a) “Fee-Generating AUM” or “FGAUM” consists of assets of the funds, partnerships and accounts to which we provide investment management, advisory, or certain other investment-related services and on which we earn management fees, monitoring fees or other investment-related fees pursuant to management or other fee agreements on a basis that varies among the Apollo funds, partnerships and accounts. Management fees are normally based on “net asset value,” “gross assets,” “adjusted par asset value,” “adjusted cost of all unrealized portfolio investments,” “capital commitments,” “adjusted assets,” “stockholders’ equity,” “invested capital” or “capital contributions,” each as defined in the applicable management agreement. Monitoring fees, also referred to as advisory fees, with respect to the structured portfolio company investments of the funds, partnerships and accounts we manage or advise, are generally based on the total value of such structured portfolio company investments, which normally includes leverage, less any portion of such total value that is already considered in Fee-Generating AUM. “Athene” refers to Athene Holding Ltd. (together with its subsidiaries, “Athene”), a leading retirement services company that issues, reinsures and acquires retirement savings products designed for the increasing number of individuals and institutions seeking to fund retirement needs, and to which Apollo, through its consolidated subsidiary Apollo Insurance Solutions Group LP (formerly known as Athene Asset Management LLC) (“ISG”), provides asset management and advisory services. APOLLO INVESTOR DAY 2021Definitions “ACRA” refers to Athene Co-Invest Reinsurance Affiliate 1A Ltd. “ADIP” refers to Apollo/Athene Dedicated Investment Program. “Apollo” refers to Apollo Global Management, Inc., together with its subsidiaries. “Apollo Operating Group” or “AOG” refers to (i) the limited partnerships and limited liability companies through which Apollo currently operates its businesses and (ii) one or more limited partnerships or limited liability companies formed for the purpose of, among other activities, holding certain of Apollo’s gains or losses on its principal investments in the funds. “Assets Under Management” or “AUM” refers to the assets of the funds, partnerships and accounts to which Apollo provides investment management, advisory, or certain other investment-related services, including, without limitation, capital that such funds, partnerships and accounts have the right to call from investors pursuant to capital commitments. Our AUM equals the sum of: 1. the net asset value (“NAV”), plus used or available leverage and/or capital commitments, or gross assets plus capital commitments, of the yield and certain hybrid funds, partnerships and accounts for which we provide investment management or advisory services, other than certain collateralized loan obligations (“CLOs”), collateralized debt obligations (“CDOs”), and certain permanent capital vehicles, which have a fee-generating basis other than the mark-to-market value of the underlying assets; for certain permanent capital vehicles in yield, gross asset value plus available financing capacity; 2. the fair value of the investments of the equity and certain hybrid funds, partnerships and accounts Apollo manages or advise, plus the capital that such funds, partnerships and accounts are entitled to call from investors pursuant to capital commitments, plus portfolio level financings; 3. the gross asset value associated with the reinsurance investments of the portfolio company assets Apollo manages or advises; and 4. the fair value of any other assets that Apollo manages or advises for the funds, partnerships and accounts to which Apollo provides investment management, advisory, or certain other investment-related services, plus unused credit facilities, including capital commitments to such funds, partnerships and accounts for investments that may require pre- qualification or other conditions before investment plus any other capital commitments to such funds, partnerships and accounts available for investment that are not otherwise included in the clauses above. Apollo’s AUM measure includes Assets Under Management for which Apollo charges either nominal or zero fees. Apollo’s AUM measure also includes assets for which Apollo does not have investment discretion, including certain assets for which Apollo earns only investment-related service fees, rather than management or advisory fees. Apollo’s definition of AUM is not based on any definition of Assets Under Management contained in its governing documents or in any of Apollo Fund management agreements. Apollo considers multiple factors for determining what should be included in its definition of AUM. Such factors include but are not limited to (1) Apollo’s ability to influence the investment decisions for existing and available assets; (2) Apollo’s ability to generate income from the underlying assets in its funds; and (3) the AUM measures that Apollo uses internally or believe are used by other investment managers. Given the differences in the investment strategies and structures among other alternative investment managers, Apollo’s calculation of AUM may differ from the calculations employed by other investment managers and, as a result, this measure may not be directly comparable to similar measures presented by other investment managers. Apollo’s calculation also differs from the manner in which its affiliates registered with the SEC report “Regulatory Assets Under Management” on Form ADV and Form PF in various ways. Apollo uses AUM, Capital deployed and Dry powder as performance measurements of its investment activities, as well as to monitor fund size in relation to professional resource and infrastructure needs. a) “Fee-Generating AUM” or “FGAUM” consists of assets of the funds, partnerships and accounts to which we provide investment management, advisory, or certain other investment-related services and on which we earn management fees, monitoring fees or other investment-related fees pursuant to management or other fee agreements on a basis that varies among the Apollo funds, partnerships and accounts. Management fees are normally based on “net asset value,” “gross assets,” “adjusted par asset value,” “adjusted cost of all unrealized portfolio investments,” “capital commitments,” “adjusted assets,” “stockholders’ equity,” “invested capital” or “capital contributions,” each as defined in the applicable management agreement. Monitoring fees, also referred to as advisory fees, with respect to the structured portfolio company investments of the funds, partnerships and accounts we manage or advise, are generally based on the total value of such structured portfolio company investments, which normally includes leverage, less any portion of such total value that is already considered in Fee-Generating AUM. “Athene” refers to Athene Holding Ltd. (together with its subsidiaries, “Athene”), a leading retirement services company that issues, reinsures and acquires retirement savings products designed for the increasing number of individuals and institutions seeking to fund retirement needs, and to which Apollo, through its consolidated subsidiary Apollo Insurance Solutions Group LP (formerly known as Athene Asset Management LLC) (“ISG”), provides asset management and advisory services. APOLLO INVESTOR DAY 2021
Definitions “Athora” refers to a strategic platform that acquires or reinsures blocks of insurance business in the German and broader European life insurance market (collectively, the “Athora Accounts”). “Advisory” / “Other Assets” refers to certain assets advised by Apollo Asset Management Europe PC LLP (“AAME PC”), a wholly-owned subsidiary of Apollo Asset Management Europe LLP (“AAME”). AAME PC and AAME are subsidiaries of Apollo and are collectively referred to herein as “ISGI”. “Capital deployed” or “Capital deployment” or “Deployment” represents (i) the aggregate amount of capital that has been invested during a given period (including leverage) by our commitment based funds and SIAs that have a defined maturity date, (ii) purchases of investments (net of sales) by our subscription and contribution based funds and mandates (including leverage), (iii) investments originated by certain of our platform companies, net of syndications to our other funds and accounts, but including syndications to third parties, and (iv) third-party investment activity in opportunities sourced by our teams for which we earn a fee and in which we participate. Deployment excludes offsetting short positions, certain credit derivatives, certain short-dated government securities, and involuntary repayment of loans and bonds. “FRE margin” is calculated as Fee Related Earnings divided by fee related revenues (which includes management fees, transaction and advisory fees and certain performance fees), as well as other income attributable to FRE. “Gross IRR” of Accord Series, Structured Credit Recovery and the European Principal Finance funds represents the annualized return of a fund based on the actual timing of all cumulative fund cash flows before management fees, performance fees allocated to the general partner and certain other expenses. Calculations may include certain investors that do not pay fees. The terminal value is the net asset value as of the reporting date. Non-U.S. dollar denominated (“USD”) fund cash flows and residual values are converted to USD using the spot rate as of the reporting date. In addition, gross IRRs at the fund level will differ from those at the individual investor level as a result of, among other factors, timing of investor-level inflows and outflows. Gross IRR does not represent the return to any fund investor. “Gross IRR” of Flagship Private Equity and Hybrid Value Fund represents the cumulative investment-related cash flows (i) for a given investment for the fund or funds which made such investment, and (ii) for a given fund, in the relevant fund itself (and not any one investor in the fund), in each case, on the basis of the actual timing of investment inflows and outflows (for unrealized investments assuming disposition on June 30, 2021 or other date specified) aggregated on a gross basis quarterly, and the return is annualized and compounded before management fees, performance fees and certain other expenses (including interest incurred by the fund itself) and measures the returns on the fund’s investments as a whole without regard to whether all of the returns would, if distributed, be payable to the fund’s investors. In addition, gross IRRs at the fund level will differ from those at the individual investor level as a result of, among other factors, timing of investor-level inflows and outflows. Gross IRR does not represent the return to any fund investor. “Gross IRR” of Real Estate Equity, Hybrid Real Estate and Infrastructure funds represents the cumulative investment-related cash flows in the fund itself (and not any one investor in the fund), on the basis of the actual timing of cash inflows and outflows (for unrealized investments assuming disposition on June 30, 2021 or other date specified) starting on the date that each investment closes, and the return is annualized and compounded before management fees, performance fees, and certain other expenses (including interest incurred by the fund itself) and measures the returns on the fund’s investments as a whole without regard to whether all of the returns would, if distributed, be payable to the fund’s investors. Non-USD fund cash flows and residual values are converted to USD using the spot rate as of the reporting date. In addition, gross IRRs at the fund level will differ from those at the individual investor level as a result of, among other factors, timing of investor-level inflows and outflows. Gross IRR does not represent the return to any fund investor. “Gross MOIC” means, with respect to a given investment, fund, or the infrastructure performance metrics, the ratio of Total Value to Total Invested Capital. As used in this definition: • “Realized Value” refers to all cash investment proceeds received by the relevant Apollo Fund, including interest and dividends, but does not give effect to management fees, expenses, incentive compensation or performance fees to be paid by such Apollo Fund. • “Total Invested Capital” refers to the aggregate cash invested by the relevant Apollo Fund and includes capitalized costs relating to investment activities, if any, but does not give effect to cash pending investment or available for reserves and excludes amounts, if any, invested on a financed basis with leverage facilities. • “Total Value” represents the sum of the total Realized Value and Unrealized Value of investments. • “Unrealized Value” refers to the fair value consistent with valuations determined in accordance with generally accepted accounting principles in the United States of America (“U.S. GAAP”), for investments not yet realized and may include payments in kind, accrued interest and dividends receivable, if any, and before the effect of certain taxes. In addition, amounts include committed and funded amounts for certain investments. “Gross Return” of a yield fund is the monthly or quarterly time-weighted return that is equal to the percentage change in the value of a fund’s portfolio, adjusted for all contributions and withdrawals (cash flows) before the effects of management fees, incentive fees allocated to the general partner, or other fees and expenses. Returns for yield funds are calculated for all funds and accounts in the respective strategies excluding assets for Athene, Athora and certain other entities where Apollo manages or may manage a significant portion of the total company assets. Returns of CLOs represent the gross returns on assets. Returns over multiple periods are calculated by geometrically linking each period’s return over time. APOLLO INVESTOR DAY 2021Definitions “Athora” refers to a strategic platform that acquires or reinsures blocks of insurance business in the German and broader European life insurance market (collectively, the “Athora Accounts”). “Advisory” / “Other Assets” refers to certain assets advised by Apollo Asset Management Europe PC LLP (“AAME PC”), a wholly-owned subsidiary of Apollo Asset Management Europe LLP (“AAME”). AAME PC and AAME are subsidiaries of Apollo and are collectively referred to herein as “ISGI”. “Capital deployed” or “Capital deployment” or “Deployment” represents (i) the aggregate amount of capital that has been invested during a given period (including leverage) by our commitment based funds and SIAs that have a defined maturity date, (ii) purchases of investments (net of sales) by our subscription and contribution based funds and mandates (including leverage), (iii) investments originated by certain of our platform companies, net of syndications to our other funds and accounts, but including syndications to third parties, and (iv) third-party investment activity in opportunities sourced by our teams for which we earn a fee and in which we participate. Deployment excludes offsetting short positions, certain credit derivatives, certain short-dated government securities, and involuntary repayment of loans and bonds. “FRE margin” is calculated as Fee Related Earnings divided by fee related revenues (which includes management fees, transaction and advisory fees and certain performance fees), as well as other income attributable to FRE. “Gross IRR” of Accord Series, Structured Credit Recovery and the European Principal Finance funds represents the annualized return of a fund based on the actual timing of all cumulative fund cash flows before management fees, performance fees allocated to the general partner and certain other expenses. Calculations may include certain investors that do not pay fees. The terminal value is the net asset value as of the reporting date. Non-U.S. dollar denominated (“USD”) fund cash flows and residual values are converted to USD using the spot rate as of the reporting date. In addition, gross IRRs at the fund level will differ from those at the individual investor level as a result of, among other factors, timing of investor-level inflows and outflows. Gross IRR does not represent the return to any fund investor. “Gross IRR” of Flagship Private Equity and Hybrid Value Fund represents the cumulative investment-related cash flows (i) for a given investment for the fund or funds which made such investment, and (ii) for a given fund, in the relevant fund itself (and not any one investor in the fund), in each case, on the basis of the actual timing of investment inflows and outflows (for unrealized investments assuming disposition on June 30, 2021 or other date specified) aggregated on a gross basis quarterly, and the return is annualized and compounded before management fees, performance fees and certain other expenses (including interest incurred by the fund itself) and measures the returns on the fund’s investments as a whole without regard to whether all of the returns would, if distributed, be payable to the fund’s investors. In addition, gross IRRs at the fund level will differ from those at the individual investor level as a result of, among other factors, timing of investor-level inflows and outflows. Gross IRR does not represent the return to any fund investor. “Gross IRR” of Real Estate Equity, Hybrid Real Estate and Infrastructure funds represents the cumulative investment-related cash flows in the fund itself (and not any one investor in the fund), on the basis of the actual timing of cash inflows and outflows (for unrealized investments assuming disposition on June 30, 2021 or other date specified) starting on the date that each investment closes, and the return is annualized and compounded before management fees, performance fees, and certain other expenses (including interest incurred by the fund itself) and measures the returns on the fund’s investments as a whole without regard to whether all of the returns would, if distributed, be payable to the fund’s investors. Non-USD fund cash flows and residual values are converted to USD using the spot rate as of the reporting date. In addition, gross IRRs at the fund level will differ from those at the individual investor level as a result of, among other factors, timing of investor-level inflows and outflows. Gross IRR does not represent the return to any fund investor. “Gross MOIC” means, with respect to a given investment, fund, or the infrastructure performance metrics, the ratio of Total Value to Total Invested Capital. As used in this definition: • “Realized Value” refers to all cash investment proceeds received by the relevant Apollo Fund, including interest and dividends, but does not give effect to management fees, expenses, incentive compensation or performance fees to be paid by such Apollo Fund. • “Total Invested Capital” refers to the aggregate cash invested by the relevant Apollo Fund and includes capitalized costs relating to investment activities, if any, but does not give effect to cash pending investment or available for reserves and excludes amounts, if any, invested on a financed basis with leverage facilities. • “Total Value” represents the sum of the total Realized Value and Unrealized Value of investments. • “Unrealized Value” refers to the fair value consistent with valuations determined in accordance with generally accepted accounting principles in the United States of America (“U.S. GAAP”), for investments not yet realized and may include payments in kind, accrued interest and dividends receivable, if any, and before the effect of certain taxes. In addition, amounts include committed and funded amounts for certain investments. “Gross Return” of a yield fund is the monthly or quarterly time-weighted return that is equal to the percentage change in the value of a fund’s portfolio, adjusted for all contributions and withdrawals (cash flows) before the effects of management fees, incentive fees allocated to the general partner, or other fees and expenses. Returns for yield funds are calculated for all funds and accounts in the respective strategies excluding assets for Athene, Athora and certain other entities where Apollo manages or may manage a significant portion of the total company assets. Returns of CLOs represent the gross returns on assets. Returns over multiple periods are calculated by geometrically linking each period’s return over time. APOLLO INVESTOR DAY 2021
Definitions “Inflows” represents (i) at the individual segment level, subscriptions, commitments, and other increases in available capital, such as acquisitions or leverage, net of inter-segment transfers, and (ii) on an aggregate basis, the sum of inflows across the yield, equity and hybrid business strategies. “Net IRR” of Accord Series, Structured Credit Recovery and the European Principal Finance funds represents the annualized return of a fund after management fees, performance fees allocated to the general partner and certain other expenses, calculated on investors that pay such fees. The terminal value is the net asset value as of the reporting date. Non-USD fund cash flows and residual values are converted to USD using the spot rate as of the reporting date. In addition, net IRR at the fund level will differ from that at the individual investor level as a result of, among other factors, timing of investor-level inflows and outflows. Net IRR does not represent the return to any fund investor. “Net IRR” of Flagship Private Equity and Hybrid Value Fund means the gross IRR applicable to the funds, including returns for related parties which may not pay fees or performance fees, net of management fees, certain expenses (including interest incurred or earned by the fund itself) and realized performance fees all offset to the extent of interest income, and measures returns at the fund level on amounts that, if distributed, would be paid to investors of the fund. The timing of cash flows applicable to investments, management fees and certain expenses, may be adjusted for the usage of a fund’s subscription facility. To the extent that a fund exceeds all requirements detailed within the applicable fund agreement, the estimated unrealized value is adjusted such that a percentage of up to 20.0% of the unrealized gain is allocated to the general partner of such fund, thereby reducing the balance attributable to fund investors. In addition, net IRR at the fund level will differ from that at the individual investor level as a result of, among other factors, timing of investor-level inflows and outflows. Net IRR does not represent the return to any fund investor. “Net IRR” of Real Estate Equity, Hybrid Real Estate and Infrastructure represents the cumulative cash flows in the fund (and not any one investor in the fund), on the basis of the actual timing of cash inflows received from and outflows paid to investors of the fund (assuming the ending net asset value as of June 30, 2021 or other date specified is paid to investors), excluding certain non-fee and non-performance fee bearing parties, and the return is annualized and compounded after management fees, performance fees, and certain other expenses (including interest incurred by the fund itself) and measures the returns to investors of the fund as a whole. Non-USD fund cash flows and residual values are converted to USD using the spot rate as of the reporting date. In addition, net IRR at the fund level will differ from that at the individual investor level as a result of, among other factors, timing of investor-level inflows and outflows. Net IRR does not represent the return to any fund investor. “Permanent Capital” means capital of indefinite duration, which may be withdrawn under certain conditions. “Permanent Capital Vehicles” refers to (a) assets that are owned by or related to Athene or Athora Holding Ltd. (“Athora Holding” and together with its subsidiaries, “Athora”), (b) assets that are owned by or related to MidCap FinCo Designated Activity Company (“MidCap”) and managed by Apollo, (c) assets of publicly traded vehicles managed by Apollo such as Apollo Investment Corporation (“AINV”), Apollo Commercial Real Estate Finance, Inc. (“ARI”), Apollo Tactical Income Fund Inc. (“AIF”), and Apollo Senior Floating Rate Fund Inc. (“AFT”), in each case that do not have redemption provisions or a requirement to return capital to investors upon exiting the investments made with such capital, except as required by applicable law and (d) a non- traded business development company from which Apollo earns certain investment-related service fees. The investment management agreements of AINV, AIF and AFT have one year terms, are reviewed annually and remain in effect only if approved by the boards of directors of such companies or by the affirmative vote of the holders of a majority of the outstanding voting shares of such companies, including in either case, approval by a majority of the directors who are not “interested persons” as defined in the Investment Company Act of 1940. In addition, the investment management agreements of AINV, AIF and AFT may be terminated in certain circumstances upon 60 days’ written notice. The investment management agreement of ARI has a one year term and is reviewed annually by ARI’s board of directors and may be terminated under certain circumstances by an affirmative vote of at least two-thirds of ARI’s independent directors. The investment management or advisory arrangements between each of MidCap and Apollo, Athene and Apollo and Athora and Apollo, may also be terminated under certain circumstances. The agreement pursuant to which Apollo earns certain investment-related service fees from a non-traded business development company may be terminated under certain limited circumstances. “Redding Ridge” refers to Redding Ridge Asset Management, LLC and its subsidiaries, which is a standalone, self-managed asset management business established in connection with risk retention rules that manages CLOs and retains the required risk retention interests. “Vintage Year” refers to the year in which a fund’s final capital raise occurred, or, for certain funds, the year of a fund’s effective date or the year in which a fund’s investment period commences pursuant to its governing agreements. APOLLO INVESTOR DAY 2021Definitions “Inflows” represents (i) at the individual segment level, subscriptions, commitments, and other increases in available capital, such as acquisitions or leverage, net of inter-segment transfers, and (ii) on an aggregate basis, the sum of inflows across the yield, equity and hybrid business strategies. “Net IRR” of Accord Series, Structured Credit Recovery and the European Principal Finance funds represents the annualized return of a fund after management fees, performance fees allocated to the general partner and certain other expenses, calculated on investors that pay such fees. The terminal value is the net asset value as of the reporting date. Non-USD fund cash flows and residual values are converted to USD using the spot rate as of the reporting date. In addition, net IRR at the fund level will differ from that at the individual investor level as a result of, among other factors, timing of investor-level inflows and outflows. Net IRR does not represent the return to any fund investor. “Net IRR” of Flagship Private Equity and Hybrid Value Fund means the gross IRR applicable to the funds, including returns for related parties which may not pay fees or performance fees, net of management fees, certain expenses (including interest incurred or earned by the fund itself) and realized performance fees all offset to the extent of interest income, and measures returns at the fund level on amounts that, if distributed, would be paid to investors of the fund. The timing of cash flows applicable to investments, management fees and certain expenses, may be adjusted for the usage of a fund’s subscription facility. To the extent that a fund exceeds all requirements detailed within the applicable fund agreement, the estimated unrealized value is adjusted such that a percentage of up to 20.0% of the unrealized gain is allocated to the general partner of such fund, thereby reducing the balance attributable to fund investors. In addition, net IRR at the fund level will differ from that at the individual investor level as a result of, among other factors, timing of investor-level inflows and outflows. Net IRR does not represent the return to any fund investor. “Net IRR” of Real Estate Equity, Hybrid Real Estate and Infrastructure represents the cumulative cash flows in the fund (and not any one investor in the fund), on the basis of the actual timing of cash inflows received from and outflows paid to investors of the fund (assuming the ending net asset value as of June 30, 2021 or other date specified is paid to investors), excluding certain non-fee and non-performance fee bearing parties, and the return is annualized and compounded after management fees, performance fees, and certain other expenses (including interest incurred by the fund itself) and measures the returns to investors of the fund as a whole. Non-USD fund cash flows and residual values are converted to USD using the spot rate as of the reporting date. In addition, net IRR at the fund level will differ from that at the individual investor level as a result of, among other factors, timing of investor-level inflows and outflows. Net IRR does not represent the return to any fund investor. “Permanent Capital” means capital of indefinite duration, which may be withdrawn under certain conditions. “Permanent Capital Vehicles” refers to (a) assets that are owned by or related to Athene or Athora Holding Ltd. (“Athora Holding” and together with its subsidiaries, “Athora”), (b) assets that are owned by or related to MidCap FinCo Designated Activity Company (“MidCap”) and managed by Apollo, (c) assets of publicly traded vehicles managed by Apollo such as Apollo Investment Corporation (“AINV”), Apollo Commercial Real Estate Finance, Inc. (“ARI”), Apollo Tactical Income Fund Inc. (“AIF”), and Apollo Senior Floating Rate Fund Inc. (“AFT”), in each case that do not have redemption provisions or a requirement to return capital to investors upon exiting the investments made with such capital, except as required by applicable law and (d) a non- traded business development company from which Apollo earns certain investment-related service fees. The investment management agreements of AINV, AIF and AFT have one year terms, are reviewed annually and remain in effect only if approved by the boards of directors of such companies or by the affirmative vote of the holders of a majority of the outstanding voting shares of such companies, including in either case, approval by a majority of the directors who are not “interested persons” as defined in the Investment Company Act of 1940. In addition, the investment management agreements of AINV, AIF and AFT may be terminated in certain circumstances upon 60 days’ written notice. The investment management agreement of ARI has a one year term and is reviewed annually by ARI’s board of directors and may be terminated under certain circumstances by an affirmative vote of at least two-thirds of ARI’s independent directors. The investment management or advisory arrangements between each of MidCap and Apollo, Athene and Apollo and Athora and Apollo, may also be terminated under certain circumstances. The agreement pursuant to which Apollo earns certain investment-related service fees from a non-traded business development company may be terminated under certain limited circumstances. “Redding Ridge” refers to Redding Ridge Asset Management, LLC and its subsidiaries, which is a standalone, self-managed asset management business established in connection with risk retention rules that manages CLOs and retains the required risk retention interests. “Vintage Year” refers to the year in which a fund’s final capital raise occurred, or, for certain funds, the year of a fund’s effective date or the year in which a fund’s investment period commences pursuant to its governing agreements. APOLLO INVESTOR DAY 2021
Non-GAAP Financial Information & Definitions (Athene) In addition to our results presented in accordance with GAAP, we present certain financial information that includes non-GAAP measures. Management believes the use of these non-GAAP measures, together with the relevant GAAP measures, provides information that may enhance an investor’s understanding of our results of operations and the underlying profitability drivers of our business. The majority of these non-GAAP measures are intended to remove from the results of operations the impact of market volatility (other than with respect to alternative investments) as well as integration, restructuring and certain other expenses which are not part of our underlying profitability drivers, as such items fluctuate from period to period in a manner inconsistent with these drivers. These measures should be considered supplementary to our results in accordance with GAAP and should not be viewed as a substitute for the corresponding GAAP measures. Adjusted Operating Income (Loss) Available to Common Shareholders Adjusted operating income (loss) available to common shareholders is a non-GAAP measure used to evaluate our financial performance excluding market volatility and expenses related to integration, restructuring, stock compensation and other expenses. Our adjusted operating income (loss) available to common shareholders equals net income (loss) available to AHL common shareholders adjusted to eliminate the impact of the following (collectively, the non-operating adjustments): • Investment Gains (Losses), Net of Offsets—Consists of the realized gains and losses on the sale of AFS securities, the change in fair value of reinsurance assets, unrealized gains and losses, changes in the credit loss allowance, and other investment gains and losses. Unrealized, allowances and other investment gains and losses are comprised of the fair value adjustments of trading securities (other than CLOs) and investments held under the fair value option, derivative gains and losses not hedging FIA index credits, and the change in credit loss allowances recognized in operations net of the change in AmerUs Closed Block fair value reserve related to the corresponding change in fair value of investments. Investment gains and losses are net of offsets related to DAC, DSI, and VOBA amortization and changes to guaranteed lifetime withdrawal benefit (GLWB) and guaranteed minimum death benefit (GMDB) reserves (together, GLWB and GMDB reserves represent rider reserves) as well as the market value adjustments (MVA) associated with surrenders or terminations of contracts. • Change in Fair Values of Derivatives and Embedded Derivatives – FIAs, Net of Offsets—Consists of impacts related to the fair value accounting for derivatives hedging the FIA index credits and the related embedded derivative liability fluctuations from period to period. The index reserve is measured at fair value for the current period and all periods beyond the current policyholder index term. However, the FIA hedging derivatives are purchased to hedge only the current index period. Upon policyholder renewal at the end of the period, new FIA hedging derivatives are purchased to align with the new term. The difference in duration between the FIA hedging derivatives and the index credit reserves creates a timing difference in earnings. This timing difference of the FIA hedging derivatives and index credit reserves is included as a non-operating adjustment, net of offsets related to DAC, DSI, and VOBA amortization and changes to rider reserves. We primarily hedge with options that align with the index terms of our FIA products (typically 1–2 years). On an economic basis, we believe this is suitable because policyholder accounts are credited with index performance at the end of each index term. However, because the term of an embedded derivative in an FIA contract is longer-dated, there is a duration mismatch which may lead to mismatches for accounting purposes. • Integration, Restructuring, and Other Non-operating Expenses—Consists of restructuring and integration expenses related to acquisitions and block reinsurance costs as well as certain other expenses, which are not predictable or related to our underlying profitability drivers. • Stock Compensation Expense—Consists of stock compensation expenses associated with our share incentive plans, excluding our long-term incentive plan, which are not related to our underlying profitability drivers and fluctuate from time to time due to the structure of our plans. • Income Tax (Expense) Benefit – Non-operating—Consists of the income tax effect of non-operating adjustments and is computed by applying the appropriate jurisdiction’s tax rate to the non-operating adjustments that are subject to income tax. We consider these non-operating adjustments to be meaningful adjustments to net income (loss) available to AHL common shareholders for the reasons discussed in greater detail above. Accordingly, we believe using a measure which excludes the impact of these items is useful in analyzing our business performance and the trends in our results of operations. Together with net income (loss) available to AHL common shareholders, we believe adjusted operating income (loss) available to common shareholders provides a meaningful financial metric that helps investors understand our underlying results and profitability. Adjusted operating income (loss) available to common shareholders should not be used as a substitute for net income (loss) available to AHL common shareholders. APOLLO INVESTOR DAY 2021Non-GAAP Financial Information & Definitions (Athene) In addition to our results presented in accordance with GAAP, we present certain financial information that includes non-GAAP measures. Management believes the use of these non-GAAP measures, together with the relevant GAAP measures, provides information that may enhance an investor’s understanding of our results of operations and the underlying profitability drivers of our business. The majority of these non-GAAP measures are intended to remove from the results of operations the impact of market volatility (other than with respect to alternative investments) as well as integration, restructuring and certain other expenses which are not part of our underlying profitability drivers, as such items fluctuate from period to period in a manner inconsistent with these drivers. These measures should be considered supplementary to our results in accordance with GAAP and should not be viewed as a substitute for the corresponding GAAP measures. Adjusted Operating Income (Loss) Available to Common Shareholders Adjusted operating income (loss) available to common shareholders is a non-GAAP measure used to evaluate our financial performance excluding market volatility and expenses related to integration, restructuring, stock compensation and other expenses. Our adjusted operating income (loss) available to common shareholders equals net income (loss) available to AHL common shareholders adjusted to eliminate the impact of the following (collectively, the non-operating adjustments): • Investment Gains (Losses), Net of Offsets—Consists of the realized gains and losses on the sale of AFS securities, the change in fair value of reinsurance assets, unrealized gains and losses, changes in the credit loss allowance, and other investment gains and losses. Unrealized, allowances and other investment gains and losses are comprised of the fair value adjustments of trading securities (other than CLOs) and investments held under the fair value option, derivative gains and losses not hedging FIA index credits, and the change in credit loss allowances recognized in operations net of the change in AmerUs Closed Block fair value reserve related to the corresponding change in fair value of investments. Investment gains and losses are net of offsets related to DAC, DSI, and VOBA amortization and changes to guaranteed lifetime withdrawal benefit (GLWB) and guaranteed minimum death benefit (GMDB) reserves (together, GLWB and GMDB reserves represent rider reserves) as well as the market value adjustments (MVA) associated with surrenders or terminations of contracts. • Change in Fair Values of Derivatives and Embedded Derivatives – FIAs, Net of Offsets—Consists of impacts related to the fair value accounting for derivatives hedging the FIA index credits and the related embedded derivative liability fluctuations from period to period. The index reserve is measured at fair value for the current period and all periods beyond the current policyholder index term. However, the FIA hedging derivatives are purchased to hedge only the current index period. Upon policyholder renewal at the end of the period, new FIA hedging derivatives are purchased to align with the new term. The difference in duration between the FIA hedging derivatives and the index credit reserves creates a timing difference in earnings. This timing difference of the FIA hedging derivatives and index credit reserves is included as a non-operating adjustment, net of offsets related to DAC, DSI, and VOBA amortization and changes to rider reserves. We primarily hedge with options that align with the index terms of our FIA products (typically 1–2 years). On an economic basis, we believe this is suitable because policyholder accounts are credited with index performance at the end of each index term. However, because the term of an embedded derivative in an FIA contract is longer-dated, there is a duration mismatch which may lead to mismatches for accounting purposes. • Integration, Restructuring, and Other Non-operating Expenses—Consists of restructuring and integration expenses related to acquisitions and block reinsurance costs as well as certain other expenses, which are not predictable or related to our underlying profitability drivers. • Stock Compensation Expense—Consists of stock compensation expenses associated with our share incentive plans, excluding our long-term incentive plan, which are not related to our underlying profitability drivers and fluctuate from time to time due to the structure of our plans. • Income Tax (Expense) Benefit – Non-operating—Consists of the income tax effect of non-operating adjustments and is computed by applying the appropriate jurisdiction’s tax rate to the non-operating adjustments that are subject to income tax. We consider these non-operating adjustments to be meaningful adjustments to net income (loss) available to AHL common shareholders for the reasons discussed in greater detail above. Accordingly, we believe using a measure which excludes the impact of these items is useful in analyzing our business performance and the trends in our results of operations. Together with net income (loss) available to AHL common shareholders, we believe adjusted operating income (loss) available to common shareholders provides a meaningful financial metric that helps investors understand our underlying results and profitability. Adjusted operating income (loss) available to common shareholders should not be used as a substitute for net income (loss) available to AHL common shareholders. APOLLO INVESTOR DAY 2021
Non-GAAP Financial Information & Definitions (Athene) Cont’d Adjusted Operating ROE Adjusted operating ROE is a non-GAAP measure used to evaluate our financial performance excluding the impacts of AOCI and the cumulative change in fair value of funds withheld and modco reinsurance assets, net of DAC, DSI, rider reserve and tax offsets. Adjusted AHL common shareholders’ equity is calculated as the ending AHL shareholders’ equity excluding AOCI, the cumulative change in fair value of funds withheld and modco reinsurance assets and preferred stock. Adjusted operating ROE is calculated as the adjusted operating income (loss) available to common shareholders, divided by average adjusted AHL common shareholders’ equity. These adjustments fluctuate period to period in a manner inconsistent with our underlying profitability drivers as the majority of such fluctuation is related to the market volatility of the unrealized gains and losses associated with our AFS securities. Except with respect to reinvestment activity relating to acquired blocks of businesses, we typically buy and hold AFS investments to maturity throughout the duration of market fluctuations, therefore, the period-over-period impacts in unrealized gains and losses are not necessarily indicative of current operating fundamentals or future performance. Accordingly, we believe using measures which exclude AOCI and the cumulative change in fair value of funds withheld and modco reinsurance assets are useful in analyzing trends in our operating results. To enhance the ability to analyze these measures across periods, interim periods are annualized. Adjusted operating ROE should not be used as a substitute for ROE. However, we believe the adjustments to net income (loss) available to AHL common shareholders and AHL common shareholders’ equity are significant to gaining an understanding of our overall financial performance. Invested Assets In managing our business, we analyze net invested assets, which does not correspond to total investments, including investments in related parties, as disclosed in our consolidated financial statements and notes thereto. Net invested assets represents the investments that directly back our net reserve liabilities as well as surplus assets. Net invested assets, excluding our investment in Apollo, is used in the computation of net investment earned rate, which allows us to analyze the profitability of our investment portfolio. Net invested assets includes (a) total investments on the consolidated balance sheets with AFS securities at cost or amortized cost, excluding derivatives, (b) cash and cash equivalents and restricted cash, (c) investments in related parties, (d) accrued investment income, (e) VIE assets, liabilities and noncontrolling interest adjustments, (f) net investment payables and receivables, (g) policy loans ceded (which offset the direct policy loans in total investments) and (h) an allowance for credit losses. Net invested assets also excludes assets associated with funds withheld liabilities related to business exited through reinsurance agreements and derivative collateral (offsetting the related cash positions). We include the underlying investments supporting our assumed funds withheld and modco agreements in our net invested assets calculation in order to match the assets with the income received. We believe the adjustments for reinsurance provide a view of the assets for which we have economic exposure. Net invested assets includes our proportionate share of ACRA investments, based on our economic ownership, but does not include the proportionate share of investments associated with the noncontrolling interest. Net invested assets also includes our investment in Apollo. Our net invested assets, excluding our investment in Apollo, are averaged over the number of quarters in the relevant period to compute our net investment earned rate for such period. While we believe net invested assets is a meaningful financial metric and enhances our understanding of the underlying drivers of our investment portfolio, it should not be used as a substitute for total investments, including related parties, presented under GAAP. Reserve Liabilities In managing our business, we also analyze net reserve liabilities, which does not correspond to total liabilities as disclosed in our consolidated financial statements and notes thereto. Net reserve liabilities represent our policyholder liability obligations net of reinsurance and is used to analyze the costs of our liabilities. Net reserve liabilities include (a) the interest sensitive contract liabilities, (b) future policy benefits, (c) dividends payable to policyholders, and (d) other policy claims and benefits, offset by reinsurance recoverable, excluding policy loans ceded. Net reserve liabilities include our proportionate share of ACRA reserve liabilities, based on our economic ownership, but does not include the proportionate share of reserve liabilities associated with the noncontrolling interest. Net reserve liabilities is net of the ceded liabilities to third-party reinsurers as the costs of the liabilities are passed to such reinsurers and, therefore, we have no net economic exposure to such liabilities, assuming our reinsurance counterparties perform under our agreements. The majority of our ceded reinsurance is a result of reinsuring large blocks of life business following acquisitions. For such transactions, GAAP requires the ceded liabilities and related reinsurance recoverables to continue to be recorded in our consolidated financial statements despite the transfer of economic risk to the counterparty in connection with the reinsurance transaction. While we believe net reserve liabilities is a meaningful financial metric and enhances our understanding of the underlying profitability drivers of our business, it should not be used as a substitute for total liabilities presented under GAAP. Sales Sales statistics do not correspond to revenues under GAAP but are used as relevant measures to understand our business performance as it relates to inflows generated during a specific period of time. Our sales statistics include inflows for fixed rate annuities and FIAs and align with the LIMRA definition of all money paid into an individual annuity, including money paid into new contracts with initial purchase occurring in the specified period and existing contracts with initial purchase occurring prior to the specified period (excluding internal transfers). While we believe sales is a meaningful metric and enhances our understanding of our business performance, it should not be used as a substitute for premiums presented under GAAP. APOLLO INVESTOR DAY 2021Non-GAAP Financial Information & Definitions (Athene) Cont’d Adjusted Operating ROE Adjusted operating ROE is a non-GAAP measure used to evaluate our financial performance excluding the impacts of AOCI and the cumulative change in fair value of funds withheld and modco reinsurance assets, net of DAC, DSI, rider reserve and tax offsets. Adjusted AHL common shareholders’ equity is calculated as the ending AHL shareholders’ equity excluding AOCI, the cumulative change in fair value of funds withheld and modco reinsurance assets and preferred stock. Adjusted operating ROE is calculated as the adjusted operating income (loss) available to common shareholders, divided by average adjusted AHL common shareholders’ equity. These adjustments fluctuate period to period in a manner inconsistent with our underlying profitability drivers as the majority of such fluctuation is related to the market volatility of the unrealized gains and losses associated with our AFS securities. Except with respect to reinvestment activity relating to acquired blocks of businesses, we typically buy and hold AFS investments to maturity throughout the duration of market fluctuations, therefore, the period-over-period impacts in unrealized gains and losses are not necessarily indicative of current operating fundamentals or future performance. Accordingly, we believe using measures which exclude AOCI and the cumulative change in fair value of funds withheld and modco reinsurance assets are useful in analyzing trends in our operating results. To enhance the ability to analyze these measures across periods, interim periods are annualized. Adjusted operating ROE should not be used as a substitute for ROE. However, we believe the adjustments to net income (loss) available to AHL common shareholders and AHL common shareholders’ equity are significant to gaining an understanding of our overall financial performance. Invested Assets In managing our business, we analyze net invested assets, which does not correspond to total investments, including investments in related parties, as disclosed in our consolidated financial statements and notes thereto. Net invested assets represents the investments that directly back our net reserve liabilities as well as surplus assets. Net invested assets, excluding our investment in Apollo, is used in the computation of net investment earned rate, which allows us to analyze the profitability of our investment portfolio. Net invested assets includes (a) total investments on the consolidated balance sheets with AFS securities at cost or amortized cost, excluding derivatives, (b) cash and cash equivalents and restricted cash, (c) investments in related parties, (d) accrued investment income, (e) VIE assets, liabilities and noncontrolling interest adjustments, (f) net investment payables and receivables, (g) policy loans ceded (which offset the direct policy loans in total investments) and (h) an allowance for credit losses. Net invested assets also excludes assets associated with funds withheld liabilities related to business exited through reinsurance agreements and derivative collateral (offsetting the related cash positions). We include the underlying investments supporting our assumed funds withheld and modco agreements in our net invested assets calculation in order to match the assets with the income received. We believe the adjustments for reinsurance provide a view of the assets for which we have economic exposure. Net invested assets includes our proportionate share of ACRA investments, based on our economic ownership, but does not include the proportionate share of investments associated with the noncontrolling interest. Net invested assets also includes our investment in Apollo. Our net invested assets, excluding our investment in Apollo, are averaged over the number of quarters in the relevant period to compute our net investment earned rate for such period. While we believe net invested assets is a meaningful financial metric and enhances our understanding of the underlying drivers of our investment portfolio, it should not be used as a substitute for total investments, including related parties, presented under GAAP. Reserve Liabilities In managing our business, we also analyze net reserve liabilities, which does not correspond to total liabilities as disclosed in our consolidated financial statements and notes thereto. Net reserve liabilities represent our policyholder liability obligations net of reinsurance and is used to analyze the costs of our liabilities. Net reserve liabilities include (a) the interest sensitive contract liabilities, (b) future policy benefits, (c) dividends payable to policyholders, and (d) other policy claims and benefits, offset by reinsurance recoverable, excluding policy loans ceded. Net reserve liabilities include our proportionate share of ACRA reserve liabilities, based on our economic ownership, but does not include the proportionate share of reserve liabilities associated with the noncontrolling interest. Net reserve liabilities is net of the ceded liabilities to third-party reinsurers as the costs of the liabilities are passed to such reinsurers and, therefore, we have no net economic exposure to such liabilities, assuming our reinsurance counterparties perform under our agreements. The majority of our ceded reinsurance is a result of reinsuring large blocks of life business following acquisitions. For such transactions, GAAP requires the ceded liabilities and related reinsurance recoverables to continue to be recorded in our consolidated financial statements despite the transfer of economic risk to the counterparty in connection with the reinsurance transaction. While we believe net reserve liabilities is a meaningful financial metric and enhances our understanding of the underlying profitability drivers of our business, it should not be used as a substitute for total liabilities presented under GAAP. Sales Sales statistics do not correspond to revenues under GAAP but are used as relevant measures to understand our business performance as it relates to inflows generated during a specific period of time. Our sales statistics include inflows for fixed rate annuities and FIAs and align with the LIMRA definition of all money paid into an individual annuity, including money paid into new contracts with initial purchase occurring in the specified period and existing contracts with initial purchase occurring prior to the specified period (excluding internal transfers). While we believe sales is a meaningful metric and enhances our understanding of our business performance, it should not be used as a substitute for premiums presented under GAAP. APOLLO INVESTOR DAY 2021
Non-GAAP Financial Information & Definitions (Athene) Cont’d Adjusted Operating ROA Adjusted operating ROA is a non-GAAP measure used to evaluate our financial performance and profitability. Adjusted operating ROA is computed using our adjusted operating income (loss) available to common shareholders divided by average net invested assets for the relevant period. To enhance the ability to analyze this measure across periods, interim periods are annualized. While we believe this metric is a meaningful financial metric and enhances our understanding of the underlying profitability drivers of our business, it should not be used as a substitute for ROA presented under GAAP. Net Investment Spread, Investment Margin on Deferred Annuities and Operating Expenses Net investment spread is a key measure of profitability. Net investment spread measures our investment performance less the total cost of our liabilities. Net investment earned rate is a key measure of our investment performance, while cost of funds is a key measure of the cost of our policyholder benefits and liabilities. Investment margin on our deferred annuities measures our investment performance less the cost of crediting for our deferred annuities, which make up a significant portion of our net reserve liabilities. Net investment earned rate is a non-GAAP measure we use to evaluate the performance of our net invested assets that does not correspond to GAAP net investment income. Net investment earned rate is computed as the income from our net invested assets divided by the average net invested assets, excluding the impacts of our investment in Apollo, for the relevant period. To enhance the ability to analyze these measures across periods, interim periods are annualized. The adjustments to net investment income to arrive at our net investment earned rate add (a) alternative investment gains and losses, (b) gains and losses related to trading securities for CLOs, (c) net VIE impacts (revenues, expenses and noncontrolling interest), (d) forward points gains and losses on foreign exchange derivative hedges and (e) the change in fair value of reinsurance assets, and removes the proportionate share of the ACRA net investment income associated with the ACRA noncontrolling interest as well as the gain or loss on our investment in Apollo. We include the income and assets supporting our change in fair value of reinsurance assets by evaluating the underlying investments of the funds withheld at interest receivables and we include the net investment income from those underlying investments which does not correspond to the GAAP presentation of change in fair value of reinsurance assets. We exclude the income and assets supporting business that we have exited through ceded reinsurance including funds withheld agreements. We believe the adjustments for reinsurance provide a net investment earned rate on the assets for which we have economic exposure. Cost of funds includes liability costs related to cost of crediting on both deferred annuities and institutional products as well as other liability costs, but does not include the proportionate share of the ACRA cost of funds associated with the noncontrolling interest. Cost of funds is computed as the total liability costs divided by the average net invested assets, excluding our investment in Apollo, for the relevant period. To enhance the ability to analyze these measures across periods, interim periods are annualized. Cost of crediting includes the costs for both deferred annuities and institutional products. Cost of crediting on deferred annuities is the interest credited to the policyholders on our fixed strategies as well as the option costs on the indexed annuity strategies. With respect to FIAs, the cost of providing index credits includes the expenses incurred to fund the annual index credits, and where applicable, minimum guaranteed interest credited. Cost of crediting on institutional products is comprised of (i) PRT costs, including interest credited, benefit payments and other reserve changes, net of premiums received when issued, and (ii) funding agreement costs, including the interest payments and other reserve changes. Cost of crediting is computed as the cost of crediting for deferred annuities and institutional products divided by the average net invested assets, excluding the investment in Apollo, for the relevant periods. Cost of crediting on deferred annuities is computed as the net interest credited on fixed strategies and option costs on indexed annuity strategies divided by the average net account value of our deferred annuities. Cost of crediting on institutional products is computed as the PRT and funding agreement costs divided by the average net institutional reserve liabilities. Our average net invested assets, excluding our investment in Apollo, net account values and net institutional reserve liabilities are averaged over the number of quarters in the relevant period to obtain our associated cost of crediting for such period. To enhance the ability to analyze these measures across periods, interim periods are annualized. Other liability costs include DAC, DSI and VOBA amortization, change in rider reserves, the cost of liabilities on products other than deferred annuities and institutional products, excise taxes, premiums, product charges and other revenues. We believe a measure like other liability costs is useful in analyzing the trends of our core business operations and profitability. While we believe other liability costs is a meaningful financial metric and enhances our understanding of the underlying profitability drivers of our business, it should not be used as a substitute for total benefits and expenses presented under GAAP. Net investment earned rate, cost of funds, net investment spread and investment margin on deferred annuities are non-GAAP measures we use to evaluate the profitability of our business. We believe these metrics are useful in analyzing the trends of our business operations, profitability and pricing discipline. While we believe each of these metrics are meaningful financial metrics and enhance our understanding of the underlying profitability drivers of our business, they should not be used as a substitute for net investment income, interest sensitive contract benefits or total benefits and expenses presented under GAAP. Operating expenses excludes integration, restructuring and other non-operating expenses, stock compensation expense, interest expense and policy acquisition expenses. We believe a measure like operating expenses is useful in analyzing the trends of our core business operations and profitability. While we believe operating expenses is a meaningful financial metric and enhances our understanding of the underlying profitability drivers of our business, it should not be used as a substitute for policy and other operating expenses presented under GAAP. APOLLO INVESTOR DAY 2021Non-GAAP Financial Information & Definitions (Athene) Cont’d Adjusted Operating ROA Adjusted operating ROA is a non-GAAP measure used to evaluate our financial performance and profitability. Adjusted operating ROA is computed using our adjusted operating income (loss) available to common shareholders divided by average net invested assets for the relevant period. To enhance the ability to analyze this measure across periods, interim periods are annualized. While we believe this metric is a meaningful financial metric and enhances our understanding of the underlying profitability drivers of our business, it should not be used as a substitute for ROA presented under GAAP. Net Investment Spread, Investment Margin on Deferred Annuities and Operating Expenses Net investment spread is a key measure of profitability. Net investment spread measures our investment performance less the total cost of our liabilities. Net investment earned rate is a key measure of our investment performance, while cost of funds is a key measure of the cost of our policyholder benefits and liabilities. Investment margin on our deferred annuities measures our investment performance less the cost of crediting for our deferred annuities, which make up a significant portion of our net reserve liabilities. Net investment earned rate is a non-GAAP measure we use to evaluate the performance of our net invested assets that does not correspond to GAAP net investment income. Net investment earned rate is computed as the income from our net invested assets divided by the average net invested assets, excluding the impacts of our investment in Apollo, for the relevant period. To enhance the ability to analyze these measures across periods, interim periods are annualized. The adjustments to net investment income to arrive at our net investment earned rate add (a) alternative investment gains and losses, (b) gains and losses related to trading securities for CLOs, (c) net VIE impacts (revenues, expenses and noncontrolling interest), (d) forward points gains and losses on foreign exchange derivative hedges and (e) the change in fair value of reinsurance assets, and removes the proportionate share of the ACRA net investment income associated with the ACRA noncontrolling interest as well as the gain or loss on our investment in Apollo. We include the income and assets supporting our change in fair value of reinsurance assets by evaluating the underlying investments of the funds withheld at interest receivables and we include the net investment income from those underlying investments which does not correspond to the GAAP presentation of change in fair value of reinsurance assets. We exclude the income and assets supporting business that we have exited through ceded reinsurance including funds withheld agreements. We believe the adjustments for reinsurance provide a net investment earned rate on the assets for which we have economic exposure. Cost of funds includes liability costs related to cost of crediting on both deferred annuities and institutional products as well as other liability costs, but does not include the proportionate share of the ACRA cost of funds associated with the noncontrolling interest. Cost of funds is computed as the total liability costs divided by the average net invested assets, excluding our investment in Apollo, for the relevant period. To enhance the ability to analyze these measures across periods, interim periods are annualized. Cost of crediting includes the costs for both deferred annuities and institutional products. Cost of crediting on deferred annuities is the interest credited to the policyholders on our fixed strategies as well as the option costs on the indexed annuity strategies. With respect to FIAs, the cost of providing index credits includes the expenses incurred to fund the annual index credits, and where applicable, minimum guaranteed interest credited. Cost of crediting on institutional products is comprised of (i) PRT costs, including interest credited, benefit payments and other reserve changes, net of premiums received when issued, and (ii) funding agreement costs, including the interest payments and other reserve changes. Cost of crediting is computed as the cost of crediting for deferred annuities and institutional products divided by the average net invested assets, excluding the investment in Apollo, for the relevant periods. Cost of crediting on deferred annuities is computed as the net interest credited on fixed strategies and option costs on indexed annuity strategies divided by the average net account value of our deferred annuities. Cost of crediting on institutional products is computed as the PRT and funding agreement costs divided by the average net institutional reserve liabilities. Our average net invested assets, excluding our investment in Apollo, net account values and net institutional reserve liabilities are averaged over the number of quarters in the relevant period to obtain our associated cost of crediting for such period. To enhance the ability to analyze these measures across periods, interim periods are annualized. Other liability costs include DAC, DSI and VOBA amortization, change in rider reserves, the cost of liabilities on products other than deferred annuities and institutional products, excise taxes, premiums, product charges and other revenues. We believe a measure like other liability costs is useful in analyzing the trends of our core business operations and profitability. While we believe other liability costs is a meaningful financial metric and enhances our understanding of the underlying profitability drivers of our business, it should not be used as a substitute for total benefits and expenses presented under GAAP. Net investment earned rate, cost of funds, net investment spread and investment margin on deferred annuities are non-GAAP measures we use to evaluate the profitability of our business. We believe these metrics are useful in analyzing the trends of our business operations, profitability and pricing discipline. While we believe each of these metrics are meaningful financial metrics and enhance our understanding of the underlying profitability drivers of our business, they should not be used as a substitute for net investment income, interest sensitive contract benefits or total benefits and expenses presented under GAAP. Operating expenses excludes integration, restructuring and other non-operating expenses, stock compensation expense, interest expense and policy acquisition expenses. We believe a measure like operating expenses is useful in analyzing the trends of our core business operations and profitability. While we believe operating expenses is a meaningful financial metric and enhances our understanding of the underlying profitability drivers of our business, it should not be used as a substitute for policy and other operating expenses presented under GAAP. APOLLO INVESTOR DAY 2021
Non-GAAP Financial Information & Definitions (Athene) Cont’d Adjusted Operating Common Shares Outstanding and Adjusted Book Value Per Common Share Adjusted operating common shares outstanding and adjusted book value per common share are non-GAAP measures used to evaluate our financial performance and financial condition. The non-GAAP measures adjust the number of shares included in the corresponding GAAP measures to reflect the conversion or settlement of all shares and other stock-based awards outstanding. We believe these measures represent an economic view of our share counts and provide a simplified and consistent view of our outstanding shares. Adjusted book value per common share is calculated as the adjusted AHL common shareholders’ equity divided by the adjusted operating common shares outstanding. Effective February 28, 2020, all Class B common shares were converted into Class A common shares and all Class M common shares were converted into warrants and Class A common shares. Our Class B common shares were economically equivalent to Class A common shares and were convertible to Class A common shares on a one-for-one basis at any time. Our Class M common shares were in the legal form of shares but economically functioned as options as they were convertible into Class A common shares after vesting and payment of the conversion price. Adjusted operating common shares outstanding assumes conversion or settlement of all outstanding items that are able to be converted to or settled in Class A common shares, including the impacts of Class B common shares on a one-for-one basis, the impacts of all Class M common shares net of the conversion price and any other stock-based awards, but excluding any awards for which the exercise or conversion price exceeds the market value of our Class A common shares on the applicable measurement date. For certain historical periods, Class M shares were not included due to issuance restrictions which were contingent upon our IPO. Adjusted operating common shares outstanding and adjusted book value per common share should not be used as a substitute for common shares outstanding – Class A or book value per common share. However, we believe the adjustments to the shares and equity are significant to gaining an understanding of our overall results of operations and financial condition. Adjusted Debt to Capital Ratio Adjusted debt to capital ratio is a non-GAAP measure used to evaluate our capital structure excluding the impacts of AOCI and the cumulative change in fair value of funds withheld and modco reinsurance assets, net of DAC, DSI, rider reserve and tax offsets. Adjusted debt to capital ratio is calculated as total debt divided by adjusted AHL shareholders’ equity. Adjusted debt to capital ratio should not be used as a substitute for the debt to capital ratio. However, we believe the adjustments to shareholders’ equity are significant to gaining an understanding of our capitalization, debt utilization and debt capacity. APOLLO INVESTOR DAY 2021

Endnotes APOLLO INVESTOR DAY 2021Endnotes APOLLO INVESTOR DAY 2021
Endnotes STRATEGY & OUTLOOK We Produce Excess Return Across the Risk Spectrum 1. As of 1Q21, trailing 5-year average yield of comparable quality and duration US corporate bond indices at the time of HGA Investment Grade Issuance or Purchase. 2. Peers represent a weighted average of AEL, AIG, AFG, FGL, LNC, MET, PRU, and PFG for the 5 years 2016 to 2020. Source: SNL Financial, Company Filings. Net asset yield calculated based on average stat investment yield on bonds and mortgages disclosed in annual U.S. life insurance statutory fillings. Stat investment yield reduced for each company’s respective investment fees and expenses approximated by taking annual GAAP investment expenses divided by average GAAP invested assets. Athene’s stat investment yield was adjusted to include assets in Bermuda entities and separate accounts backing pension risk transfer transactions, and to back out the impact of the larger Lincoln and Jackson National block trades during their respective 12 months deployment periods, as well as the impact of PRT transactions >$750mm that closed in December on yields in the year that they closed. The Apollo Large Corporate Credit universe was selected to include publicly priced syndicated loans, denominated in USD, that had at least $100mm of market value held across the Apollo credit platform from January 2015 to June 2021. Market value includes accrued income. P&L and returns exclude FX gains and losses as well as cash and cash equivalents. Returns are calculated daily on a gross basis and are geometrically linked, annualized and assumes one turn of leverage with no cost of leverage. 3. As provided by ThomsonOne. Represents total U.S. Credit Opportunities, Senior Debt and Subordinated Capital funds with 2018 vintages net IRR through Q1 2021. 4. Reflects composite returns of Accord Fund I, Accord Fund II, Accord Fund III, Accord Fund III B and Accord Fund IV from the date of the funding of Accord Fund I’s first call in February 2017 through June 30, 2021. 5. As provided by Cambridge Associates, as of Q1 2021. Represents total U.S. Credit Opportunities, Senior Debt and Subordinated Capital funds with 2018 vintages net IRR through Q1 2021. Reflects latest data available. 6. As provided by Cambridge Associates, as of Q1 2021. Represents total U.S. Credit Opportunities, Senior Debt, Subordinated Capital and Buyout funds with 2018 vintages net IRR through Q1 2021. Reflects latest data available. 7. As provided by Cambridge Associates, as of Q1 2021. Reflects latest data available. 8. Flagship PE represents Funds I-IX. Strategy AUM includes co-invest. Our Flagship Products Have Meaningfully Outperformed 1. Peers represent a weighted average of AEL, AIG, AFG, FGL, LNC, MET, PRU, and PFG for the 5 years 2016 to 2020. Source: SNL Financial, Company Filings. Net asset yield calculated based on average stat investment yield on bonds and mortgages disclosed in annual U.S. life insurance statutory fillings. Stat investment yield reduced for each company’s respective investment fees and expenses approximated by taking annual GAAP investment expenses divided by average GAAP invested assets. Athene’s stat investment yield was adjusted to include assets in Bermuda entities and separate accounts backing pension risk transfer transactions, and to back out the impact of the larger Lincoln and Jackson National block trades during their respective 12 months deployment periods, as well as the impact of PRT transactions >$750mm that closed in December on yields in the year that they closed. The Apollo Large Corporate Credit universe was selected to include publicly priced syndicated loans, denominated in USD, that had at least $100mm of market value held across the Apollo credit platform from January 2015 to June 2021. Market value includes accrued income. P&L and returns exclude FX gains and losses as well as cash and cash equivalents. Returns are calculated daily on a gross basis and are geometrically linked, annualized and assumes one turn of leverage with no cost of leverage. 2. Reflects composite returns of Accord Fund I, Accord Fund II, Accord Fund III, Accord Fund III B and Accord Fund IV from the date of the funding of Accord Fund I’s first call in February 2017 through June 30, 2021. 3. Benchmark provided by Cambridge Associates, as of Q1 2021. Represents total U.S. Credit Opportunities, Senior Debt and Subordinated Capital funds with 2018 vintages net IRR through Q1 2021. Reflects latest data available. 4. Benchmark provided by Cambridge Associates, as of Q1 2021. Represents total U.S. Credit Opportunities, Senior Debt, Subordinated Capital and Buyout funds with 2018 vintages net IRR through Q1 2021. Reflects latest data available. 5. Flagship PE represents Funds I-IX. Strategy AUM includes co-invest. 6. Benchmark provided by Cambridge Associates, as of Q1 2021. Reflects latest data available. APOLLO INVESTOR DAY 2021Endnotes STRATEGY & OUTLOOK We Produce Excess Return Across the Risk Spectrum 1. As of 1Q21, trailing 5-year average yield of comparable quality and duration US corporate bond indices at the time of HGA Investment Grade Issuance or Purchase. 2. Peers represent a weighted average of AEL, AIG, AFG, FGL, LNC, MET, PRU, and PFG for the 5 years 2016 to 2020. Source: SNL Financial, Company Filings. Net asset yield calculated based on average stat investment yield on bonds and mortgages disclosed in annual U.S. life insurance statutory fillings. Stat investment yield reduced for each company’s respective investment fees and expenses approximated by taking annual GAAP investment expenses divided by average GAAP invested assets. Athene’s stat investment yield was adjusted to include assets in Bermuda entities and separate accounts backing pension risk transfer transactions, and to back out the impact of the larger Lincoln and Jackson National block trades during their respective 12 months deployment periods, as well as the impact of PRT transactions >$750mm that closed in December on yields in the year that they closed. The Apollo Large Corporate Credit universe was selected to include publicly priced syndicated loans, denominated in USD, that had at least $100mm of market value held across the Apollo credit platform from January 2015 to June 2021. Market value includes accrued income. P&L and returns exclude FX gains and losses as well as cash and cash equivalents. Returns are calculated daily on a gross basis and are geometrically linked, annualized and assumes one turn of leverage with no cost of leverage. 3. As provided by ThomsonOne. Represents total U.S. Credit Opportunities, Senior Debt and Subordinated Capital funds with 2018 vintages net IRR through Q1 2021. 4. Reflects composite returns of Accord Fund I, Accord Fund II, Accord Fund III, Accord Fund III B and Accord Fund IV from the date of the funding of Accord Fund I’s first call in February 2017 through June 30, 2021. 5. As provided by Cambridge Associates, as of Q1 2021. Represents total U.S. Credit Opportunities, Senior Debt and Subordinated Capital funds with 2018 vintages net IRR through Q1 2021. Reflects latest data available. 6. As provided by Cambridge Associates, as of Q1 2021. Represents total U.S. Credit Opportunities, Senior Debt, Subordinated Capital and Buyout funds with 2018 vintages net IRR through Q1 2021. Reflects latest data available. 7. As provided by Cambridge Associates, as of Q1 2021. Reflects latest data available. 8. Flagship PE represents Funds I-IX. Strategy AUM includes co-invest. Our Flagship Products Have Meaningfully Outperformed 1. Peers represent a weighted average of AEL, AIG, AFG, FGL, LNC, MET, PRU, and PFG for the 5 years 2016 to 2020. Source: SNL Financial, Company Filings. Net asset yield calculated based on average stat investment yield on bonds and mortgages disclosed in annual U.S. life insurance statutory fillings. Stat investment yield reduced for each company’s respective investment fees and expenses approximated by taking annual GAAP investment expenses divided by average GAAP invested assets. Athene’s stat investment yield was adjusted to include assets in Bermuda entities and separate accounts backing pension risk transfer transactions, and to back out the impact of the larger Lincoln and Jackson National block trades during their respective 12 months deployment periods, as well as the impact of PRT transactions >$750mm that closed in December on yields in the year that they closed. The Apollo Large Corporate Credit universe was selected to include publicly priced syndicated loans, denominated in USD, that had at least $100mm of market value held across the Apollo credit platform from January 2015 to June 2021. Market value includes accrued income. P&L and returns exclude FX gains and losses as well as cash and cash equivalents. Returns are calculated daily on a gross basis and are geometrically linked, annualized and assumes one turn of leverage with no cost of leverage. 2. Reflects composite returns of Accord Fund I, Accord Fund II, Accord Fund III, Accord Fund III B and Accord Fund IV from the date of the funding of Accord Fund I’s first call in February 2017 through June 30, 2021. 3. Benchmark provided by Cambridge Associates, as of Q1 2021. Represents total U.S. Credit Opportunities, Senior Debt and Subordinated Capital funds with 2018 vintages net IRR through Q1 2021. Reflects latest data available. 4. Benchmark provided by Cambridge Associates, as of Q1 2021. Represents total U.S. Credit Opportunities, Senior Debt, Subordinated Capital and Buyout funds with 2018 vintages net IRR through Q1 2021. Reflects latest data available. 5. Flagship PE represents Funds I-IX. Strategy AUM includes co-invest. 6. Benchmark provided by Cambridge Associates, as of Q1 2021. Reflects latest data available. APOLLO INVESTOR DAY 2021
Endnotes STRATEGY & OUTLOOK Athene Has A Simple, Spread-Based Business Model 1. Net asset yield calculated based on average stat investment yield on bonds and mortgages disclosed in annual U.S. life insurance statutory fillings. Stat investment yield reduced for each company’s respective investment fees and expenses approximated by taking annual GAAP investment expenses divided by average GAAP invested assets. Athene’s stat investment yield was adjusted to include assets in Bermuda entities and separate accounts backing pension risk transfer transactions, and to back out the impact of the larger Lincoln and Jackson National block trades during their respective 12 months deployment periods, as well as the impact of PRT transactions >$750mm that closed in December on yields in the year that they closed. 2. General and administrative expense ratios calculated as U.S. statutory general & administrative expenses divided by average U.S. statutory net total assets. 3. Adjusted operating income for common shareholders excluding Apollo divided by average net invested assets excluding AOG. 4. 13x leverage for illustrative purposes. 5. Adjusted Operating ROE as reported externally. Athene is Uniquely Positioned in the Industry 1. Athene metrics are net of non-controlling interest in ACRA, as of June 30, 2021. AA-/A+ Rated Companies metrics as of December 31, 2020 per SNL Financial. AA-/A+ Rated Companies are: PFG (A+), PRU (AA-), MET (AA-) and GL (AA-). 2. Refers to adjusted debt-to-capital ratio as of June 30, 2021. AA-/A+ Rated Companies metrics as of December 31, 2020. AA-/A+ Rated Companies are: PFG (A+), PRU (AA-), MET (AA-) and GL (AA-). 3. Peer U.S. statutory impairments per SNL Financial, average includes AEL, AIG, AMP, BHF, EQH, FG, LNC, MET, PFG, PRU, VOYA and Transamerica. For Athene, U.S. statutory data adjusted to include impairments and assets in Bermuda Linked presentations are not incorporated by reference. 4. General and administrative expense ratios calculated as U.S. statutory general & administrative expenses divided by average U.S. statutory net total assets. “Industry” represents a weighted average of AEL, AIG, AFG, FGL, LNC, MET, PRU, and PFG for the 5 years 2016 to 2020. Athene Represents a Strategic Purchase for Apollo 1. Pre-deal share price as of March 5, 2021. Current share price as of October 15, 2021. 2. Apollo will consolidate 100% of Athene earnings as Apollo does not consolidate earnings on its stake in Athene pre-merger. Excludes reported or forecasted earnings from Athene’s investment in Apollo Operating Group. 3. Athene adjusted operating income excludes earnings on stake in Apollo. Pro forma consensus 2021E calculated as consensus pre-tax income, less illustrative assumed taxes at 18% tax rate, less consensus preferred dividends. Consensus as of March 3, 2021 based on average of available research analyst projections. 4. Athene adjusted operating income excludes earnings on stake in Apollo. Pro forma consensus 2021E calculated as consensus pre-tax income, less consensus preferred dividends and taxes. Consensus as of August 8, 2021 based on average of available research analyst projections. APOLLO INVESTOR DAY 2021Endnotes STRATEGY & OUTLOOK Athene Has A Simple, Spread-Based Business Model 1. Net asset yield calculated based on average stat investment yield on bonds and mortgages disclosed in annual U.S. life insurance statutory fillings. Stat investment yield reduced for each company’s respective investment fees and expenses approximated by taking annual GAAP investment expenses divided by average GAAP invested assets. Athene’s stat investment yield was adjusted to include assets in Bermuda entities and separate accounts backing pension risk transfer transactions, and to back out the impact of the larger Lincoln and Jackson National block trades during their respective 12 months deployment periods, as well as the impact of PRT transactions >$750mm that closed in December on yields in the year that they closed. 2. General and administrative expense ratios calculated as U.S. statutory general & administrative expenses divided by average U.S. statutory net total assets. 3. Adjusted operating income for common shareholders excluding Apollo divided by average net invested assets excluding AOG. 4. 13x leverage for illustrative purposes. 5. Adjusted Operating ROE as reported externally. Athene is Uniquely Positioned in the Industry 1. Athene metrics are net of non-controlling interest in ACRA, as of June 30, 2021. AA-/A+ Rated Companies metrics as of December 31, 2020 per SNL Financial. AA-/A+ Rated Companies are: PFG (A+), PRU (AA-), MET (AA-) and GL (AA-). 2. Refers to adjusted debt-to-capital ratio as of June 30, 2021. AA-/A+ Rated Companies metrics as of December 31, 2020. AA-/A+ Rated Companies are: PFG (A+), PRU (AA-), MET (AA-) and GL (AA-). 3. Peer U.S. statutory impairments per SNL Financial, average includes AEL, AIG, AMP, BHF, EQH, FG, LNC, MET, PFG, PRU, VOYA and Transamerica. For Athene, U.S. statutory data adjusted to include impairments and assets in Bermuda Linked presentations are not incorporated by reference. 4. General and administrative expense ratios calculated as U.S. statutory general & administrative expenses divided by average U.S. statutory net total assets. “Industry” represents a weighted average of AEL, AIG, AFG, FGL, LNC, MET, PRU, and PFG for the 5 years 2016 to 2020. Athene Represents a Strategic Purchase for Apollo 1. Pre-deal share price as of March 5, 2021. Current share price as of October 15, 2021. 2. Apollo will consolidate 100% of Athene earnings as Apollo does not consolidate earnings on its stake in Athene pre-merger. Excludes reported or forecasted earnings from Athene’s investment in Apollo Operating Group. 3. Athene adjusted operating income excludes earnings on stake in Apollo. Pro forma consensus 2021E calculated as consensus pre-tax income, less illustrative assumed taxes at 18% tax rate, less consensus preferred dividends. Consensus as of March 3, 2021 based on average of available research analyst projections. 4. Athene adjusted operating income excludes earnings on stake in Apollo. Pro forma consensus 2021E calculated as consensus pre-tax income, less consensus preferred dividends and taxes. Consensus as of August 8, 2021 based on average of available research analyst projections. APOLLO INVESTOR DAY 2021
Endnotes YIELD OVERVIEW Historical Success by Being a First Mover 1. Net asset yield calculated based on average stat investment yield on bonds and mortgages disclosed in annual U.S. life insurance statutory fillings. Stat investment yield reduced for each company’s respective investment fees and expenses approximated by taking annual GAAP investment expenses divided by average GAAP invested assets. Athene’s stat investment yield was adjusted to include assets in Bermuda entities and separate accounts backing pension risk transfer transactions, and to back out the impact of the larger Lincoln and Jackson National block trades during their respective 12 months deployment periods, as well as the impact of PRT transactions >$750mm that closed in December on yields in the year that they closed. Peers represent a weighted average of AEL, AIG, AFG, FGL, LNC, MET, PRU, and PFG for the 5 years 2016 to 2020. EQUITY & HYBRID OVERVIEW Scaling Strategies Have Large Opportunity for Growth 1. Total Co-Invest includes traditional co-invest and capital sourced and placed by Apollo to third parties outside of Apollo managed funds. Reflected as a multiple of total invested capital raised for relevant strategy, rounded to nearest half. 2. AUM includes Apollo U.S. Real Estate and Asia Real Estate Equity, European Principal Finance, and Hybrid Real Estate. Excess Co-Invest includes Apollo U.S. Real Estate and Asia Real Estate Equity. RETIREMENT SERVICES OVERVIEW Our Retirement Services Footprint is Going Global, and the Market Opportunity is Enormous 1. Comprised of: $1.2 trillion US general account annuities reported on US statutory statements as of year-end 2020 as aggregated by SNL Financial. $1.4 trillion in US Pension Group Annuities, based on 2020 year-end private-sector defined benefit liabilities per US Federal Reserve, assuming 20% of plans are active and used for employee attraction/retention, and that 50% of the remainder back current retirees and define the market for pension risk transfer. $1.1 trillion in US Defined Contribution plan annuities applying assumed 15% allocation to the $7.2 trillion US record keeper market. 2. Comprised of: $5.5 trillion European Life and Annuities market as of June 30, 2021, per ECB Data Warehouse. $0.9 trillion UK Pension Risk Transfer Market based on assets backing retirees of closed pension plans as of March 2020 per Pension Protection Fund. $0.6 trillion EU Pension Risk Transfer Market based on EU pension assets excluding Switzerland per OECD as of 2019, assuming a 90% of assets sit in defined benefit plans and 20% of those assets back current retirees. 3. Comprised of: $2.4 trillion China Life and Annuities market per China Banking and Insurance Regulatory Commission, $1.0 trillion Taiwan Life and Annuities market per Taiwan Insurance Institute, $0.8 trillion Korea Life and Annuities market per Korean Life Insurance Association, and $0.3 trillion Hong Kong Life and Annuities market per HKIA as of Q4 2019. 4. Japan Life and Annuities market as of March 2020 per Life Insurance Association of Japan 5. $3.0 trillion AUD ($2.2 trillion USD) in SuperFunds per APRA as of June 30, 2021, multiplied by a 20% recommend allocation to lifetime annuities in Australian Treasury’s Retirement Income Covenant Position Paper (2018). 5. Total superannuation assets in Australia as of June 30, 2021, converted to USD using a 0.75x exchange rate. Massive Landscape of Upside Opportunities 1. Comprised of: $2.4 trillion China Life and Annuities market per China Banking and Insurance Regulatory Commission, $1.0 trillion Taiwan Life and Annuities market per Taiwan Insurance Institute, $0.8 trillion Korea Life and Annuities market per Korean Life Insurance Association, $0.3 trillion Hong Kong Life and Annuities market per HKIA as of Q4 2019, and $3.0 trillion Japan Life and Annuities market as of March 2020 per Life Insurance Association of Japan. 2. As of June 30, 2021. Source: ECB Data Warehouse. 3. 2020 year-end private-sector defined benefit liabilities per US Federal Reserve, assuming 20% of plans are active and used for employee attraction/retention, and that 50% of the remainder back current retirees and determine the market for pension risk transfer. 4. Comprised of: $0.9 trillion UK Pension Risk Transfer Market based on assets backing retirees of closed pension plans as of March 2020 per Pension Protection Fund and $0.6 trillion EU Pension Risk Transfer Market based on total EU pension assets excluding Switzerland per OECD as of 2019, assuming a 90% of assets sit in defined benefit plans and 20% of those assets back current retirees. APOLLO INVESTOR DAY 2021Endnotes YIELD OVERVIEW Historical Success by Being a First Mover 1. Net asset yield calculated based on average stat investment yield on bonds and mortgages disclosed in annual U.S. life insurance statutory fillings. Stat investment yield reduced for each company’s respective investment fees and expenses approximated by taking annual GAAP investment expenses divided by average GAAP invested assets. Athene’s stat investment yield was adjusted to include assets in Bermuda entities and separate accounts backing pension risk transfer transactions, and to back out the impact of the larger Lincoln and Jackson National block trades during their respective 12 months deployment periods, as well as the impact of PRT transactions >$750mm that closed in December on yields in the year that they closed. Peers represent a weighted average of AEL, AIG, AFG, FGL, LNC, MET, PRU, and PFG for the 5 years 2016 to 2020. EQUITY & HYBRID OVERVIEW Scaling Strategies Have Large Opportunity for Growth 1. Total Co-Invest includes traditional co-invest and capital sourced and placed by Apollo to third parties outside of Apollo managed funds. Reflected as a multiple of total invested capital raised for relevant strategy, rounded to nearest half. 2. AUM includes Apollo U.S. Real Estate and Asia Real Estate Equity, European Principal Finance, and Hybrid Real Estate. Excess Co-Invest includes Apollo U.S. Real Estate and Asia Real Estate Equity. RETIREMENT SERVICES OVERVIEW Our Retirement Services Footprint is Going Global, and the Market Opportunity is Enormous 1. Comprised of: $1.2 trillion US general account annuities reported on US statutory statements as of year-end 2020 as aggregated by SNL Financial. $1.4 trillion in US Pension Group Annuities, based on 2020 year-end private-sector defined benefit liabilities per US Federal Reserve, assuming 20% of plans are active and used for employee attraction/retention, and that 50% of the remainder back current retirees and define the market for pension risk transfer. $1.1 trillion in US Defined Contribution plan annuities applying assumed 15% allocation to the $7.2 trillion US record keeper market. 2. Comprised of: $5.5 trillion European Life and Annuities market as of June 30, 2021, per ECB Data Warehouse. $0.9 trillion UK Pension Risk Transfer Market based on assets backing retirees of closed pension plans as of March 2020 per Pension Protection Fund. $0.6 trillion EU Pension Risk Transfer Market based on EU pension assets excluding Switzerland per OECD as of 2019, assuming a 90% of assets sit in defined benefit plans and 20% of those assets back current retirees. 3. Comprised of: $2.4 trillion China Life and Annuities market per China Banking and Insurance Regulatory Commission, $1.0 trillion Taiwan Life and Annuities market per Taiwan Insurance Institute, $0.8 trillion Korea Life and Annuities market per Korean Life Insurance Association, and $0.3 trillion Hong Kong Life and Annuities market per HKIA as of Q4 2019. 4. Japan Life and Annuities market as of March 2020 per Life Insurance Association of Japan 5. $3.0 trillion AUD ($2.2 trillion USD) in SuperFunds per APRA as of June 30, 2021, multiplied by a 20% recommend allocation to lifetime annuities in Australian Treasury’s Retirement Income Covenant Position Paper (2018). 5. Total superannuation assets in Australia as of June 30, 2021, converted to USD using a 0.75x exchange rate. Massive Landscape of Upside Opportunities 1. Comprised of: $2.4 trillion China Life and Annuities market per China Banking and Insurance Regulatory Commission, $1.0 trillion Taiwan Life and Annuities market per Taiwan Insurance Institute, $0.8 trillion Korea Life and Annuities market per Korean Life Insurance Association, $0.3 trillion Hong Kong Life and Annuities market per HKIA as of Q4 2019, and $3.0 trillion Japan Life and Annuities market as of March 2020 per Life Insurance Association of Japan. 2. As of June 30, 2021. Source: ECB Data Warehouse. 3. 2020 year-end private-sector defined benefit liabilities per US Federal Reserve, assuming 20% of plans are active and used for employee attraction/retention, and that 50% of the remainder back current retirees and determine the market for pension risk transfer. 4. Comprised of: $0.9 trillion UK Pension Risk Transfer Market based on assets backing retirees of closed pension plans as of March 2020 per Pension Protection Fund and $0.6 trillion EU Pension Risk Transfer Market based on total EU pension assets excluding Switzerland per OECD as of 2019, assuming a 90% of assets sit in defined benefit plans and 20% of those assets back current retirees. APOLLO INVESTOR DAY 2021
Endnotes ATHENE Athene’s Advantages Drive Value Creation 1. Net asset yield calculated based on average stat investment yield on bonds and mortgages disclosed in annual U.S. life insurance statutory fillings. Stat investment yield reduced for each company’s respective investment fees and expenses approximated by taking annual GAAP investment expenses divided by average GAAP invested assets. Athene’s stat investment yield was adjusted to include assets in Bermuda entities and separate accounts backing pension risk transfer transactions, and to back out the impact of the larger Lincoln and Jackson National block trades during their respective 12 months deployment periods, as well as the impact of PRT transactions >$750mm that closed in December on yields in the year that they closed. 2. General and administrative expense ratios calculated as U.S. statutory general & administrative expenses divided by average U.S. statutory net total assets. 3. Peer adjusted operating ROE data calculated as an average of AEL, AIG, AFG, FGL, LNC, MET, PRU, and PFG. The Opportunity Set is Vast 1. Cumulative inflows since inception for PGA and Funding Agreements, since 2014 for Retail. 2. US Fixed Annuities and Fixed Indexed Annuities combined $1.2 trillion represents US general account annuities reported on US statutory statements as of year-end 2020 as aggregated by SNL Financial. Split between $0.7 trillion of cumulative industry sales over assumed duration of 6 years for Fixed Annuities and $0.5 trillion of cumulative industry sales over assumed duration of 10 years for Fixed Indexed Annuities. Source: JP Morgan Market Share Bible 2021. 3. As of March 2020. Source: Goldman Sachs, Japan Institute of Life Insurance “Life Insurance Fact-finding Survey in Japan”. 4. 2020 year-end private-sector defined benefit liabilities per US Federal Reserve, assuming 20% of plans are active and used for employee attraction/retention, and that 50% of the remainder back current retirees and determine the market for pension risk transfer. 5. As of March 2020. Source: Pension Protection Fund. 6. As of September 2021. Sources: BNP Paribas, Bloomberg, EURONEXT / Irish Stock Exchange, Company Filings. Athene Generates Significant Capital to Fund Growth 1. Cash Flow From Earnings: estimated by changes in Statutory Capital & Surplus of Athene’s insurance entities excluding earnings from AOG shares, upfront gains from inorganic activities, and other one-time items. 2. Annual Capital Release from normal-course run-off: Approximate Capital Relief on decremented reserves under Athene’s monitored capital models. 3. Excess Equity Capital / Untapped Debt Capacity / Available Capital from Sidecar (ADIP) – as of 6/30/2021. 4. Trailing 3Y includes 3Q’18-2Q’21. We Run Our Business Aligned with Our Risk Appetite and in Consideration of Historical Events 1. 10yr US Treasury Yield: Feb 19, 2020 to COVID trough on Aug 4, 2020; Spreads: peak daily absolute spreads during 2020; Equity Markets: SPX pre-COVID peak on Feb 19, 2020 to COVID trough on Mar 23, 2021; FI defaults: peak TTM BBB and B US bond default rates during 2020; Housing price: No decline in TTM Corelogic National HPI index during 2020. 2. German 10-year bund yield. 3. Indicative levels, actual absolute spreads determined formulaically based on prevailing market spreads, predetermined spread multipliers and ceilings. 4. Primarily for representative purposes. Stress scenarios apply customized stresses as relevant for Alternatives sub-categories. Adjusted equities recession shock to reflect worst peak to trough drop, in place of average, during recession years (1990- 1991, 2001-2002). 5. Excludes Athene’s investment in Apollo Operating Group (AOG) units. Assumes mark-to-market impact on alternatives and prefers is unrealized and would be expected to recover over time, consistent with historical and recent experience. Total Excludes Athene’s investment in Apollo Operating Group (AOG) units. Mark to market impact on alternatives is unrealized and would be expected to recover over time, consistent with historical and recent experience. Total loss estimate is based upon a single scenario involving a discrete set of assumptions regarding economic conditions. Actual economic conditions in a stressed environments may differ significantly from those assumed and actual loss experience may differ from the estimate presented above and such difference could be material. 2020 STAT earnings and capital released from run-off. Illustrative management action above reflects issuing approximately 50% of Athene’s untapped debt capacity as of June 30, 2021. APOLLO INVESTOR DAY 2021Endnotes ATHENE Athene’s Advantages Drive Value Creation 1. Net asset yield calculated based on average stat investment yield on bonds and mortgages disclosed in annual U.S. life insurance statutory fillings. Stat investment yield reduced for each company’s respective investment fees and expenses approximated by taking annual GAAP investment expenses divided by average GAAP invested assets. Athene’s stat investment yield was adjusted to include assets in Bermuda entities and separate accounts backing pension risk transfer transactions, and to back out the impact of the larger Lincoln and Jackson National block trades during their respective 12 months deployment periods, as well as the impact of PRT transactions >$750mm that closed in December on yields in the year that they closed. 2. General and administrative expense ratios calculated as U.S. statutory general & administrative expenses divided by average U.S. statutory net total assets. 3. Peer adjusted operating ROE data calculated as an average of AEL, AIG, AFG, FGL, LNC, MET, PRU, and PFG. The Opportunity Set is Vast 1. Cumulative inflows since inception for PGA and Funding Agreements, since 2014 for Retail. 2. US Fixed Annuities and Fixed Indexed Annuities combined $1.2 trillion represents US general account annuities reported on US statutory statements as of year-end 2020 as aggregated by SNL Financial. Split between $0.7 trillion of cumulative industry sales over assumed duration of 6 years for Fixed Annuities and $0.5 trillion of cumulative industry sales over assumed duration of 10 years for Fixed Indexed Annuities. Source: JP Morgan Market Share Bible 2021. 3. As of March 2020. Source: Goldman Sachs, Japan Institute of Life Insurance “Life Insurance Fact-finding Survey in Japan”. 4. 2020 year-end private-sector defined benefit liabilities per US Federal Reserve, assuming 20% of plans are active and used for employee attraction/retention, and that 50% of the remainder back current retirees and determine the market for pension risk transfer. 5. As of March 2020. Source: Pension Protection Fund. 6. As of September 2021. Sources: BNP Paribas, Bloomberg, EURONEXT / Irish Stock Exchange, Company Filings. Athene Generates Significant Capital to Fund Growth 1. Cash Flow From Earnings: estimated by changes in Statutory Capital & Surplus of Athene’s insurance entities excluding earnings from AOG shares, upfront gains from inorganic activities, and other one-time items. 2. Annual Capital Release from normal-course run-off: Approximate Capital Relief on decremented reserves under Athene’s monitored capital models. 3. Excess Equity Capital / Untapped Debt Capacity / Available Capital from Sidecar (ADIP) – as of 6/30/2021. 4. Trailing 3Y includes 3Q’18-2Q’21. We Run Our Business Aligned with Our Risk Appetite and in Consideration of Historical Events 1. 10yr US Treasury Yield: Feb 19, 2020 to COVID trough on Aug 4, 2020; Spreads: peak daily absolute spreads during 2020; Equity Markets: SPX pre-COVID peak on Feb 19, 2020 to COVID trough on Mar 23, 2021; FI defaults: peak TTM BBB and B US bond default rates during 2020; Housing price: No decline in TTM Corelogic National HPI index during 2020. 2. German 10-year bund yield. 3. Indicative levels, actual absolute spreads determined formulaically based on prevailing market spreads, predetermined spread multipliers and ceilings. 4. Primarily for representative purposes. Stress scenarios apply customized stresses as relevant for Alternatives sub-categories. Adjusted equities recession shock to reflect worst peak to trough drop, in place of average, during recession years (1990- 1991, 2001-2002). 5. Excludes Athene’s investment in Apollo Operating Group (AOG) units. Assumes mark-to-market impact on alternatives and prefers is unrealized and would be expected to recover over time, consistent with historical and recent experience. Total Excludes Athene’s investment in Apollo Operating Group (AOG) units. Mark to market impact on alternatives is unrealized and would be expected to recover over time, consistent with historical and recent experience. Total loss estimate is based upon a single scenario involving a discrete set of assumptions regarding economic conditions. Actual economic conditions in a stressed environments may differ significantly from those assumed and actual loss experience may differ from the estimate presented above and such difference could be material. 2020 STAT earnings and capital released from run-off. Illustrative management action above reflects issuing approximately 50% of Athene’s untapped debt capacity as of June 30, 2021. APOLLO INVESTOR DAY 2021